How To Automate Your Work Orders In A Frontline Operations App
Use this step-by-step guide to track individual welds over the course of the day
Imagine that you use a schematic like this to guide welders on your production floor:
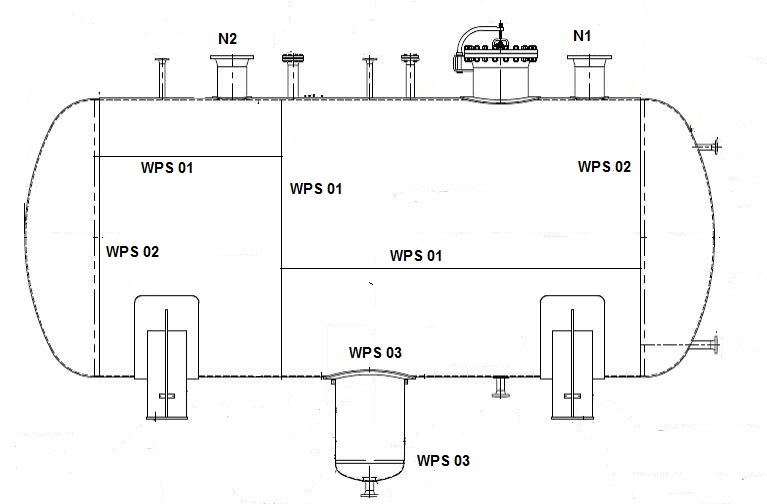
For this part, your operators will need to make 7 separate welds, and you want to make sure that an inspector reviews each one. You currently use a sheet with a series of entries like this to log each weld:

So, for each weld, the operator must log:
- The job number
- The weld description
- The time
- The O2 reading
- A/R
- An inspector’s signature
- The date
- Comments
That’s a lot of paperwork to enter into a computer at the end of the day. Instead, you can use a series of Form Steps and clickable diagrams in Tulip to capture data in real-time.
Please note- although this tutorial uses a welding example, any type of data entry within a work order will face similar challenges. This guide will help you build any app that allows operators to input work order data.
As you can see from the table entry above, the welder actually repeats the same weld on 2 separate parts in a row to reduce machine setup time. So, this app will have two repeated steps for each weld.
Also, the operator will “complete the app” after every set of two welds. This ensures that they will not have the same app open all day without registering a completion.

This app must have 3 types of steps:
- A Form Step to capture overall high-level work order information
- A clickable diagram where the welder can select the weld they are working on
- A Form Step to capture data on the specific weld
Here's a diagram of how the steps fit together:
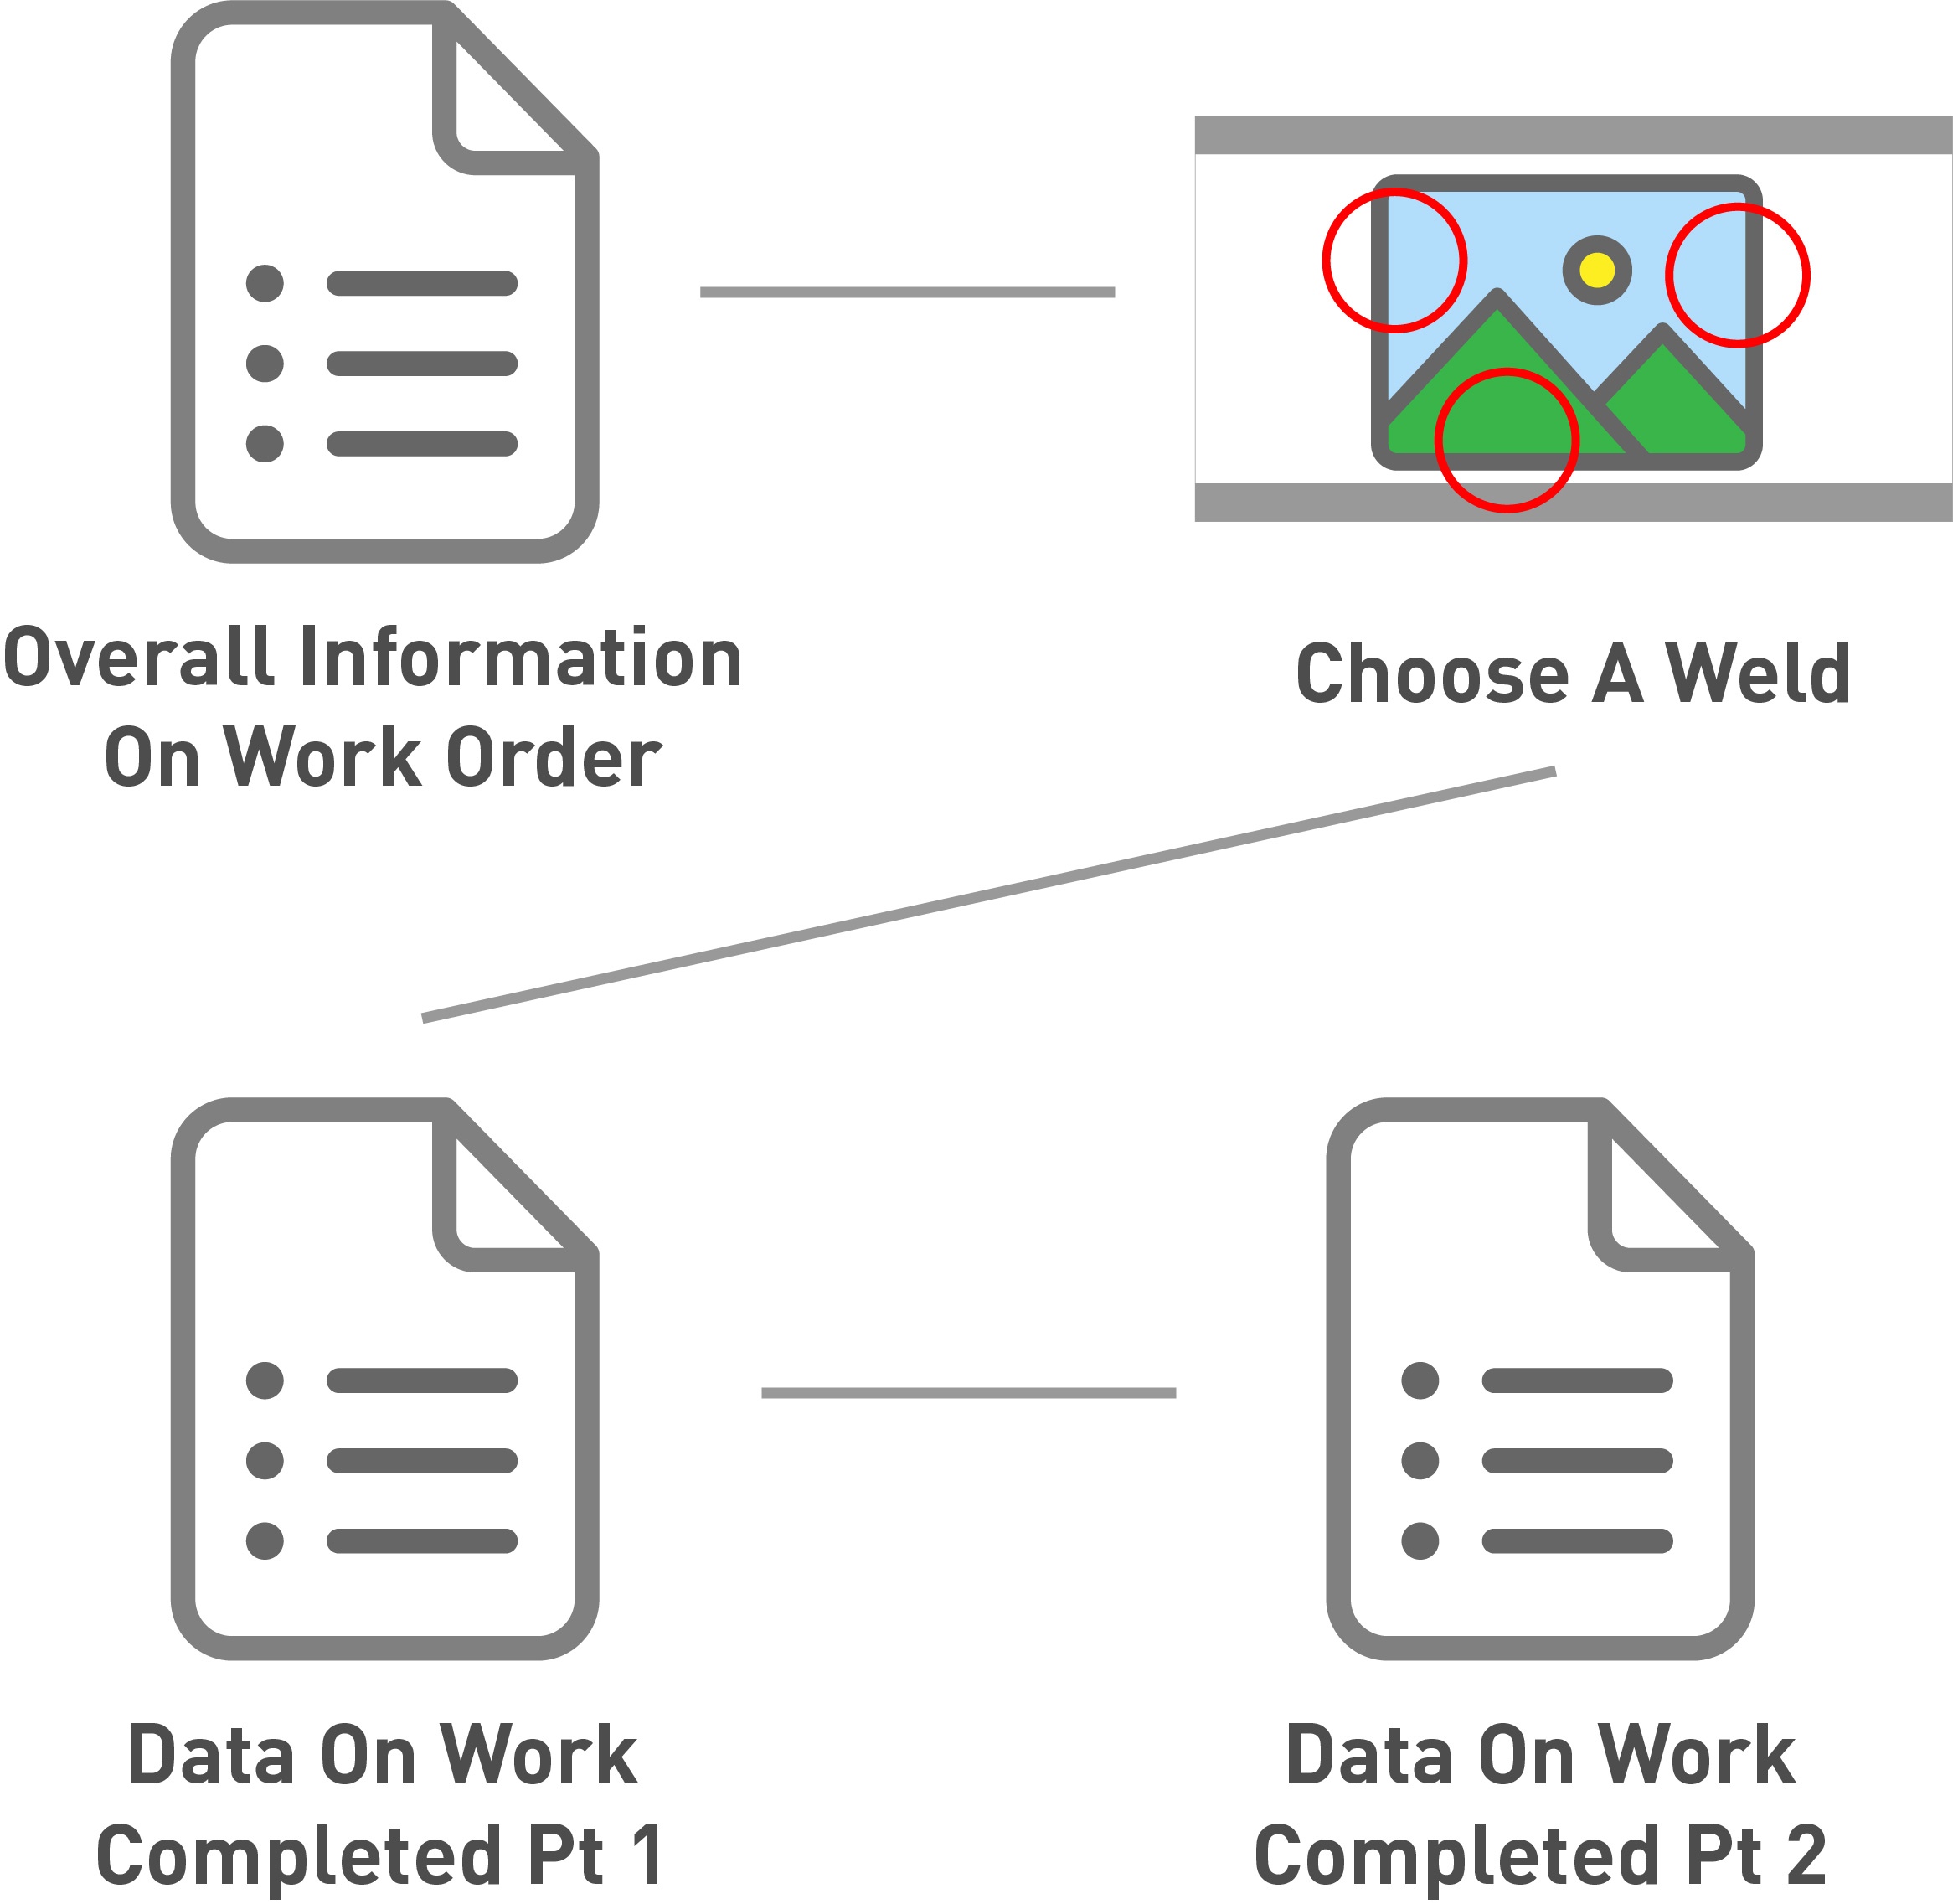
Here’s how to build an automated welding audit app.
Step 1- Overall Information
In this situation, the operator must enter high-level information at the top of their sheet every day. Here’s what it looks like:

Since the operator will be completing the app multiple times throughout the day, it doesn’t make sense to ask for this information at the beginning of each app.
Fortunately, you can use “persistent variables so that operators only need to re-enter data when something has changed. This form has the following fields:
- Date
- Job
- Purge
- Dewar Lot
- Dewar Serial
- Iso Number
- Tube Size
- Wall Thickness
- Welder ID
- Weld Machine ID Code
- Weld Head ID Code
- Weld Prog
- Coupon
Tulip can automatically track the Welder ID and date based on the operator that is logged into the Tulip Player and the current date, so there is no need to create fields for those two items.
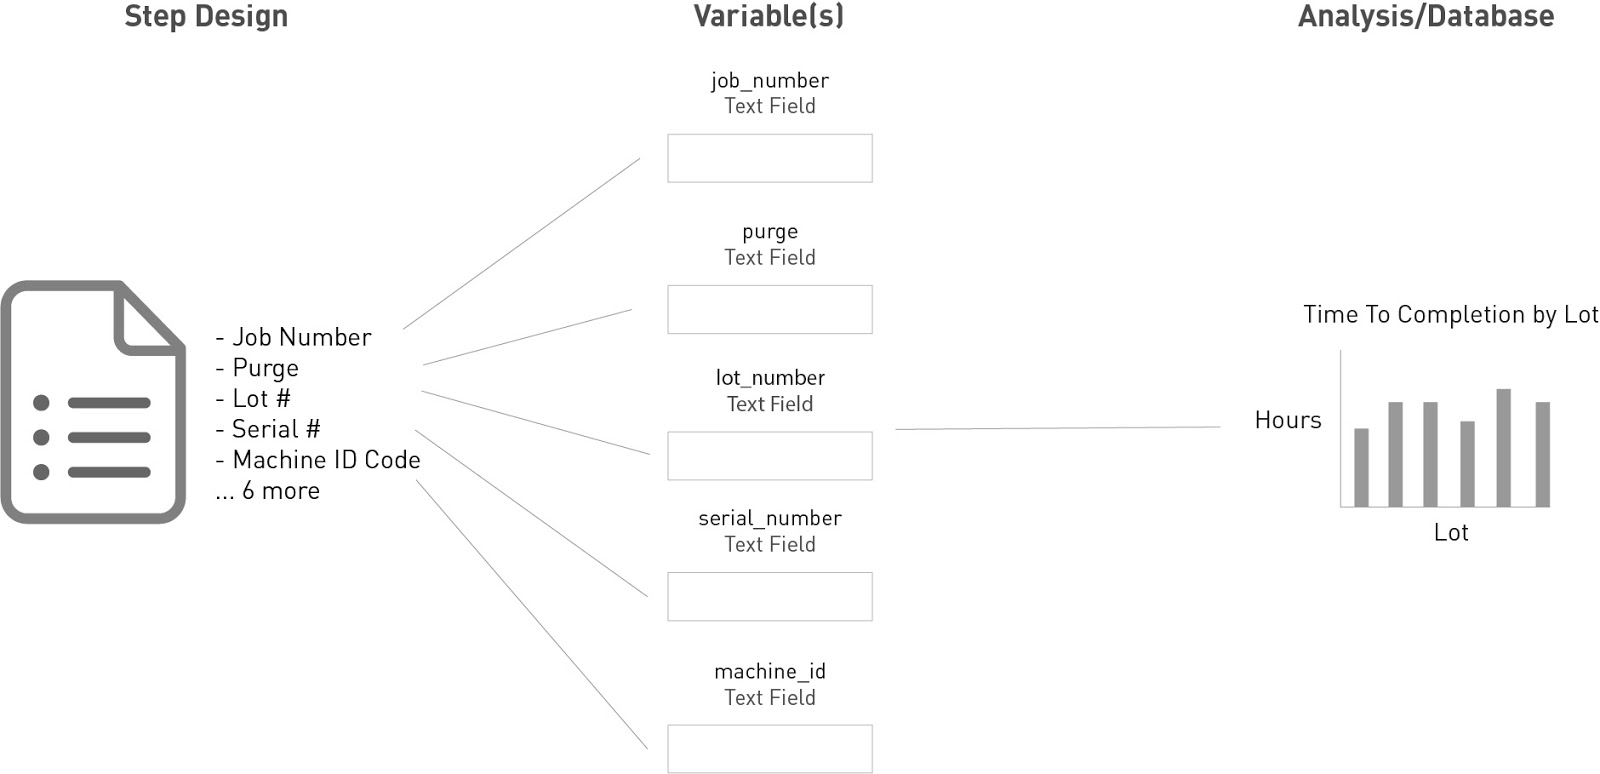
For everything else, you will need a Form Step with a combination of persistent variables and normal variables. You only want to use persistent variables for fields that will repeat across multiple consecutive app completions.
Building It In Tulip
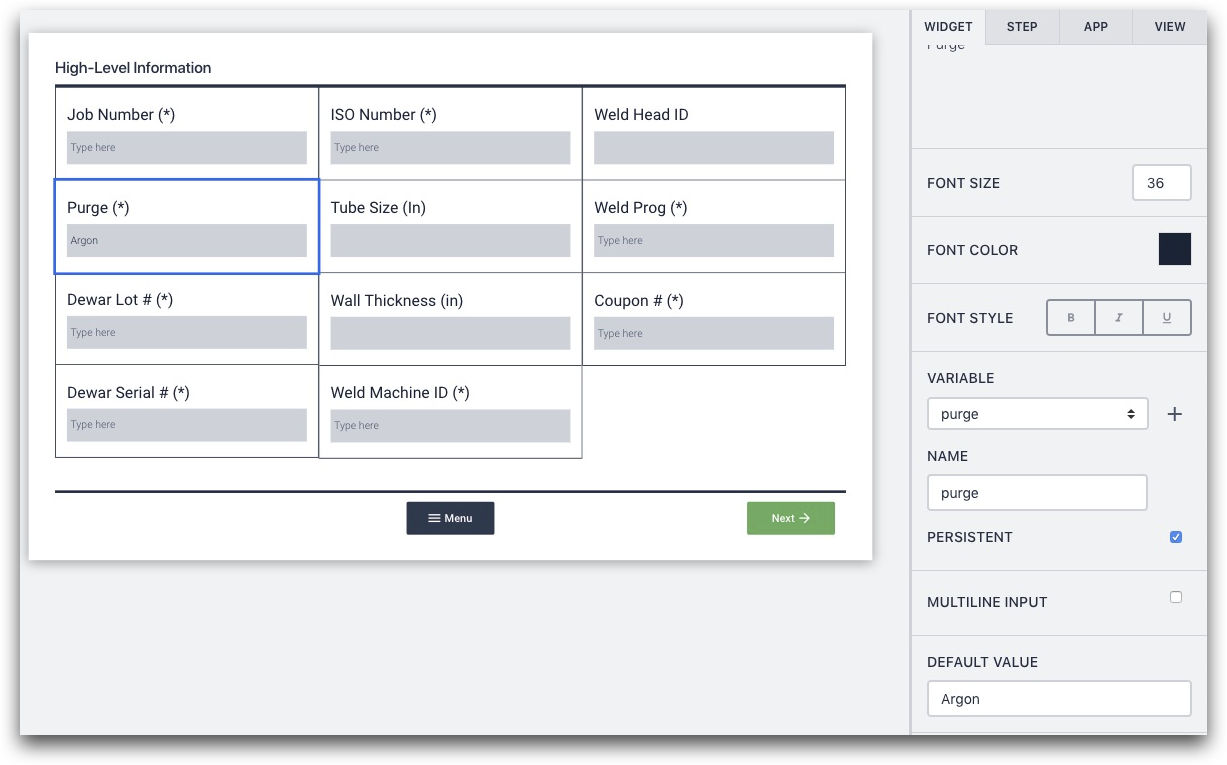
Here’s what the whole Form Step might look like:
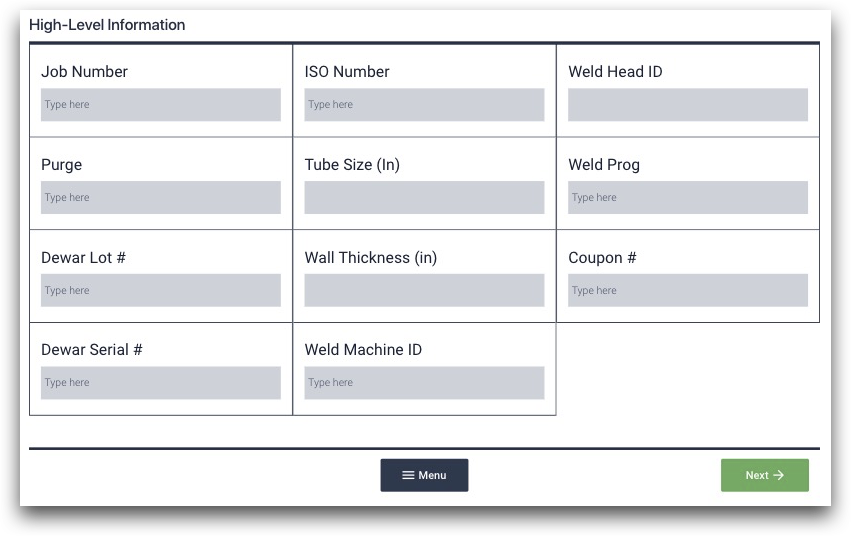
It has 11 fields, composed of text and number inputs. In order to create three columns, select the entire Form Step and then click the “Three Column” button in the Context Pane on the right of the App Editor.
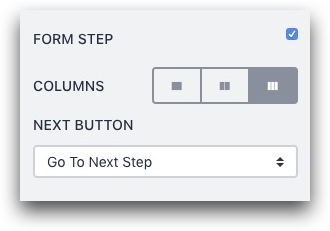
You will want to save each field in the form into your Tulip database so you can run analytics later. So, for each input, create a variable with an appropriate name.
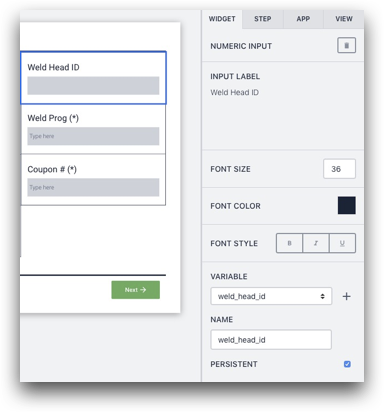
In the case of the “Weld Head ID Code” field, click “+” next to the Variable field in the Context Pane and name the variable “weld_head_id”. You may want to make it “persistent” as well since it does not change over the course of the day.
In other cases, you may want to use a “Default Value” since the value may never change at the specific workbench. For example, the value of the “Purge” field may always be “Argon” at the specific station, so you can add that as a default value so the operator never needs to change it.
Here's the Context Pane in more detail:
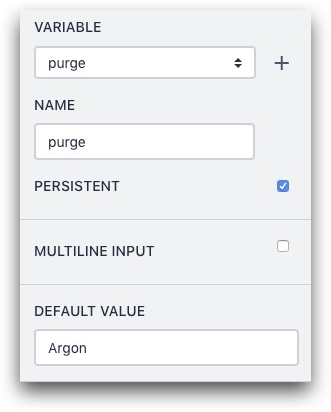
Go through and name all 11 variables. Add a "Default Value" when you never want the operator to change a field in the Form Step, and check the box for "Persistent" when you want them to enter data once, and not touch it again for hours.
Combining This Step With Other Steps
No matter what, this step will lead into the next step, where the operator will select the weld. But, the variables collected in this step will be valuable when you later create analytics. It will allow you to tie individual welds to these high-level data points.
Analytics Possibilities
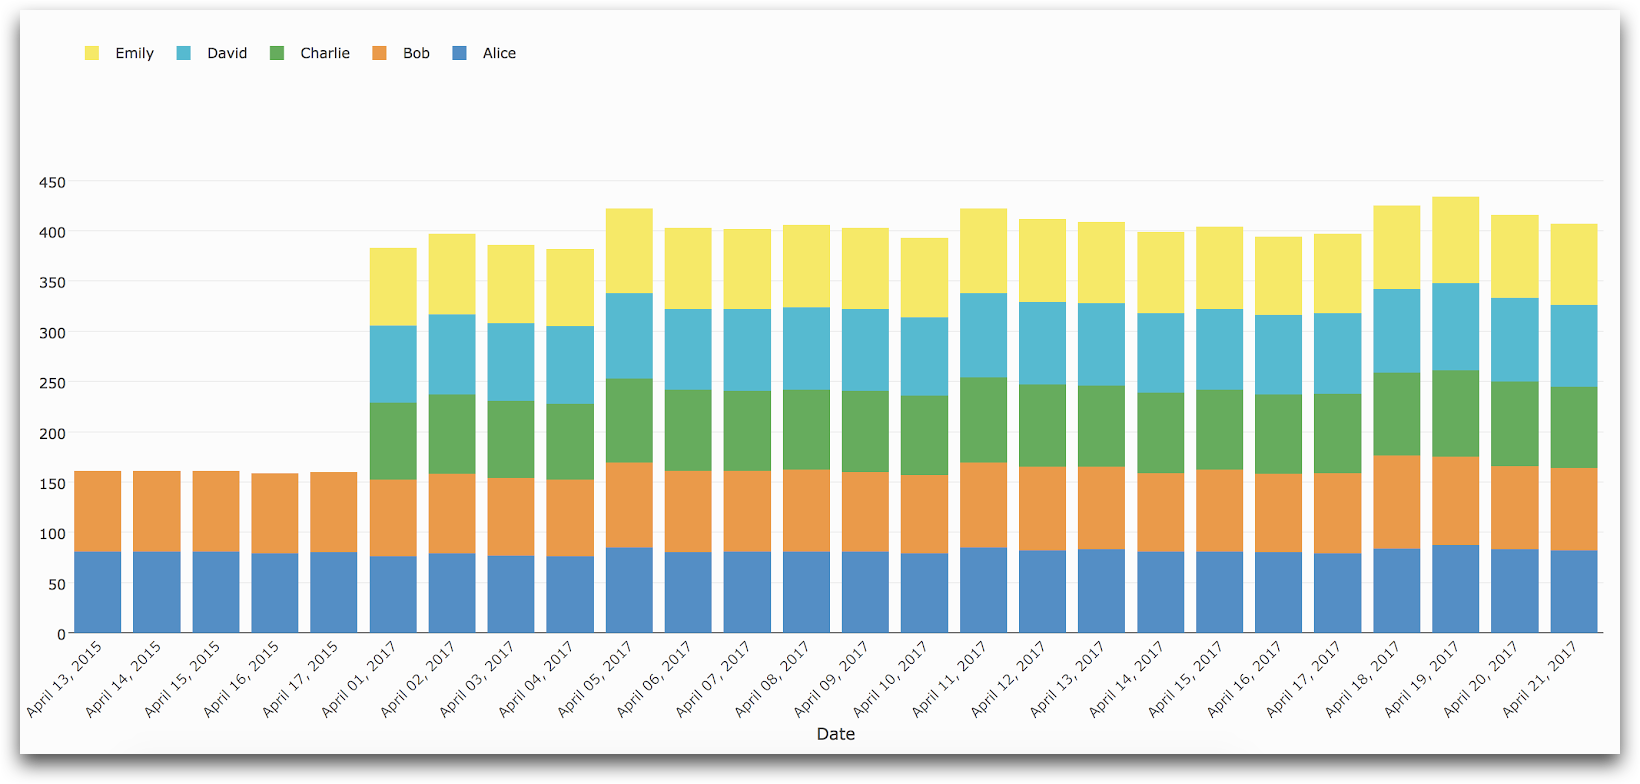
This presents plenty of possibilities for analytics. For example, you could use the “Compare Variables” Analysis to create a stacked bar chart with all the welds for each job number.
So, the Job Number would be on the X axis, and the “total time spent” would be on the Y axis. It would include all 7 welds on the particular job number.
Here’s an example of a stacked bar chart:
Further Reading
Step 2- Clickable Diagram

Since a welder will need to complete 7 welds for each part, you need an easy way for the welder to select each individual weld before adding data.
You could add 7 buttons to a Step, with text for each weld. In this case, you have a schematic, so you can give the weld information in the context of the entire part.
In order to create a clickable diagram, you just need to upload the schematic and create a series of invisible buttons. Here’s how to do that.
Building It In Tulip
Upload an image of the schematic onto your Step.
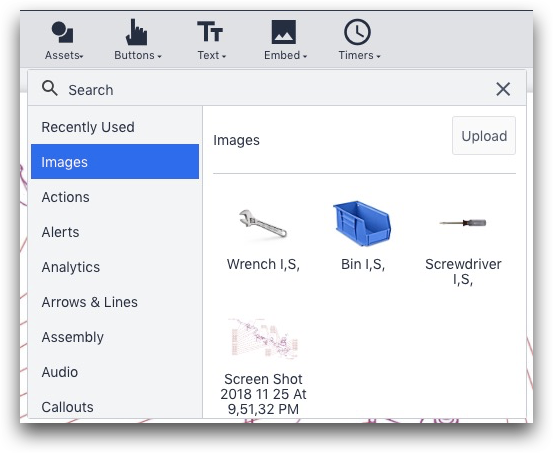
Then, create an invisible button over each weld number. Remove the default text in the button and change the color in the “Button Color” field to transparent.
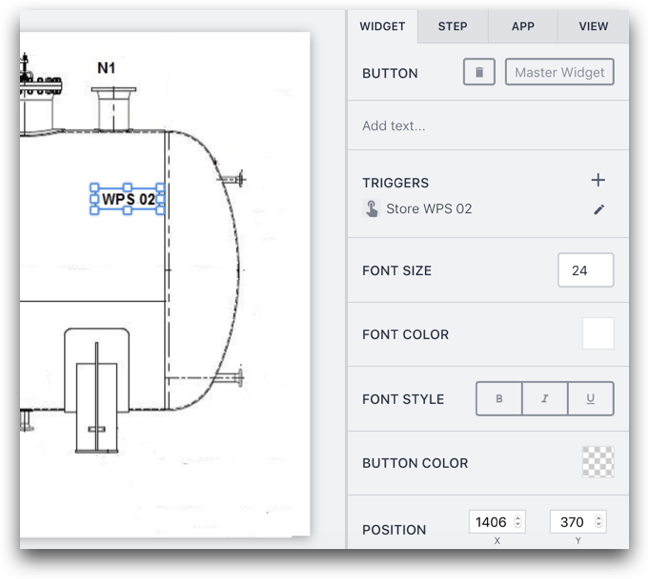
Click the “+” button next to “Triggers” to create a trigger and name it after the specific weld number.
In the Trigger, update the value of a variable named “weld_id” to the weld number (In this case, “WPS 02”) and then advance to the next step.
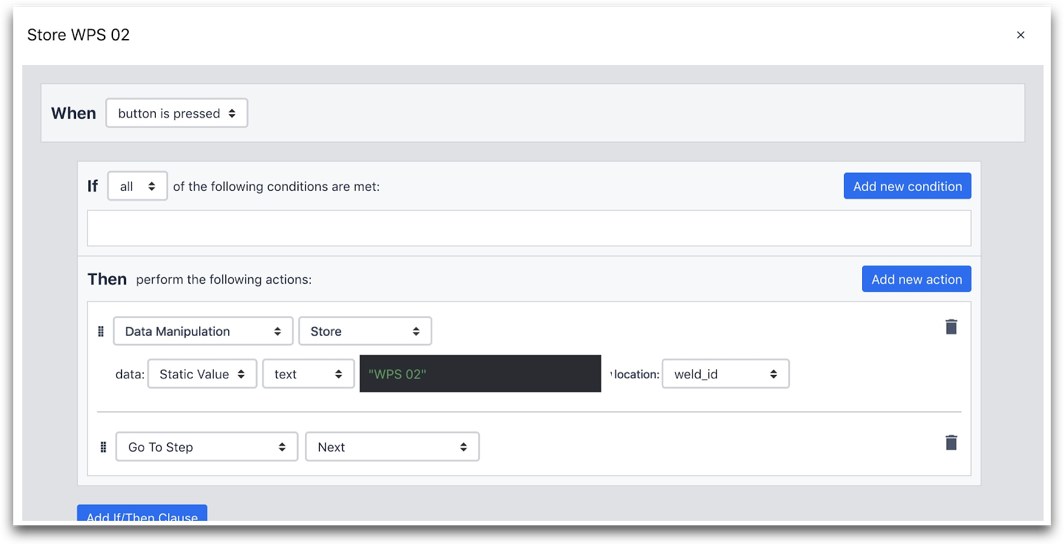
Here's the "Then" statement:

Here’s how to quickly replicate this across all 7 weld numbers. Click the button, then copy it using Ctrl + C and then paste using Ctrl + V. Then, drag it over the next weld number, like WPS 03.
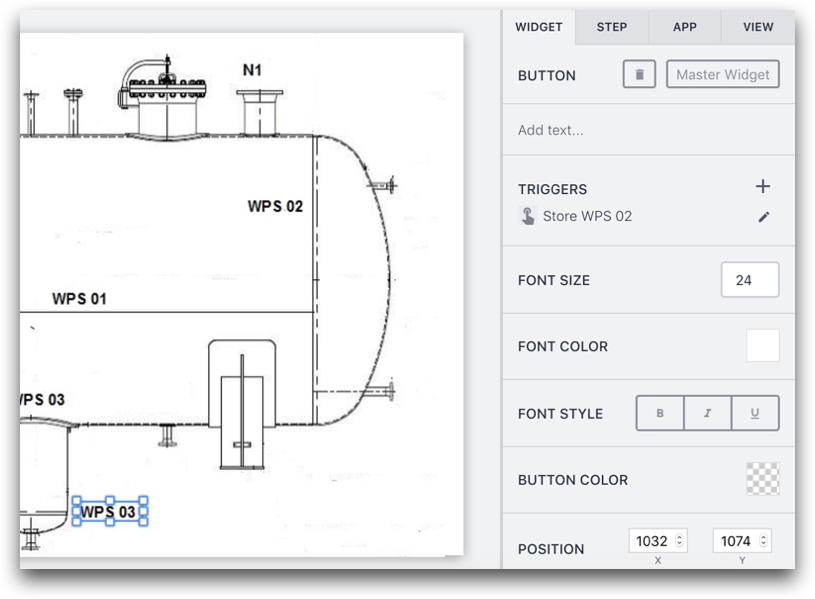
Click the “Edit” symbol next to the Trigger.
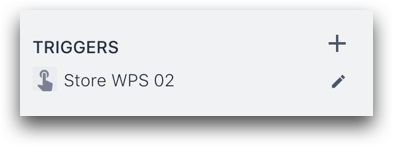
Then, in the editor, rename the Trigger to “Store WPS 03” and adjust the text in the Expression Editor to "WPS 03".
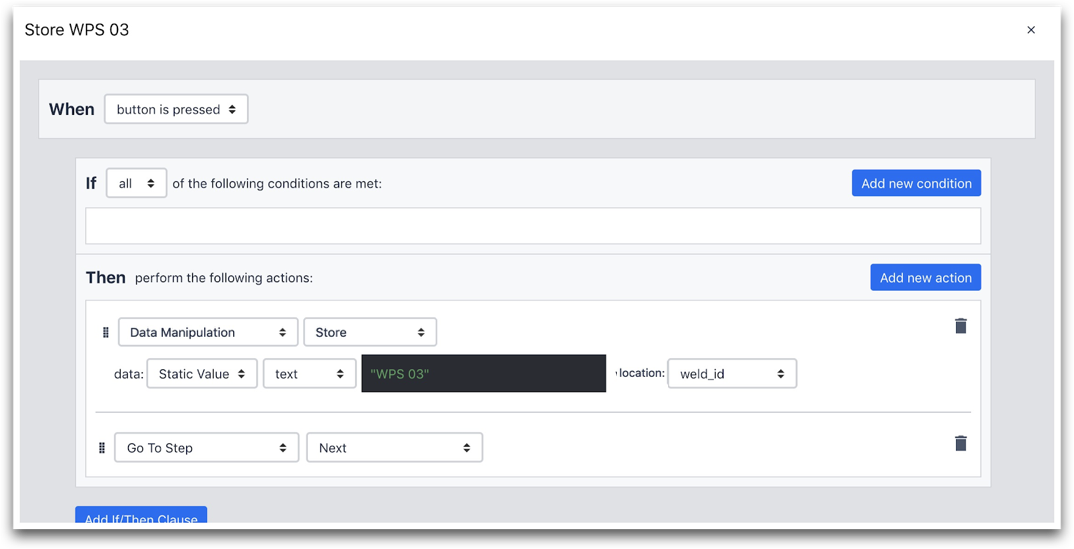
Then click “Save”. This will create an entirely new trigger associated with the WPS 03 button.
Combining This Step With Other Steps
In this app, there will be a Form Step for each of two welds. So, this app assumes that both welds will be the same number on separate parts.
Analytics Possibilities
After you start tracking “weld_id”, you will be able to calculate the average minutes per weld. Each app completion will show how long it took to complete two welds of the same type. You can track this data using the “One Operation” Analysis, and putting the “weld_id" variable on the X axis, and the time per app completion on the Y axis.
Further Reading
Step 3- Data For Each Weld
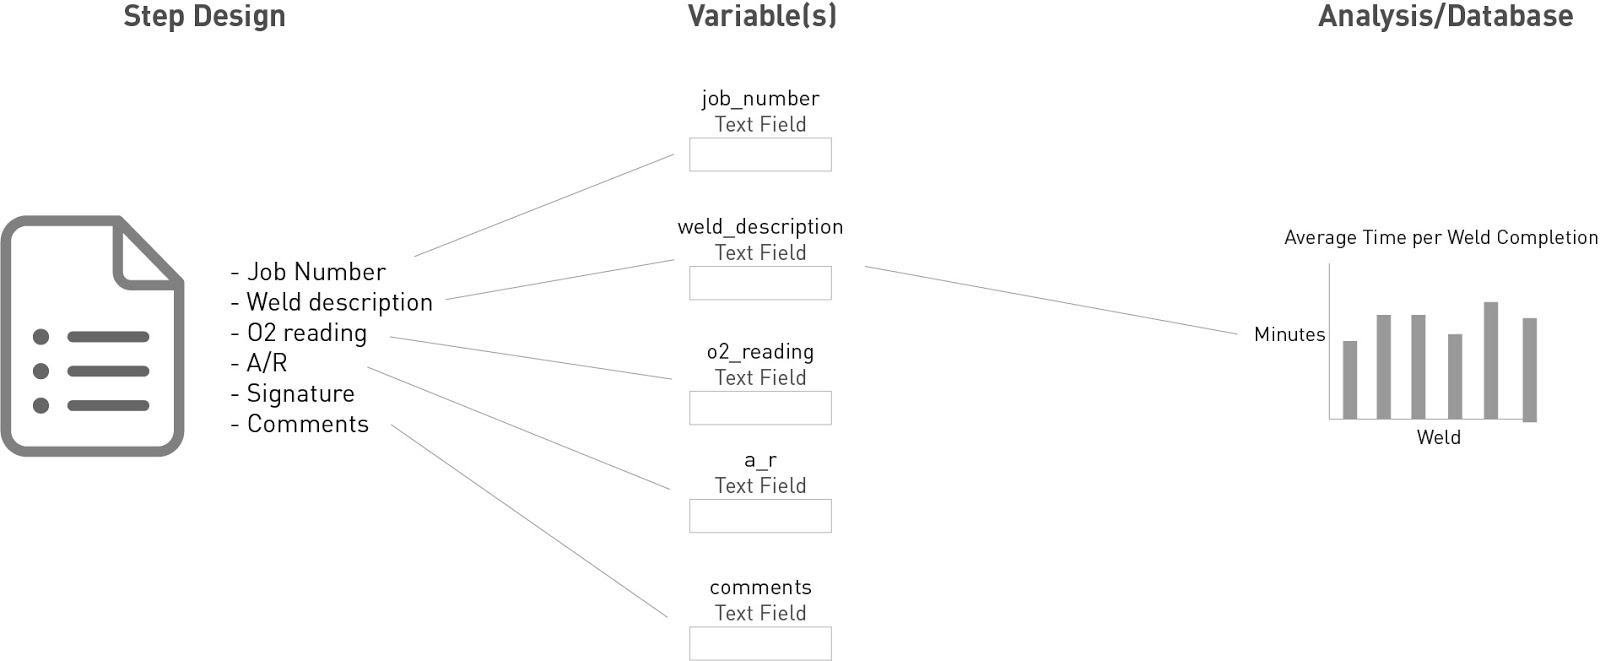
Here is the form that an operator needs to fill out for each weld:

- The job number
- The weld description
- The time
- The O2 reading
- A/R
- An inspector’s signature
- The date
- Comments
Since Tulip’s apps automatically track start and end time, the operator won’t need a “Time” or “Date” field.
This will require another Form Step. You will not need to use any persistent variables or default values, since all this data should be refreshed on each app completion.
Building It In Tulip
Here is the Form Step:
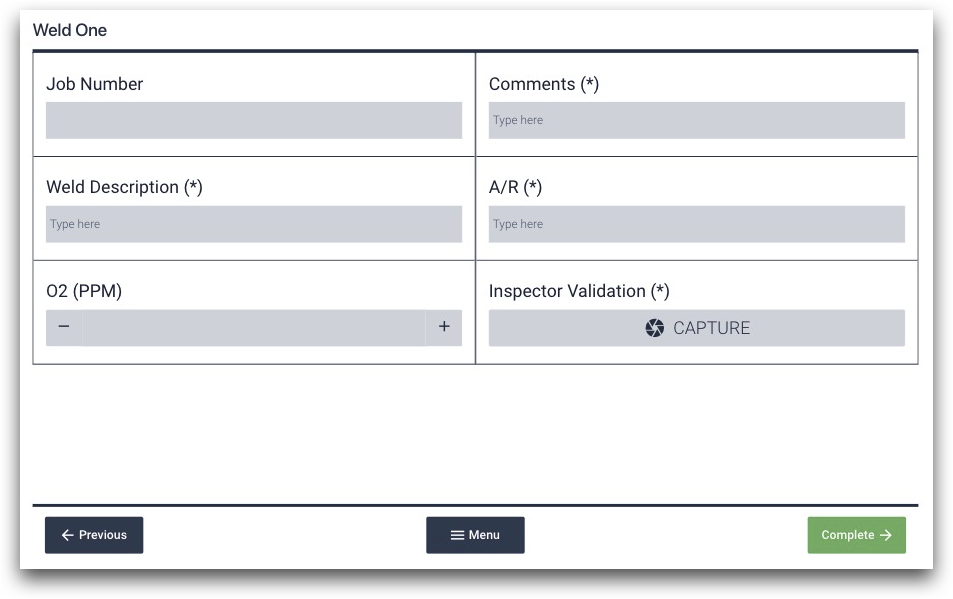
Just like the first Form Step, you need to create variables with relevant names to store the data from each field.
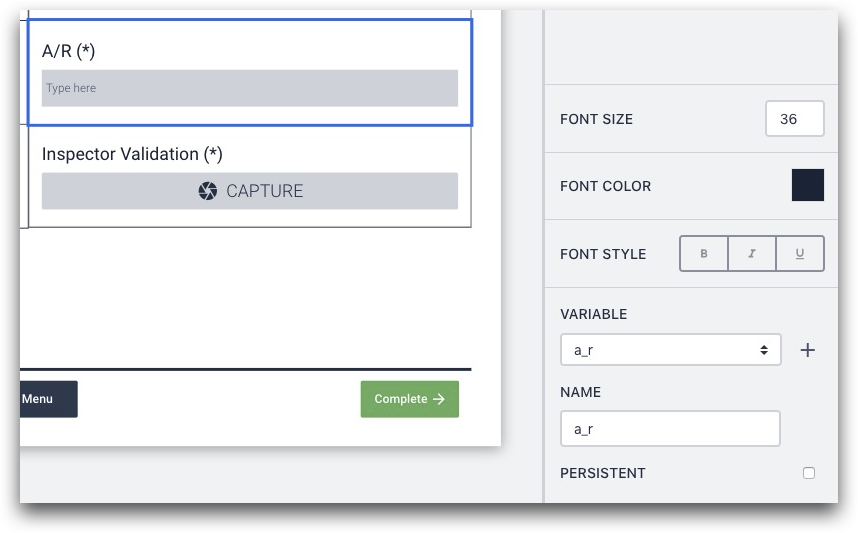
Tulip does not currently have a field for signatures. So, you can use the computer’s webcam to capture a picture of the inspector to validate that they reviewed the work.
This step should create a total of 6 new variables within the app.
Then, repeat this step a second time by "duplicating a step" in order to give the operator a chance to add details about the second weld on the same part.
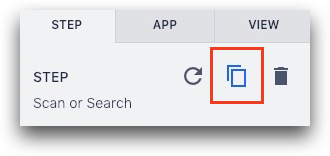
Click the "Duplicate Step" button at the top of the Step tab in the Context Pane.
Then, in the new step, change the names of the variables so that they store data separately from the responses in the first Form Step.
For example, if the varaible in the first step was named "a_r", you can name the variable in the second step "a_r_2" to show that it is related to the second weld step within that app completion.
Analytics Possibilities
The most exciting analytics might come from combining the time to complete the app (or the time it took to complete two welds) with the job number. You can create a stacked bar chart using the “Compare Variables” analysis to stack all the welds for a given job number on top of each other, and compare all the jobs in a week or month.
Overall Notes
The entire app should have 4 steps.
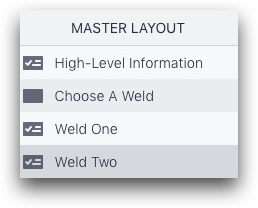
There are no dynamic paths through the app. Instead, each step stores valuable information in variables that can be analyzed as soon as the app is completed.
Did you find what you were looking for?
You can also head to community.tulip.co to post your question or see if others have faced a similar question!
