To download the app, visit: Library
Purpose
The Overall Equipment Effectiveness (OEE) Calculator application is intended to be an easy, simplistic way to calculate, log, and track OEE metrics across a variety of manually tracked processes. This application does not require any connection to machines, although can be enhanced with Tulip’s machine monitoring package.
There are several definitions or variations of how to calculate OEE. This calculator operates on the following definitions. Later in this document, it will be described how to easily change these calculations to suit your operation.
- Availability - A measurement of the time a process spent running when compared to the total time.
1 (Run Time / (Run Time + Down Time + Setup Time Actual)) * 100
- Performance - A measurement of how many parts were made in comparison to the target part count.
1 (((Good Parts + Scrap Parts)*(Standard Run Time per Part)) / (Shift Length - Breaks)) * 100
- Quality - A measurement of how many good parts were made in comparison to total parts made.
1 (Good Parts / (Good Parts + Scrap Parts)) * 100
- OEE - A representation of the previous three metrics.
1 (Availability * Performance * Quality) / 10000
Application Walkthrough
There are four key steps to using this application, which attempts to follow a left to right, up to down flow within the distinct sections of the application.
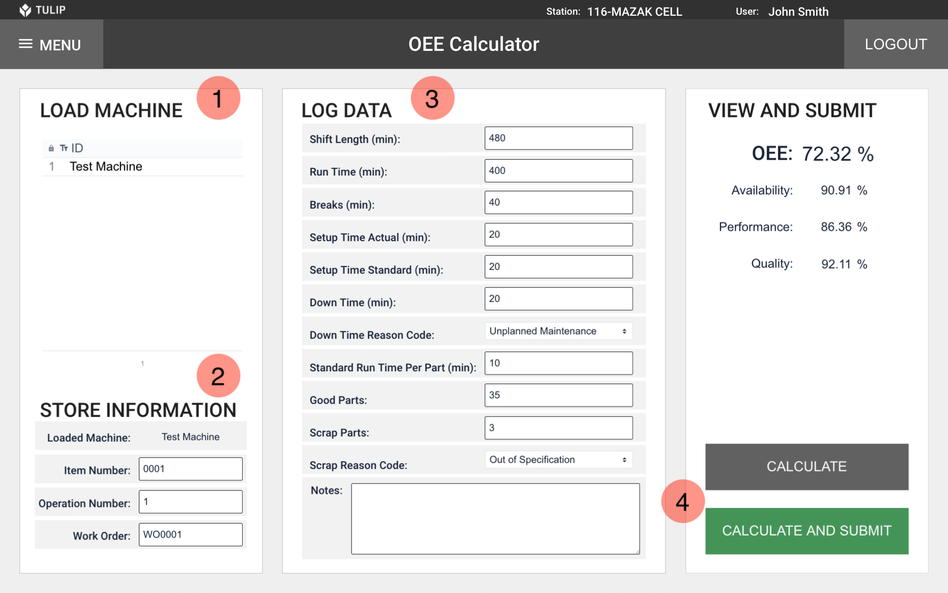
- Loading Machine (or process) - This app is intended to provide general use across a range of processes. To manage these processes, an embedded table is used to provide a view of available processes that can be reported against. Select the machine or process that you are submitting data for. See Section 3.1 for a description of the Machine List table.
- Store Run Information - This can be used to provide tracking against specific items, operations, and/or work orders. These fields by default are required, but do not factor into the equations being used.
- Log Data - The production details should get added to the middle section of the page.
- Calculate and Submit - The Calculate button can be used to display the calculations based on the information input by the user. The Calculate and Submit button should be used once the data has been verified and is ready for entry within the application’s completion data.
Data entries can be daily, per shift, or even more frequently. The analytics will be set to aggregate across multiple entries a day.
Setup
This section will review how to use the OEE Calculator once it has been installed on a Tulip instance. The application requires minimal setup before ready to deploy to the shop floor.
Machine (or Process) Table
To start to use the OEE Calculator application, we must first setup the list of machines or processes that are to be measured. These can be setup at any time, but to run the app, you will need at least one available process. This is the ONLY required step for running the application.
In addition to the application, a Tulip Table should have also been imported to the instance called [OEE Calculator] Machine List. This is a table schema that can be used to provide a standard list of machines or other processes that this calculator can be used to track while providing other useful metadata that can be used when discussing analytics.

In this table, we see the following columns:
- ID (Primary Key - Text) - The unique identifier for the machine, line, cell, or other process that is being tracked.
- Department (Text) - The department the machine, line, cell, or other process exists within. This can be used to find the overall OEE of a group of processes.
- Machine Type (Text) - The type of machine can be used to find overall OEE by machine type.
- Machine Model (Text) - The model of machine can be used to find overall OEE by machine model.
- Facility (Text) - The facility the process exists within to find overall OEE by facility.
Of these columns, only the ID is required, where the others can be used to providing helpful labels when aggregating data.
Reason Code Configuration
By default, we provide a limited list of reason codes available for selection. This can be easily modifiable within the application. The list of included reason codes are:
- Planned Maintenance
- Unplanned Maintenance
- Broken Tool
- Dull Tool
- Meetings
- Other
To add codes or modify this list, open the app in the Tulip App Editor, select the drop down widgets, and make the intended modifications using the new option, modifiable text fields, and delete button (trash can) on the right side of the screen.

OEE Metric Calculation
In Section 1, the default configurations of the OEE calculations were described. With the Tulip Platform, these calculations can be easily managed and converted. From the Tulip App Editor, select the Calculate and/or Calculate and Submit button. On the right side of the screen, a trigger matching the button text should be present. To modify the calculation, open the trigger using the pencil icon.
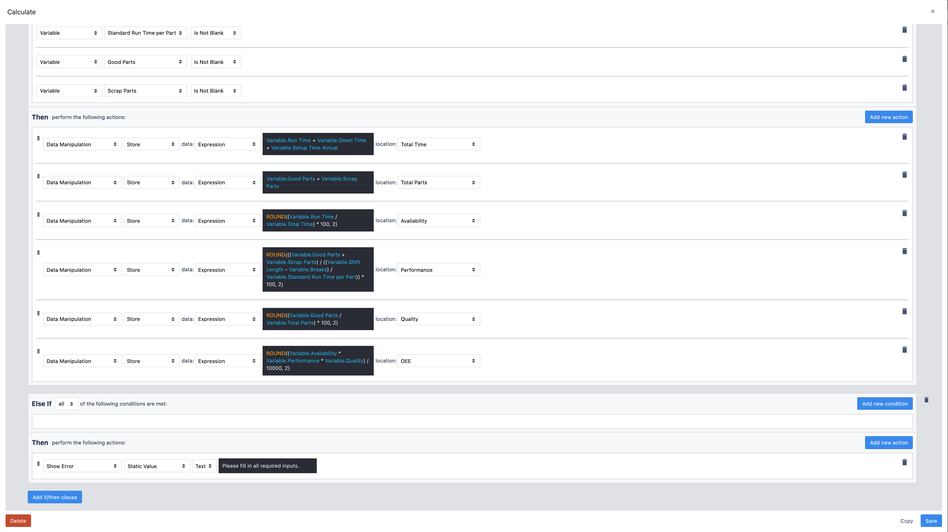
The trigger structure can be distilled down to basically:
1 2 3 4 5 When button is pressed: If ALL variables on the screen are filled in: Perform calculations and store into variables Else: Show error to fill in all required fields.
To change the calculations, the expression editor present in each action statement can be used to modify the variables and arithmetic operators present. For more information on how to use the expression editor, please refer to this guide on How to Use the Expression Editor
Any changes to the trigger on one button will need to be manually carried over to the second button (otherwise, values generated from the Calculate button may not match the data submitted to completion records).
Data and Analytics
The key value of this application is that it can historize each completion and provide ease-to-use data analytic functionalities. Raw completion data can be found under the Completions tab of the application page:

As previously mentioned, the OEE Calculator application can be completed at any rate of frequency and can be used many times for many different processes.
Completion data will get tracked against the date of completion, so at a minimum the app should be run daily.
In this section, I’ll provide three examples of how to build commonly used analytics. It’s worth mentioning that these analytics are effectively views into the completion data, so these can be built at any point and will show any data collected.
Daily Availability for a Single Machine
In this example, we’ll look at how to build an analytic for a single machine using this application. For simplicity, we’ll use a Single Number analytic, to just give us a real-time value of our process Availability over the course of a day.
Now, if our standard process was to complete this application once a day for a particular machine (or complete with a constant shift time), all we’d need to do is show the app variable Availability for the date range of Today, and add a filter for Current Machine ID equals the target ID of your choice. However, this approach lacks flexibility because if we have two submissions for a day (let’s say one is for 480 minutes and one is for 120 minutes), this will inherently average the values rather than weighting more heavily towards the longer shift.
Instead, we’ll effectively perform the calculation in the analytics, to aggregate the raw values and create an accurate, weighted calculation. To do this, under Number, change the value to be an Expression.
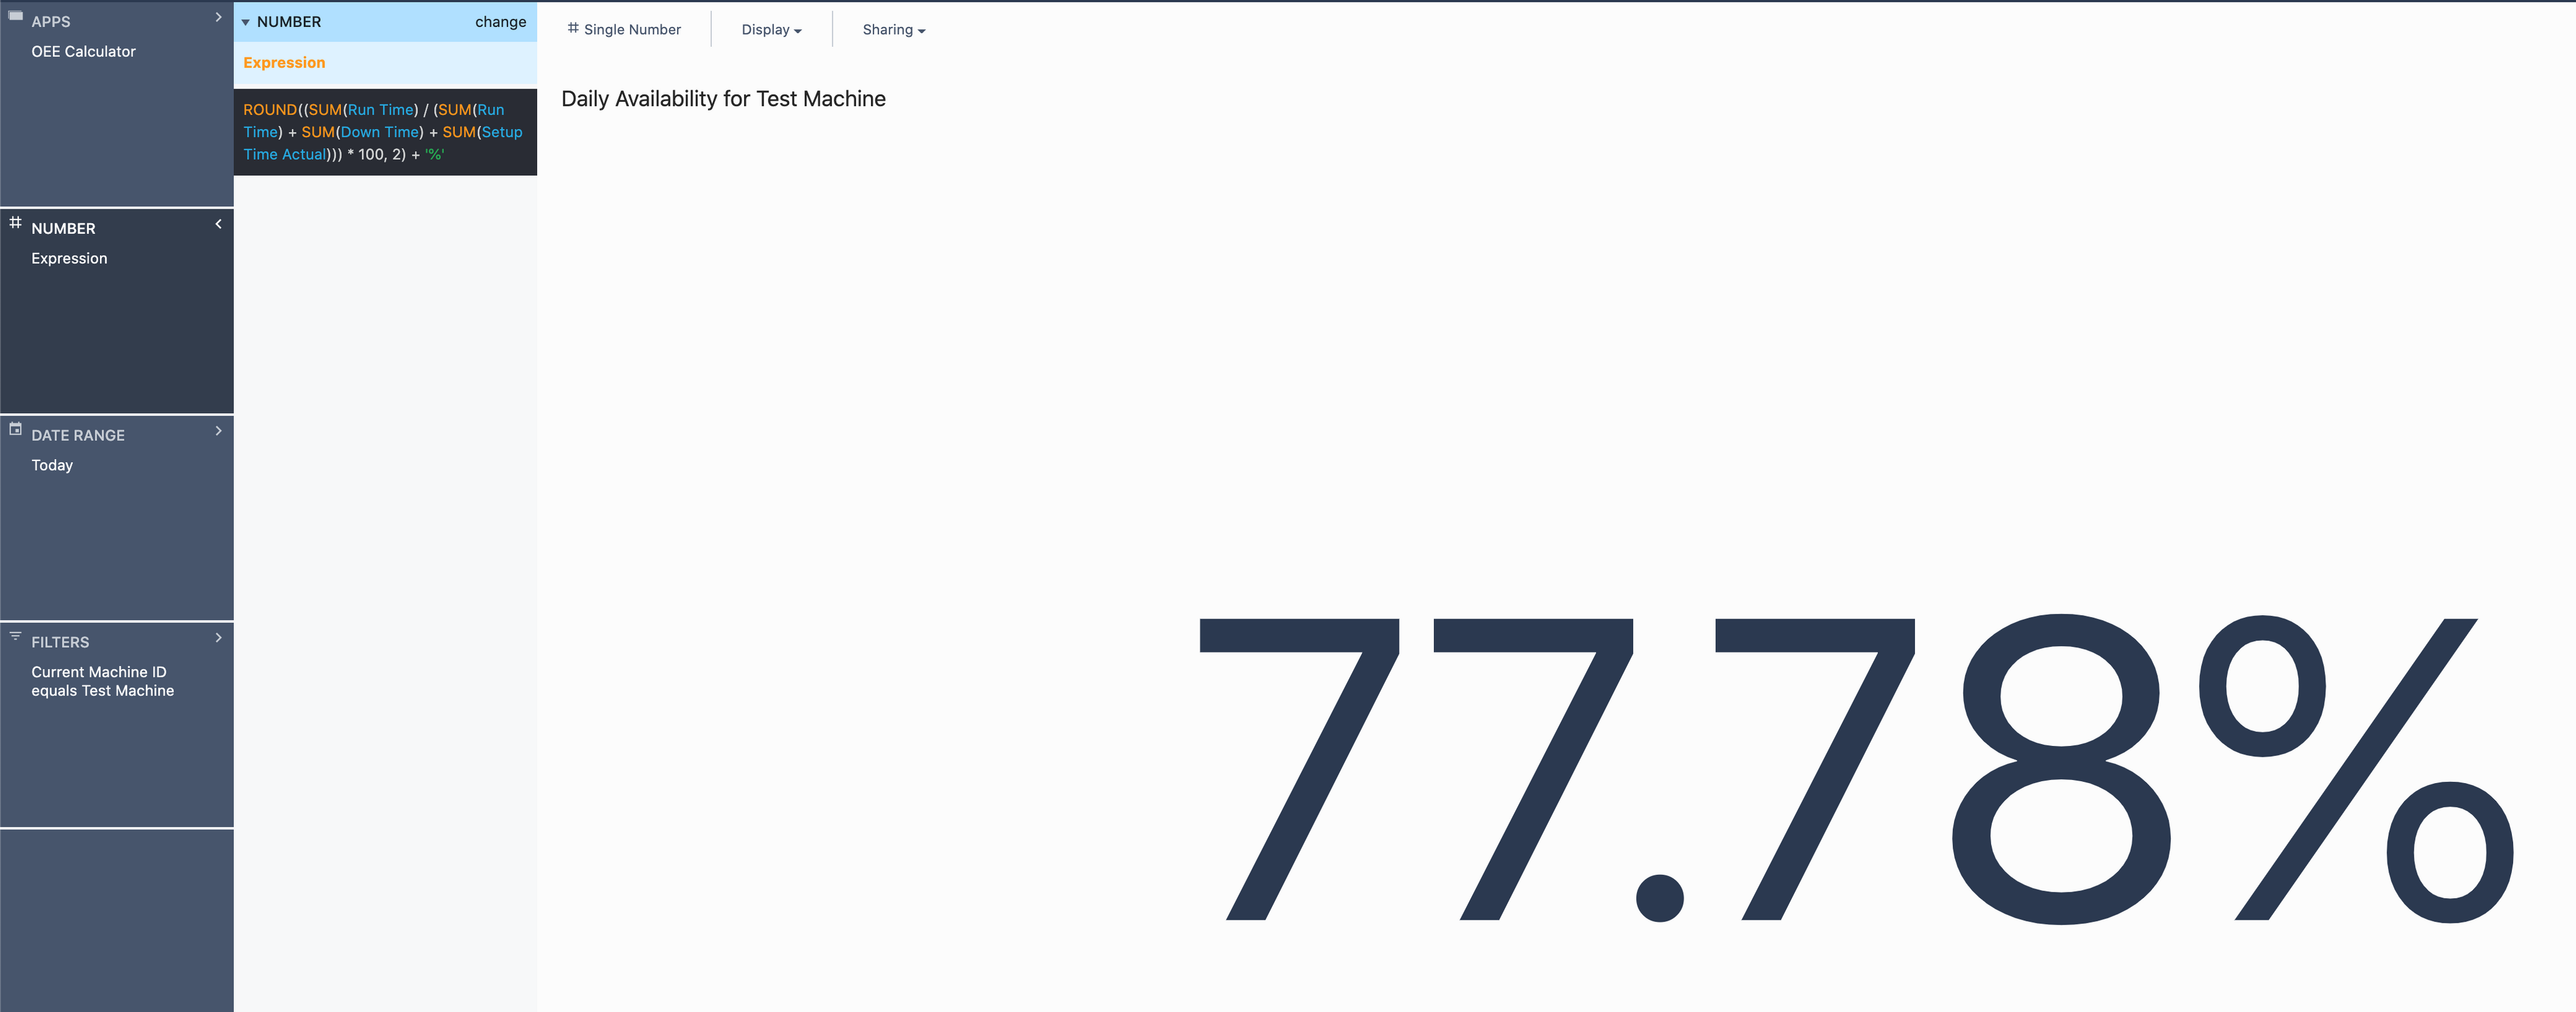
We effectively take the same calculation used in the application, but put summation terms around each variable, so the application will aggregate all completion data within the selected time range. We then multiple the result by 100 to convert to a percent, round to two decimal places, and concatenate a ‘%' symbol to convert from a number to a string with a percent symbol. For this example, the screenshot above demonstrates the filter that we use to limit this analytic to completions strictly for Test Machine.
This analytic now becomes extremely flexible. If you wanted to see the Availability for any time period now, all that would need to change is the Date Range field.
Weekly Performance for a Department
This analytic is going to be extremely similar to the one above, we’ll just measure a separate metric and show how you can use the metadata setup in the Machine List table to provide grouping. Similarly to the first example, we’re going to re-use the formula provided in the application with minor changes to robustly build this out for aggregations.
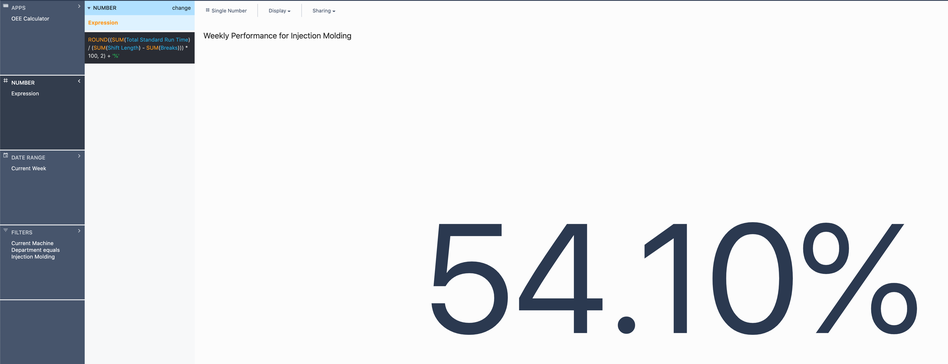
One major note for this analytic, we should use the Total Standard Run Time variable, which is an intermediary calculation performed within the app that effectively represents this part of the performance equation (Good Parts + Scrap Parts) * Standard Run Time per Part). The reason we do this is that we’d run into similar weighting issues with the Standard Run Time per Part variable where it’s not something that should be summed or averaged across multiple completions.
We can then select Current Week (which will reset each Monday at 12 AM) or Last 7 Days for a rolling week. Lastly, rather than filtering based on Machine ID, we can filter on Machine Department (or any other metadata) to group analytics and get a better sense of overall productivity.
Downtime Reason Code Pareto Chart
One final example of an analytic is to provide a pareto chart of reason codes so we can understand and improve upon the most common reasons for downtime or defects. We’ll look at downtime in this example, but can very easily be swapped out with defects.
First, we’ll select the One Operation analytic type. For this example, our X-axis will be our reason code and our Y-axis will be the SUM of our downtime. We can then modify the chart to a pareto under the Display drop down above the analytic title. Once again, we can change the date range and add whichever filters we care to. Below is an example for a current month view of all machines.
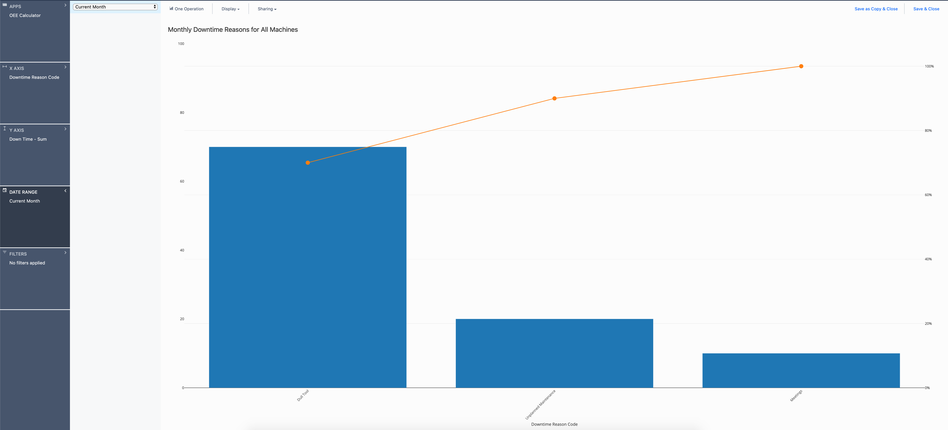
These types of data analyses can be extremely effective in helping guide continuous improvement efforts and monitoring the impact real-time.
Deployment Strategy
The OEE Calculator application is extremely flexible with how it can be rolled out to the shop floor. As this app requires relatively minimal interaction (a few form entries a day), the size of the facility will most likely drive the number of stations this should be deployed upon based on physical proximity to operators or line supervisors. It is entirely feasible that one tablet could support an entire production area. Operators/associates would be expected to walk over to the nearest terminal at the end of every job or shift and transfer information into the application.
However, this application WILL work simultaneously on multiple devices and could even have an additional layer of complexity where the list of available machines is filtered by the device/Tulip station the app is being run from. All of the data will still aggregate in the same area and can be filtered upon in the same way, making this extremely easy to scale and improve upon.
