
To download the app, visit: Library
The Quality Management Dashboard is a part of Tulip’s composable MES Quality Management app suite. You can use it individually or in combination with other applications.
The primary roles of the application include providing straightforward analytics for users and enabling them to examine specifics related to products, batches, or defects. This simplifies the process of quality analysis.
Usage and Value Creation
- Visibility: A quality dashboard provides a centralized and visual representation of key quality metrics and performance indicators. It offers stakeholders, including management and frontline workers, a clear and immediate view of the organization's quality status, trends, and areas that need attention.
- Continuous Improvement: Quality dashboards facilitate continuous improvement efforts by providing insights into quality performance over time. By tracking trends and comparing historical data, organizations can identify areas for improvement, set targets, and measure progress towards quality goals.
- Resource Optimization: By identifying root causes of quality issues and inefficiencies, quality dashboards help organizations optimize resources, including manpower, materials, and equipment. By addressing underlying issues, organizations can reduce waste, improve productivity, and lower costs.
Tulip Tables Used in the app
All the applications in the Composable MES app suite use common tables.
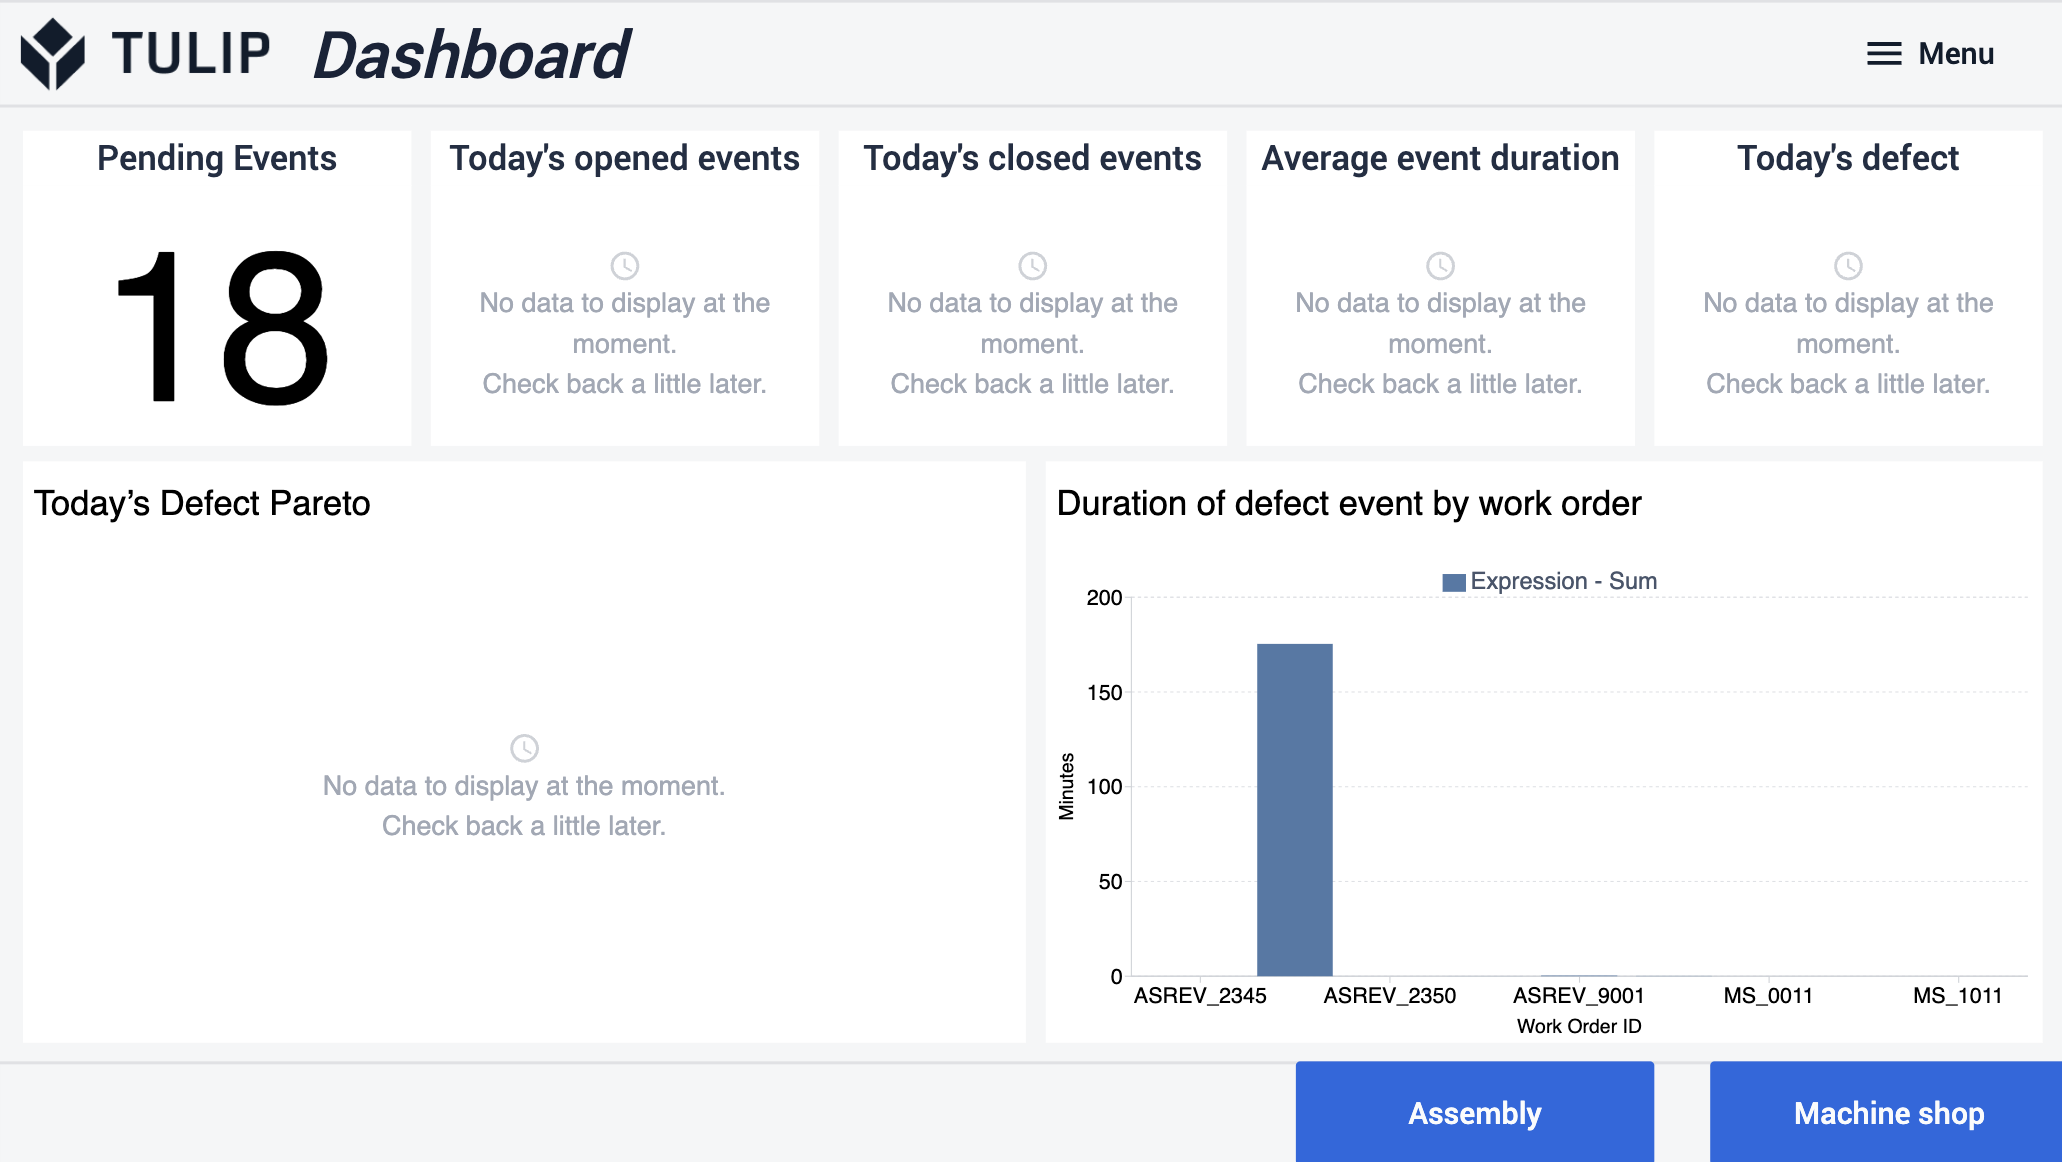
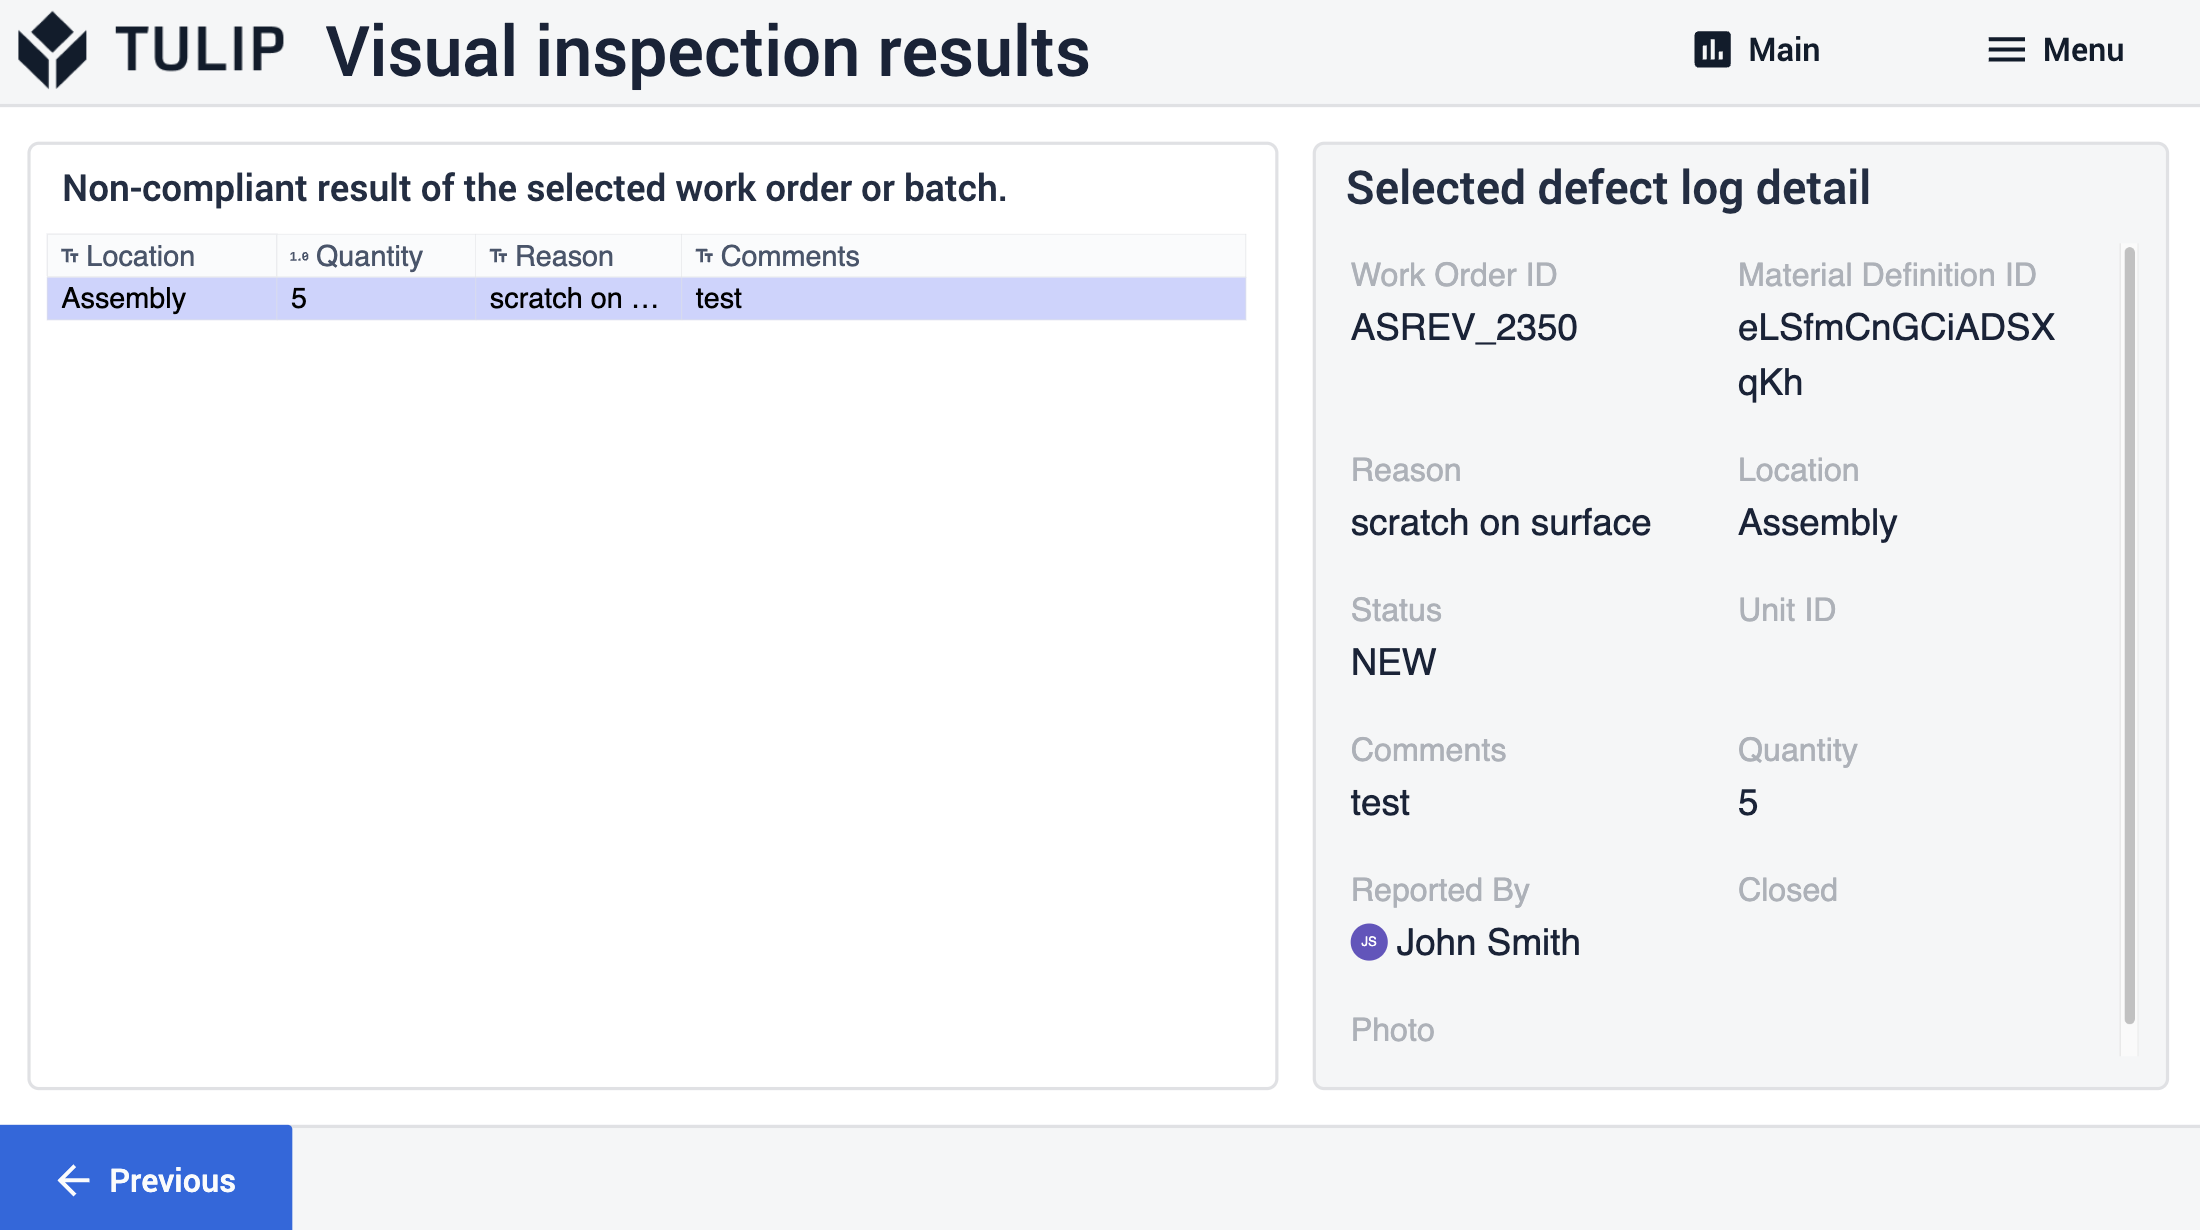
This application utilizes four tables for data analysis. Basic analytics are based on the 'defects' table, enabling users to observe the duration of defects, reasons for defects arranged in a pareto chart, and the number of events opened and closed in a specific time range. Users can also access the average length of an event and the count of defects occurring within a predefined time range.
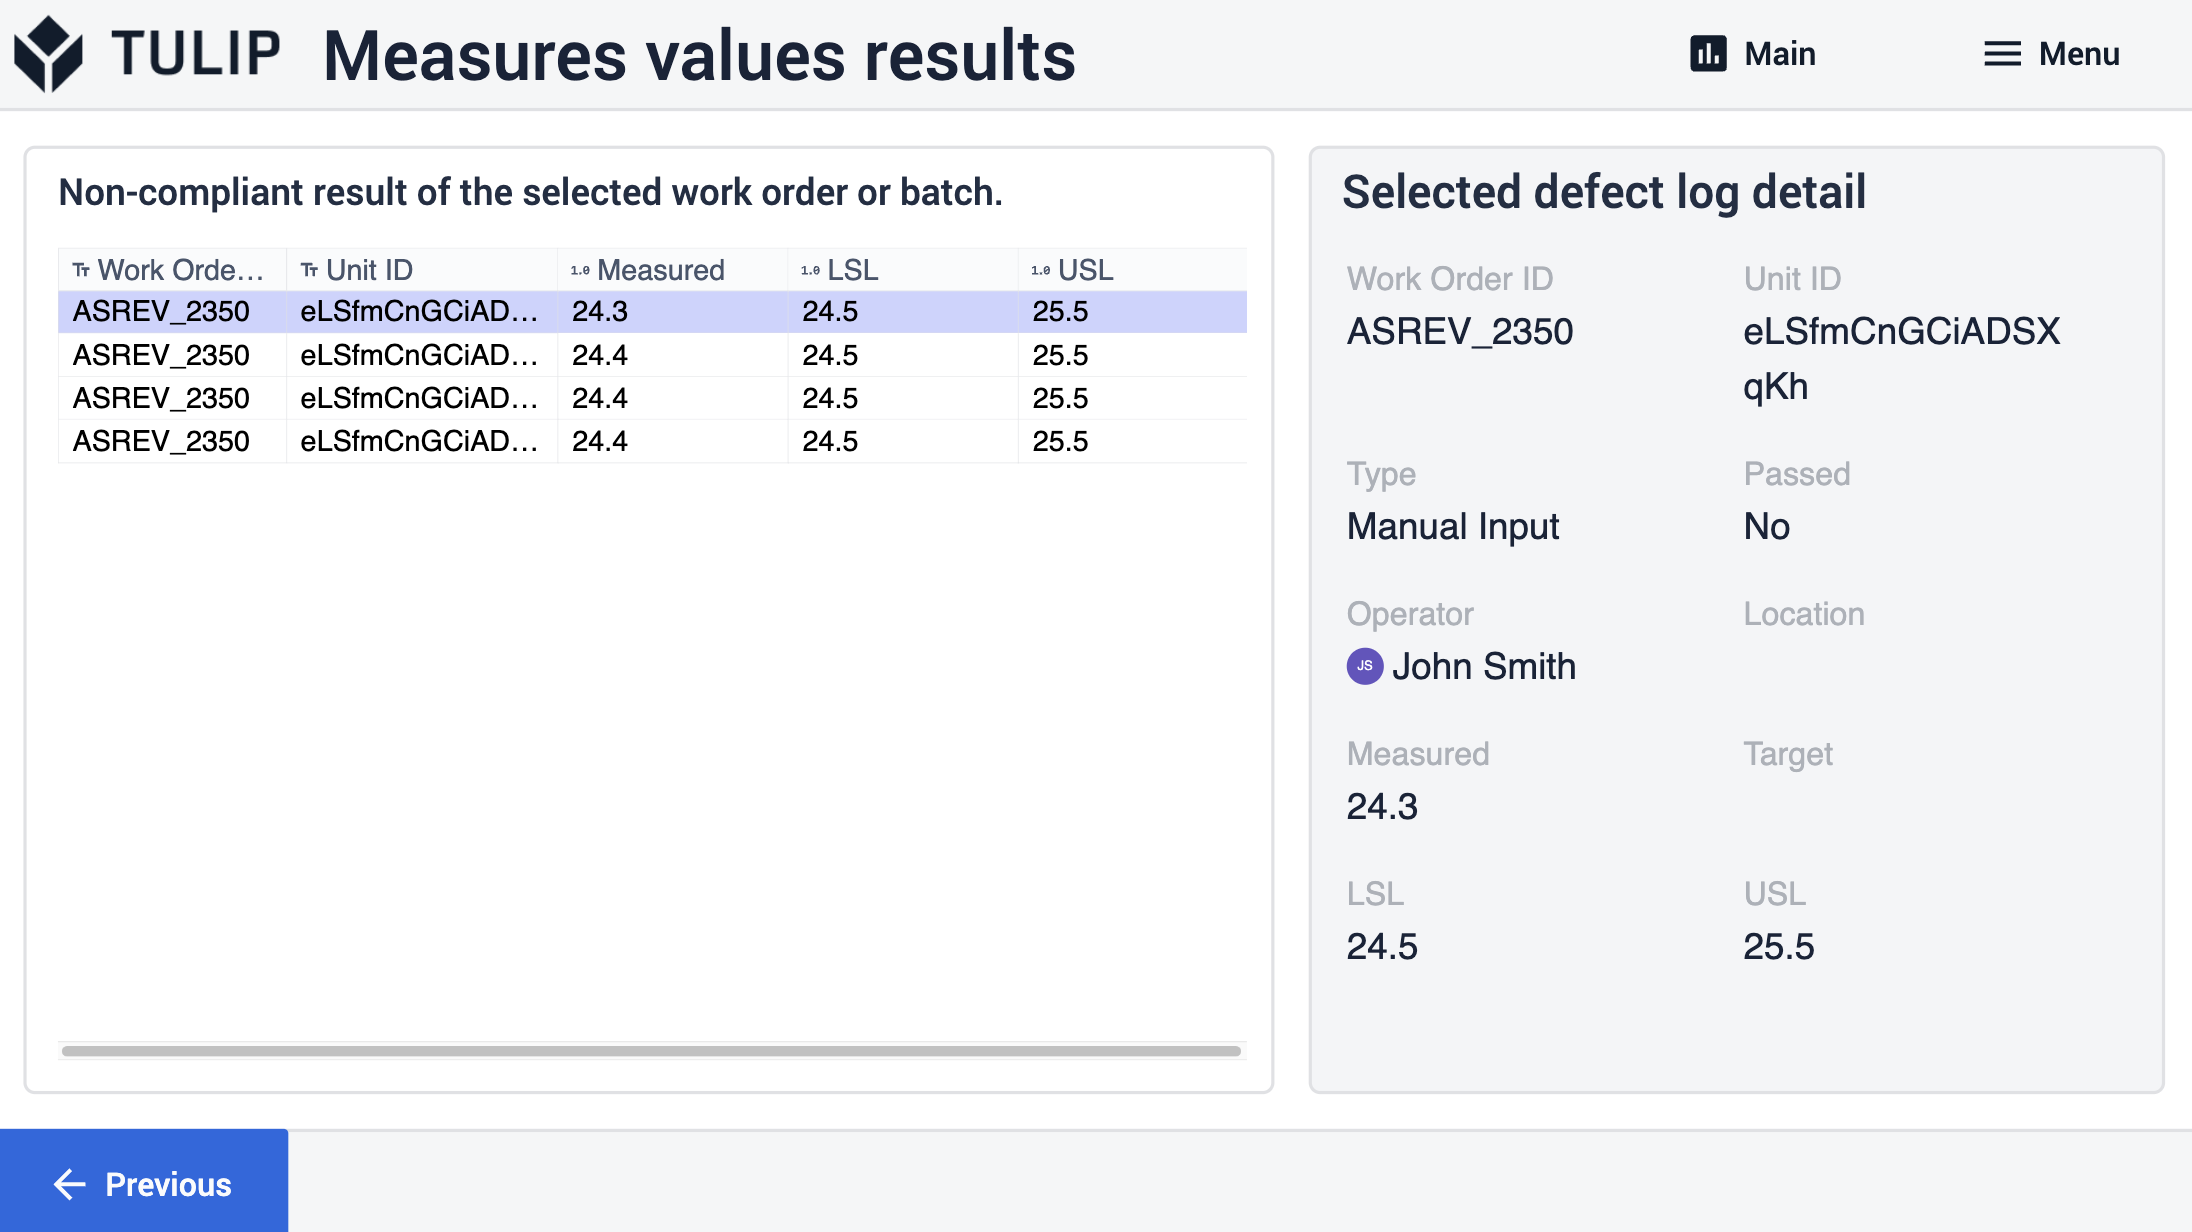
For a more detailed analysis, the app uses the Work Orders and Batches tables. Users can choose a specific work order or batch to see all associated defects, categorized by type. Additionally, they can view all related measurements recorded in the Inspection Results table.
(Operational Artifact) Work Orders
- ID: Work Order unique identifier
- Operator: Operator who completed the work order
- Parent Order ID: Reference to a parent work order (for example, if a work order needs to be split into more work orders)
- Material Definition ID: The part number of the work order
- Status: CREATED, RELEASED, KITTED, IN PROGRESS, COMPLETED, CONSUMED, DELIVERED
- Location: This is the physical place where the Work Order exists. It could be a station ID, a location ID, or any arbitrary indication of a location
- QTY Required: Quantity of parts that need to be produced
- QTY Complete: Actual quantity produced
- QTY Scrap: The number of units that were scrapped associated with this work order
- Due Date: The date when the WO is due
- Start Date: Actual start date timestamp for the WO
- Complete Date: The actual complete date/time of the Work Order
- Customer ID: The identity of the company or entity the current production demand is being fulfilled for
(Physical Artifact) Units
- ID: Unique identifier of the unit record, e.g. Serial Number or Batch Number
- Material Definition ID: The part of the unit
- Material Definition Type: The type of part
- Status: e.g. IN PROGRESS or AVAILABLE or UNAVAILABLE
- Location: The physical location on the shopfloor or in Inventory. It could be a station ID, a location ID, or any arbitrary indication of a location (area, cell, unit, etc)
- QTY: Quantity of the Unit
- Unit of Measure: Unit of Measure
- Work Order ID: The related work order
- Completed Date: The time the unit was completed
- Produced By: The operator the unit was completed by
- Parent Unit ID
(Operational Artifact) Defects
- ID: Unique identifier of the defect record
- Material Definition ID: The Part Number or Material Definition ID of the defective part
- Material ID: Defected material ID
- Reason: Support routing to correct owner and swift resolution. In addition supports root cause analysis
- Location: This is the physical place where the defect was detected. It could be a station ID, a location ID, or any arbitrary indication of a location (area, cell, unit, etc)
- Severity: Impact of the defect on our process (Critical, High Medium, Low)
- Status: Current status of the defect. "New", "In Review" and "Closed"
- Work Order ID: If applicable, the Work Order ID the defect is related to
- Unit ID: If application, the ID of the related Material Unit
- Comments: Free text to capture comments on the defect. Can be used to support historic and root cause analysis
- Photo: Relevant photo can be captured for the record both for aiding initial resolution and later analysis
- Quantity: The quantity of the parts / material that is defective
- Reported By: User logging the event, typically captured using the logged in app user
- Disposition: Action taken to resolve the defect
- Disposition Assignee: User who has been assigned the task / in the lead to take the next step with the defect investigation. Typically defaults to area quality responsible or supervisor, but should be defined by the app builder
- ispositioned Date
- Closed
Inspection Results
- ID: Unique identifier of the inspection result record
- Work Order ID: The related Work Order if applicable
- Unit ID: The related physical material
- Material Definition ID: The related Part Number
- Type: Further categorization or classification of the grouping or type of the result
- Status: Track the status of this inspection demand
- Procedure: Procedure ID for inspection
- Location: Location where the inspection was executed
- Photo: if the result includes an image
- Passed: Indication of the Inspection Result: Passed/Failed
- Operator: Operator who executed the inspection
- Text Value: Text Value Captured
- Measured: Measured Actual Value
- Target: Desired Target Value
- LSL: Lower Limit
- USL: Upper Limit
Configuration and customization
In-app help
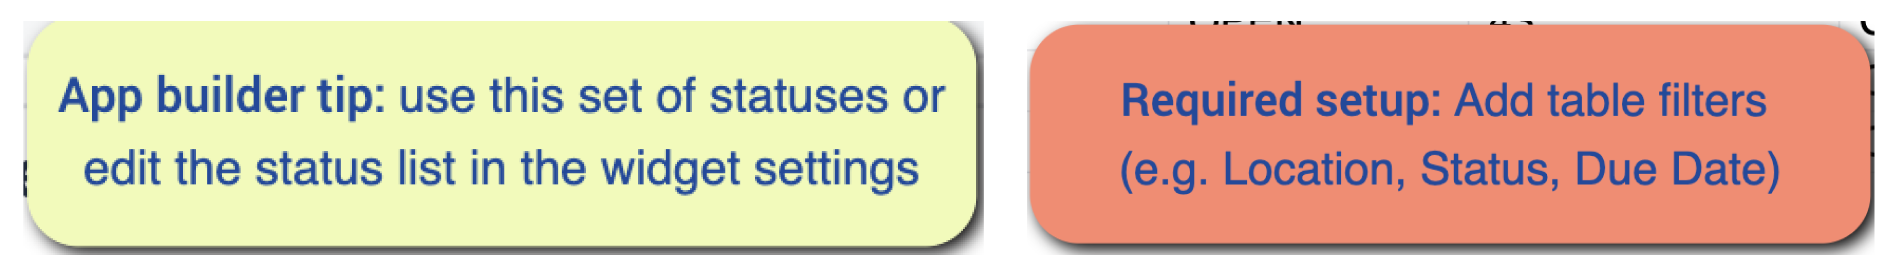
As with all applications in the Composable MES app suite, the Quality Managment Dashboard app includes in-app help as well. These are short descriptions of the Required setup steps and App builder tips to support further customization. After downloading the app make sure to read these instructions and then delete them before running the application.
Tables that provide data input
This application needs information from these tables to work properly. To use the app, you have to fill these tables with data. You can do this by using other apps in the Composable MES app suite, inputting the data manually, utilizing automations, or importing data from CSV files.
Required setups
- In the 'Dashboard' step, look for a trigger called 'Store Today's Variable'. Make sure the time zone there matches your own.
- In the 'View Inspection Results' steps, you must adjust the filters in the analytics. This determines what appears in the analysis widget. For example, you can set the 'type' filter to 'manual input' or to any option you've configured in the other apps you're using to populate the tables.
App Structure
In the dashboard step, users can view basic analytics such as pending events, the number of today's opened and closed events, and the defect pareto chart.
Users have the option to navigate to the next steps where they can view specific analytics by selecting a work order or batch. On these steps, users can also see the quantity of defects for the selected item.
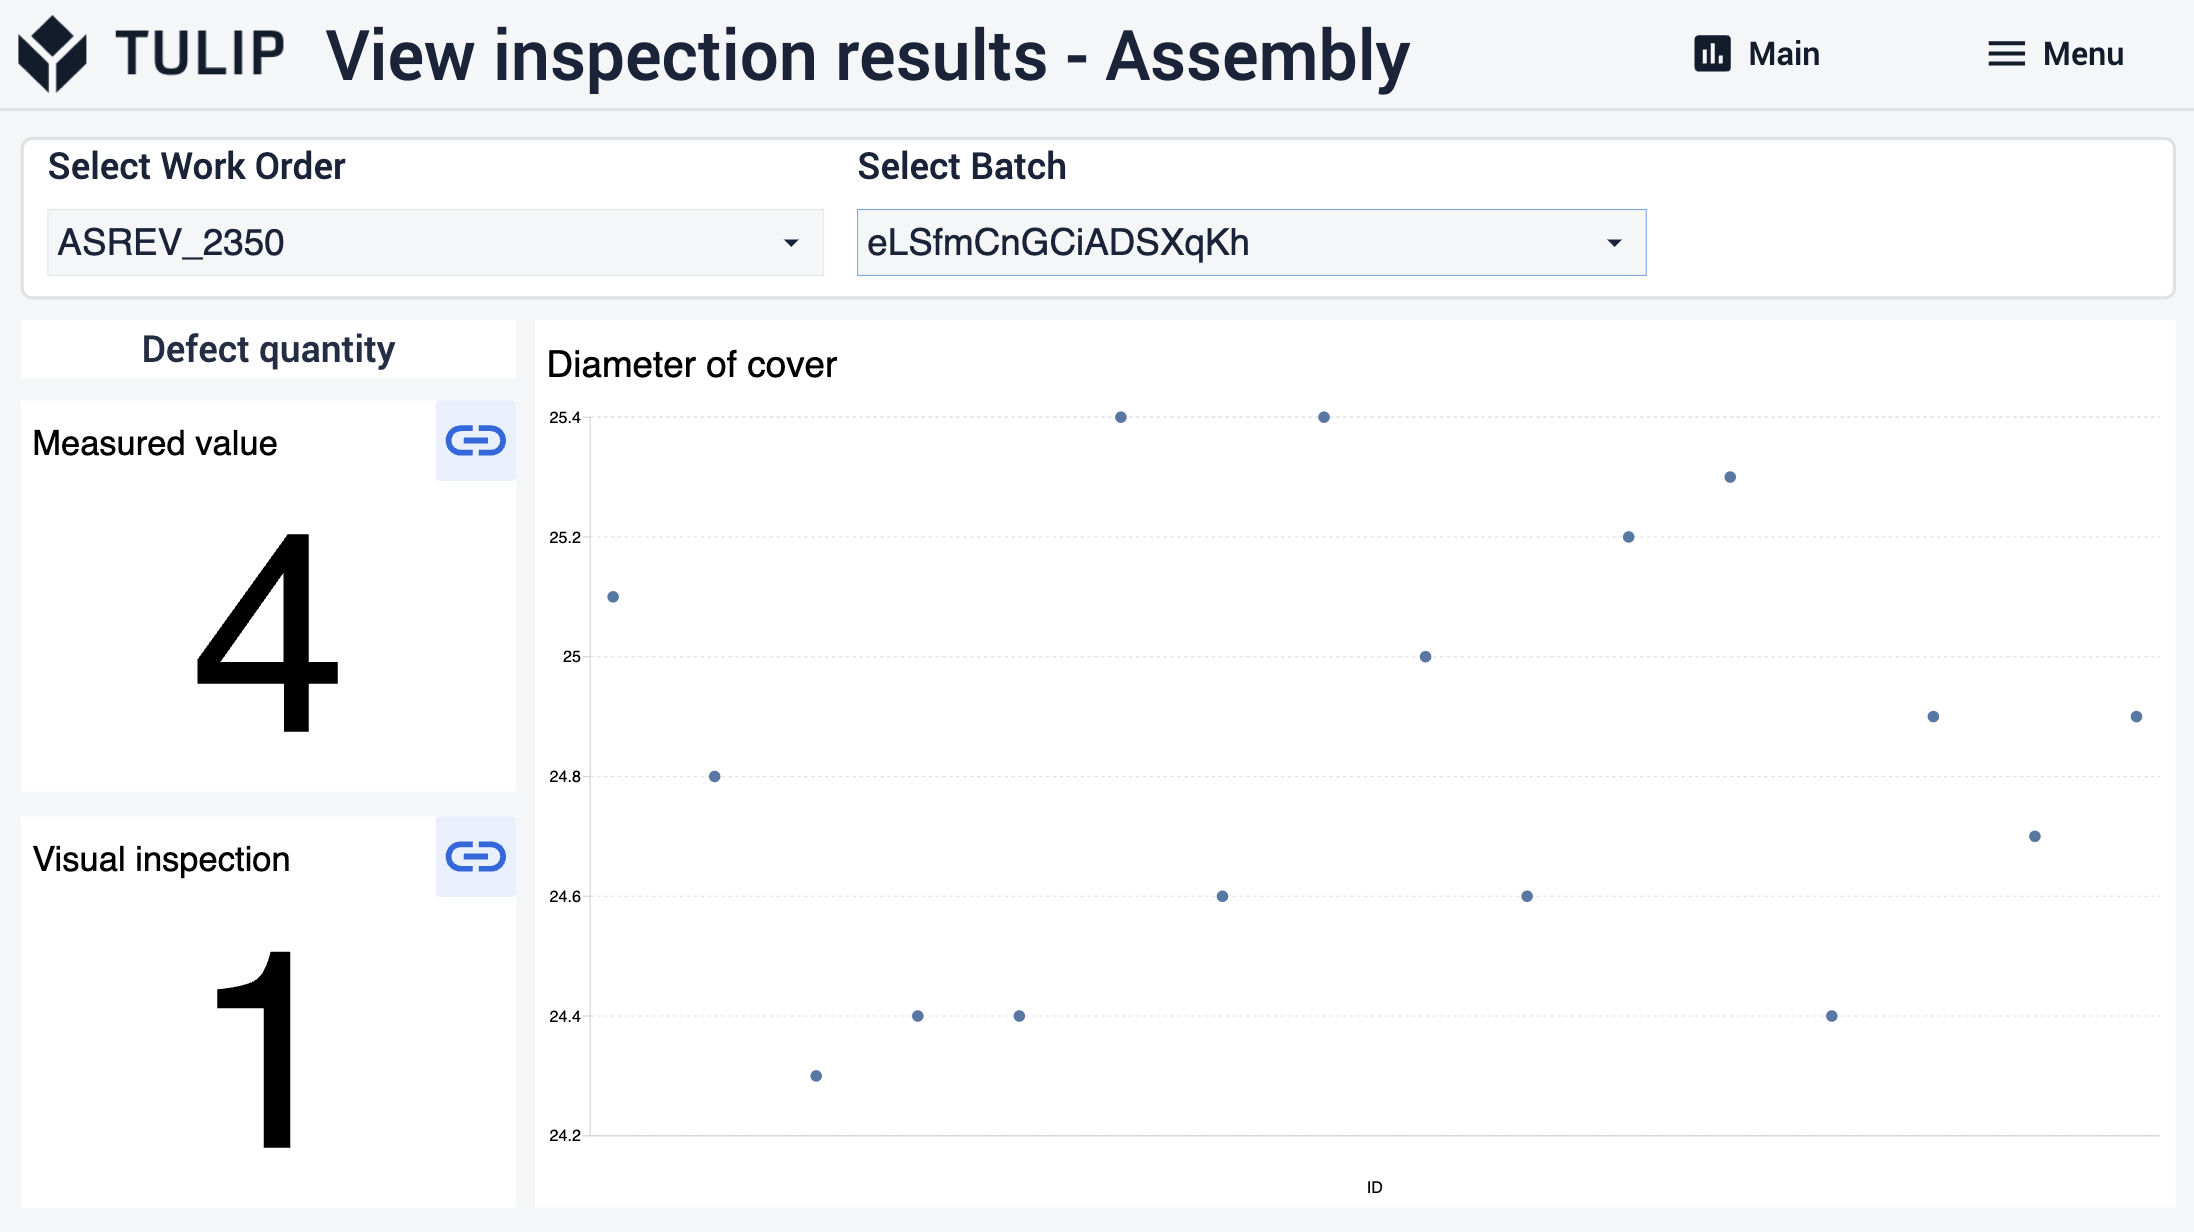
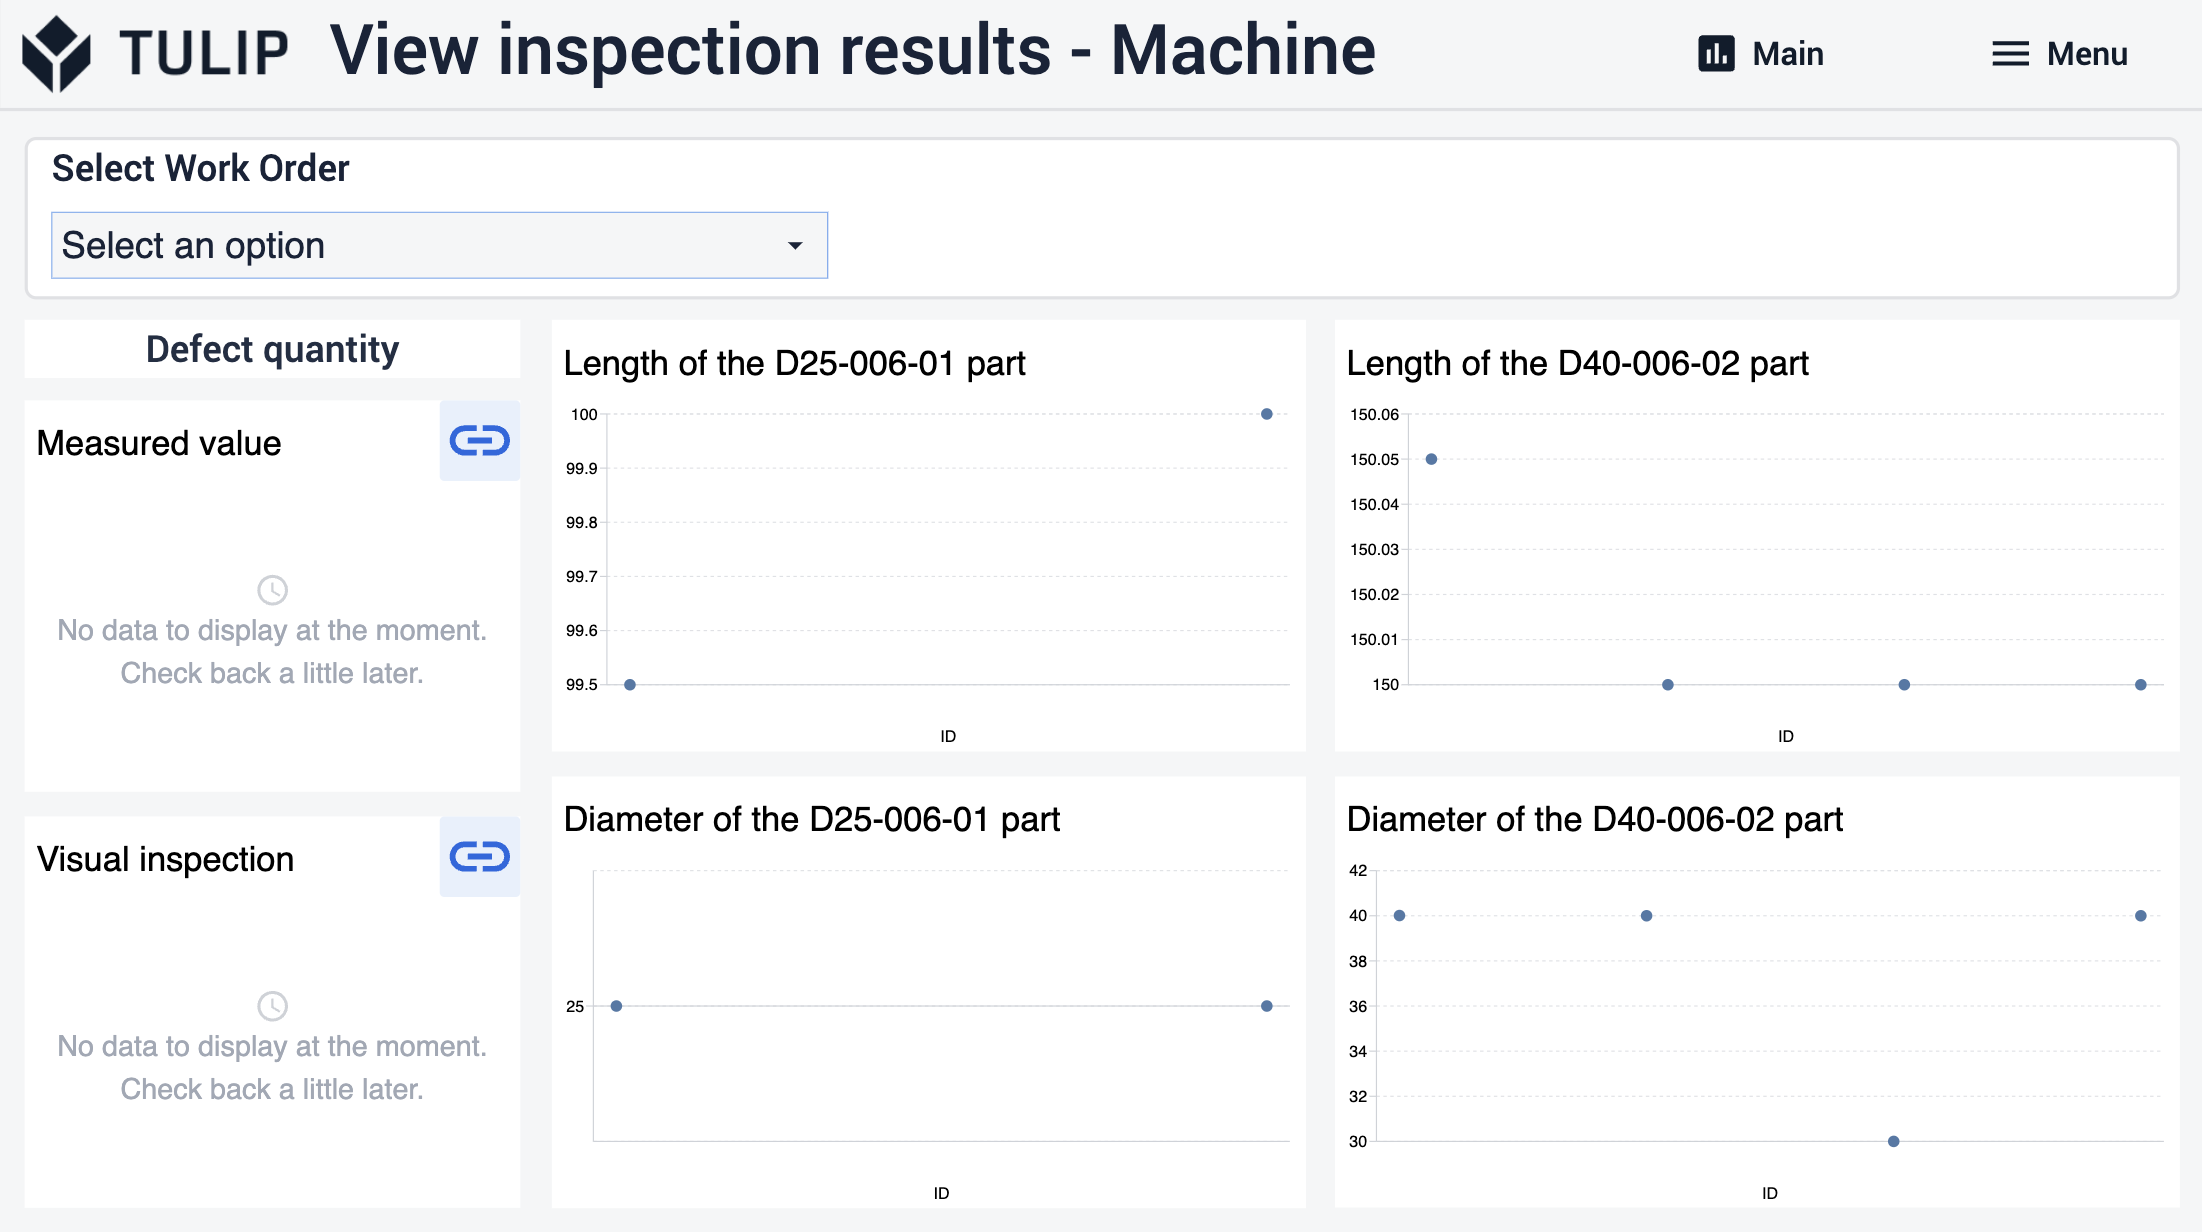
If users want to see the details of the defects, they can navigate to the steps by clicking on the buttons on the top right corner of the defects fields.
In these steps, all non-compliant results and their values are displayed for users. Selecting a record from the table will reveal additional information about the defect.
Extended App Connections
Examples for connecting apps to work with each other.
Quality Inspection Template
This application provides data from the inspection results and defects related to the batches or work orders.
Order Management and Order Execution
Use the Order Management and the Order Execution application from the Composable MES app suite. The former creates the work orders whereas the other logs completed units and updates order statuses.