Streamline your applications with this Custom Widget - allowing you to display data on a line grap directly form your application without the need to use Analytics.
Purpose
The purpose of this widget is to quickly and efficiently plot data in real-time. This functionality is meant for simple demonstrations and displays of data as it’s being generated, and can not perform calculations or analysis on the data
Tulip Integration Setup
Custom Widget Plugins provide a powerful tool for adding customized widgets to your application. Widgets allow you to write Javascript to extend and customize the functionality of a widget. Widgets can be imported to your Instance directly form the Tulip Library - either on their own, or as part of a Tulip App.
How it works
The Line Graph widget takes in four pieces of information as Props: a list of objects (series), two text variables to name the X and Y axis of the graph (xAxisLabel and yAxisLabel) and a color variable (linecolor).
The "series" input takes in an array object consisting lists with of three pieces of data: a single-width list of x values (xAxisNums), a list of y values (yAxisNums) and a color variable (seriesColor).
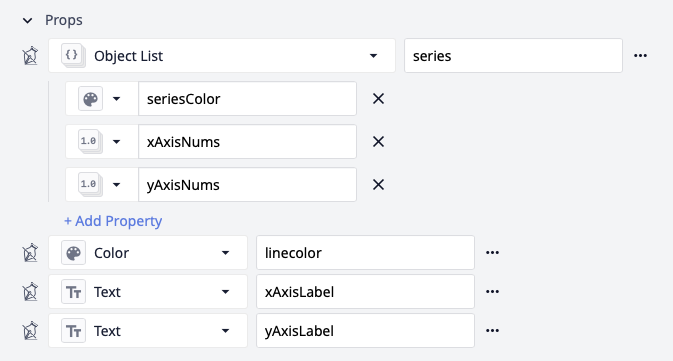
Multiple lines can be plotted by passing in multiple objects, with each object representing a line.
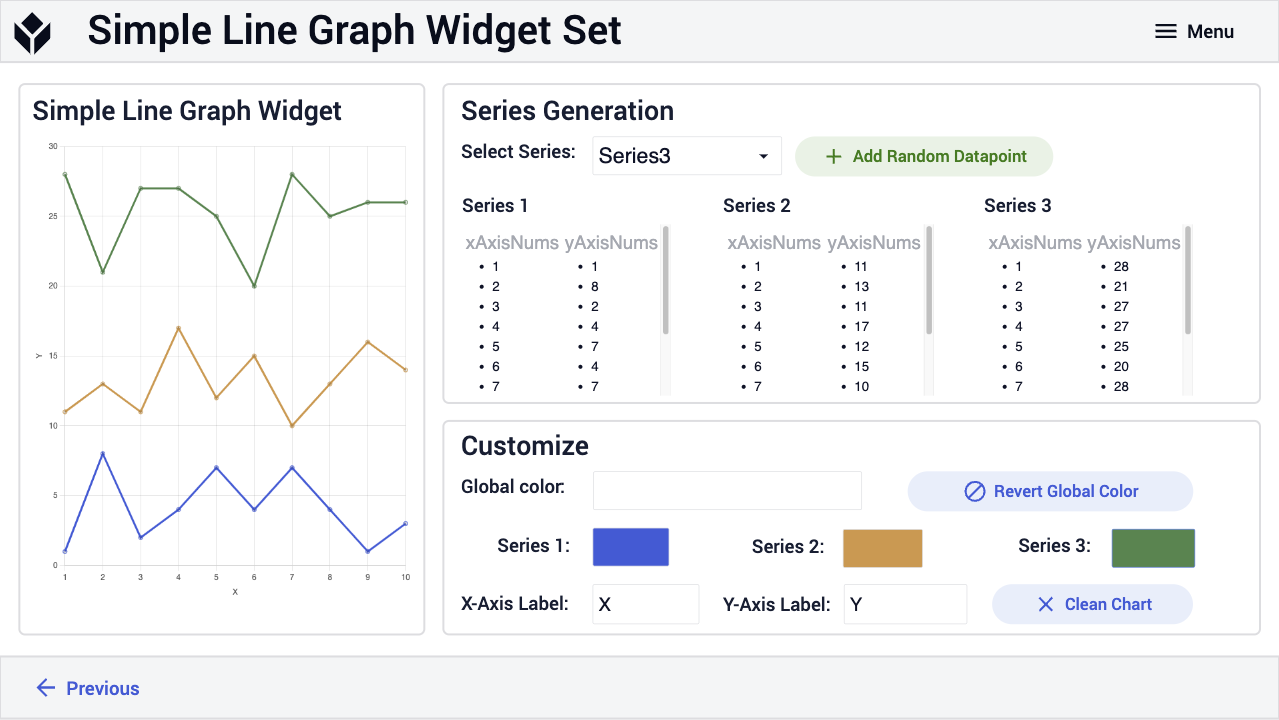
You have the option to select a different color for each generated series. If you do not make a choice, the widget will automatically choose one from 10 predefined colors for each series. Alternatively, you can also opt for a global color. Choosing the global color will override the individual colors chosen for each series.
Further Reading
If you would like to know more about custom widgets please visit the site below: