To download the app, visit: Library
This article provides an overview of how the Dashboard and Traveler application is constructed and its primary objectives.
Purpose
The Dashboard and Traveler Application serve multiple crucial purposes related to analyzing and visualizing data logged in the production area. Firstly, it plays a vital role in helping management optimize the production process by providing valuable insights through a dashboard. Additionally, this application allows for the visualization of order data, enabling both the production manager and the customer to stay informed about the current status of an order.
Tables Used by the Dashboard and Traveler Application
The application employs a Tulip Table named the "Order Materials" table to store comprehensive information about the orders. Each record in this table represents an order, possessing a unique ID, Product type, and status. Additionally, users have the flexibility to store any other necessary information required for efficient order management.
Fields of the Order Materials Table
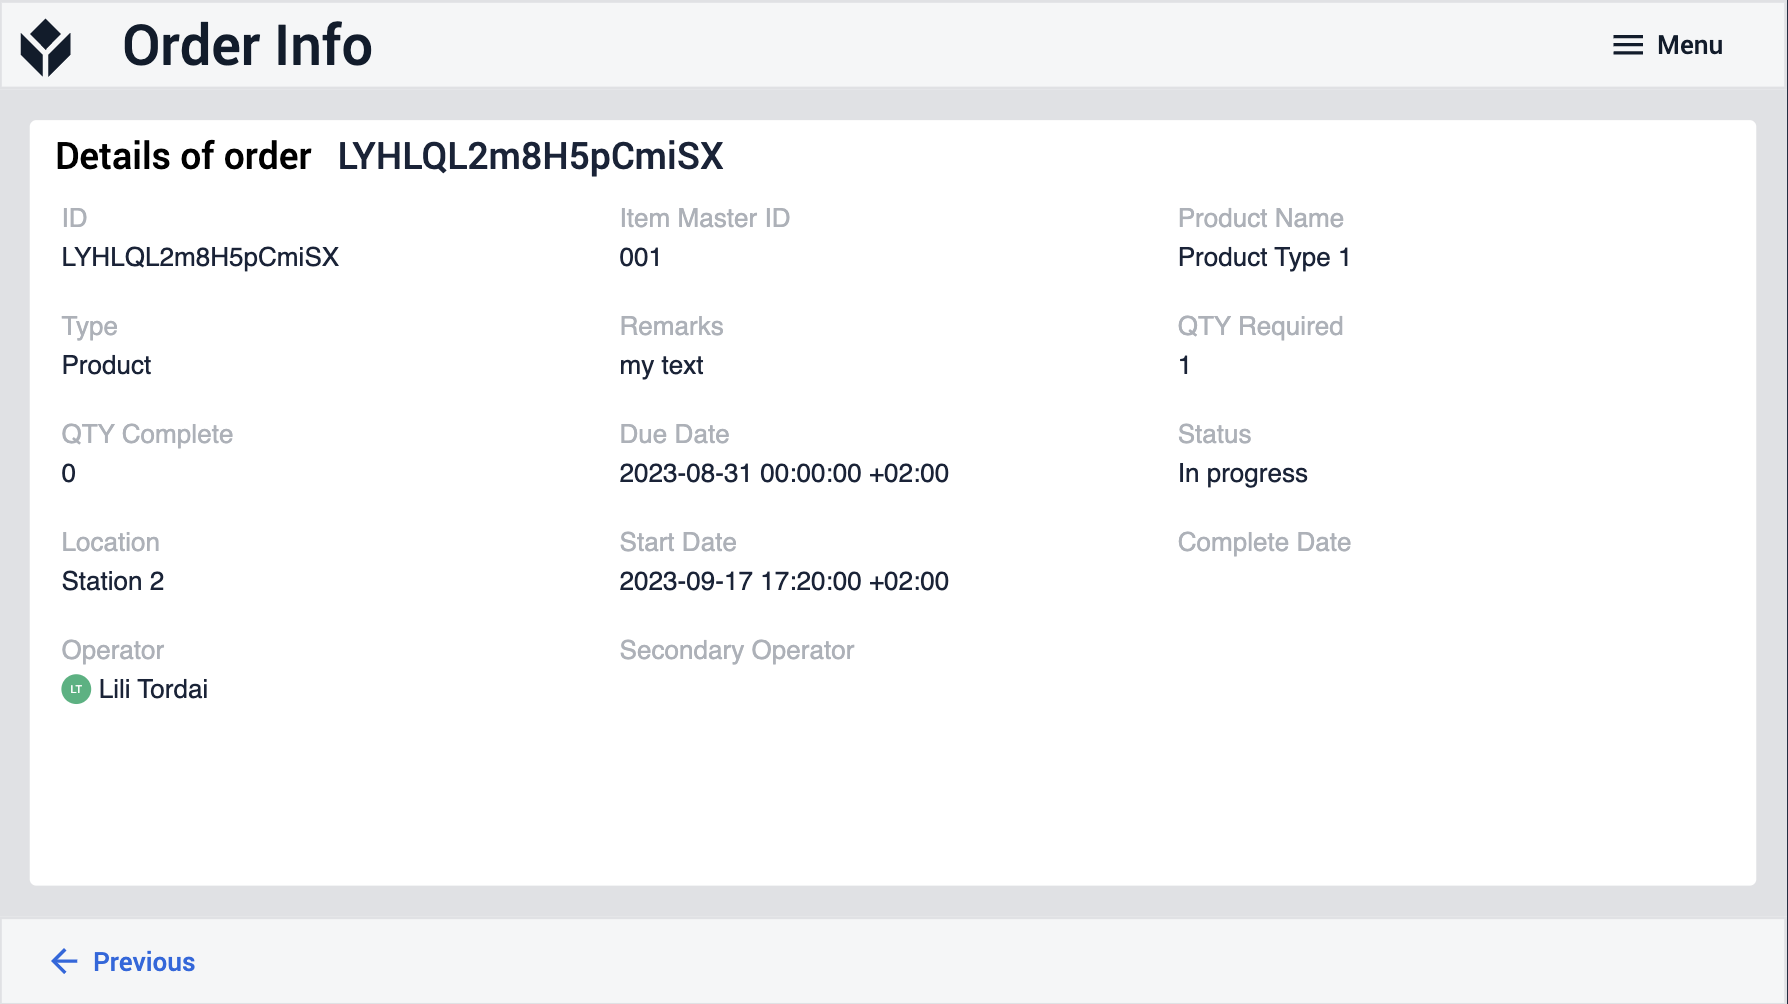
ID: Unique identifier for the order.
Item Master ID (optional field): Link to the Item Master table, defining various product types.
Product Name: Name of the product.
Type: Type of the product.
QTY required: Quantity specified by the order.
QTY complete: Number of products already produced.
Due Date: Deadline for order completion.
Status: Current status of the order.
Location: The current location of the product.
App Structure
The application is structured into two main steps:
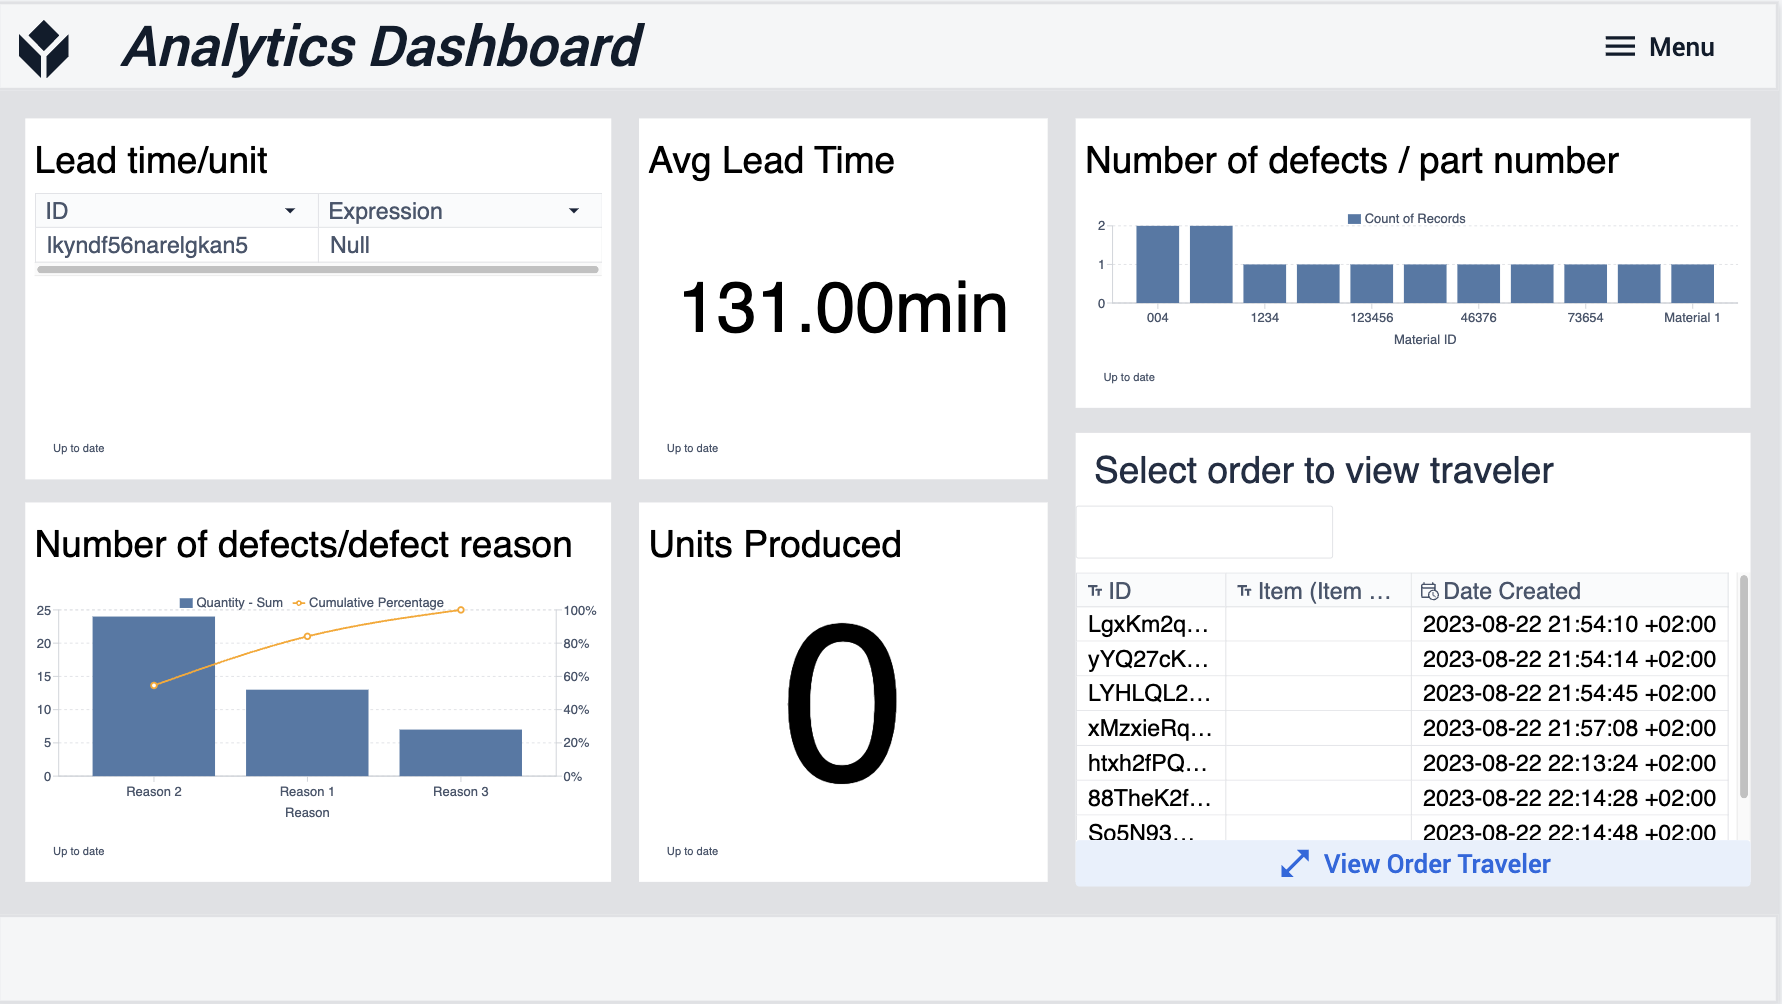
Analytics Dashboard:
The initial step, where users can access insightful analyses such as:
Lead time/unit: Time taken from process start to conclusion for all produced parts.
Average Lead Time: Average duration from the start of the manufacturing process to its completion.
Number of defects/defect reason: Pareto chart highlighting the most common defect reasons.
Units Produced: Total number of units produced.
Number of defects/part number: Bar chart illustrating the association of defect events with different materials.
Order Data View:
An additional step can be included to allow users to view order-specific data, offering insights into the status and details of individual orders.
By following this structured approach, the Dashboard and Traveler Application effectively address the need for data analysis and visualization in the production area, aiding in process optimization and providing valuable information about order status to both the production team and customers