This guide will help you set up individual machines in Tulip via the Machines page and see their history.
In this article, you will learn:
- How to add individual machines to Tulip and map their data via attributes
- How to view the history of these machines without using an app or analytics
Create a Machine
In order to monitor machines in Tulip, you must first establish a connection to your data source:
Then, you should set up machine types and attributes to categorize the data coming off the machine.
To start adding individual machines, head to the Machines tab under Shop Floor.
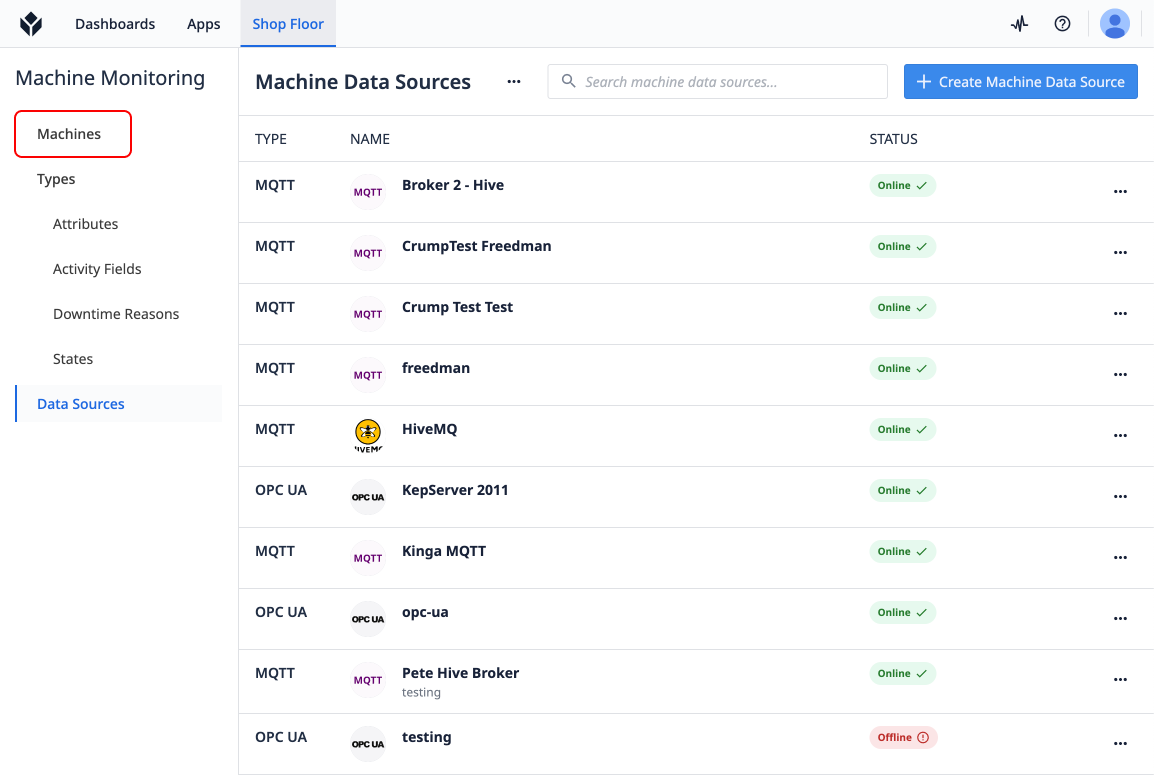
To add your first machine to Tulip, use the Create Machine button.
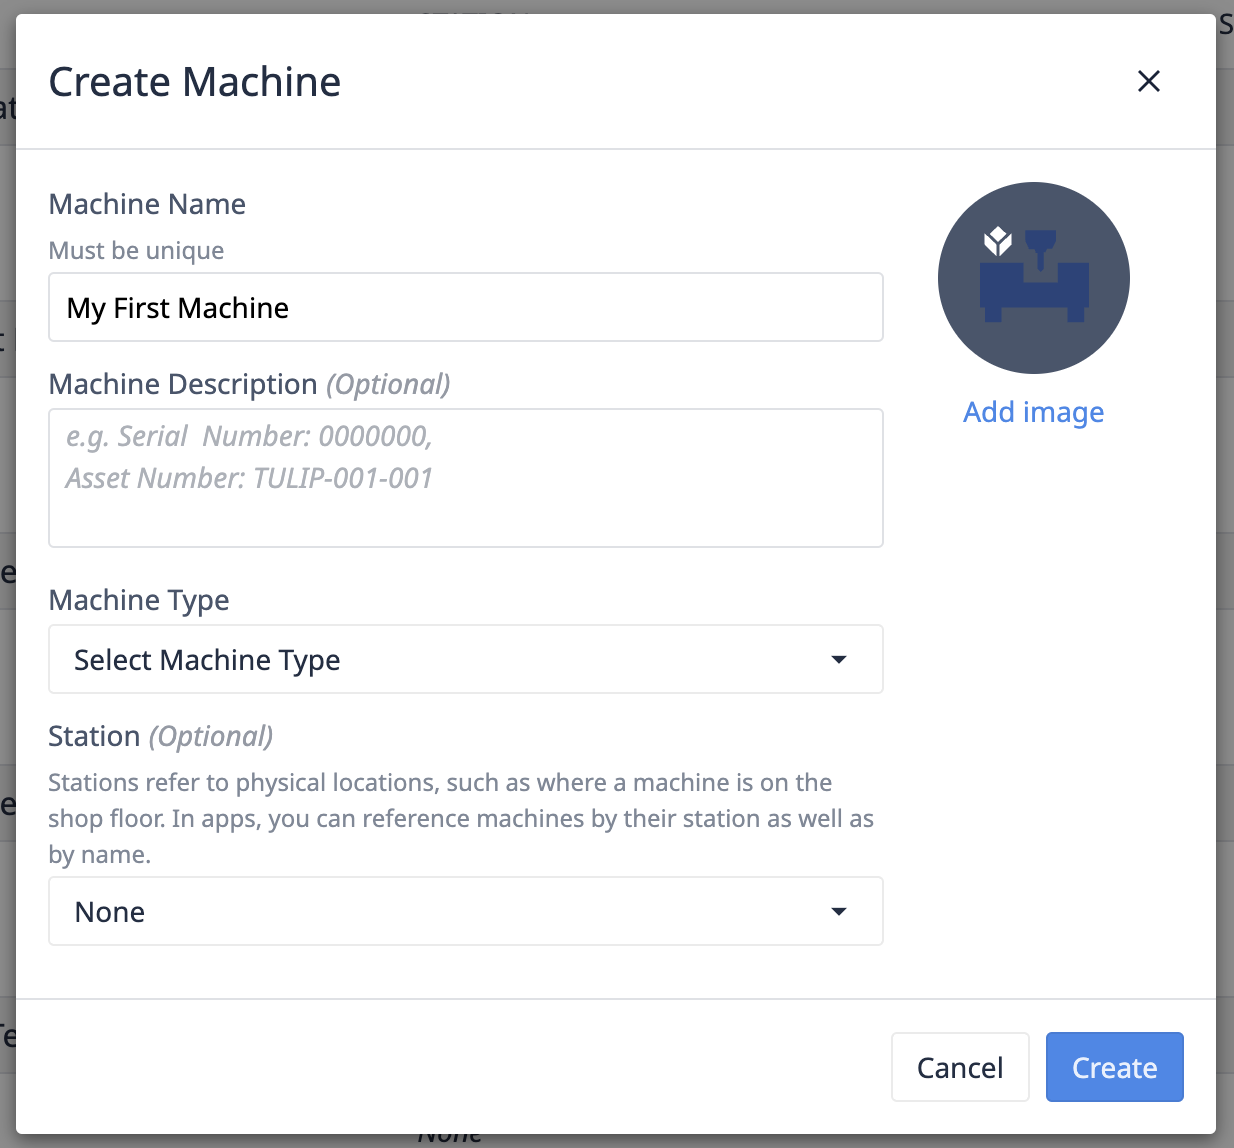
- Give your machine a name.
- Select your Machine Type.
- [Optionally] map your machine to a Station.
- Mapping to a station will allow you to use at this station trigger actions to share applications across your fleet of machines.
- Click Create.
Map Machine Attributes to a datasource
Our machine has been created, now we need to map its attributes to the topics or nodes on our machine data source.
-
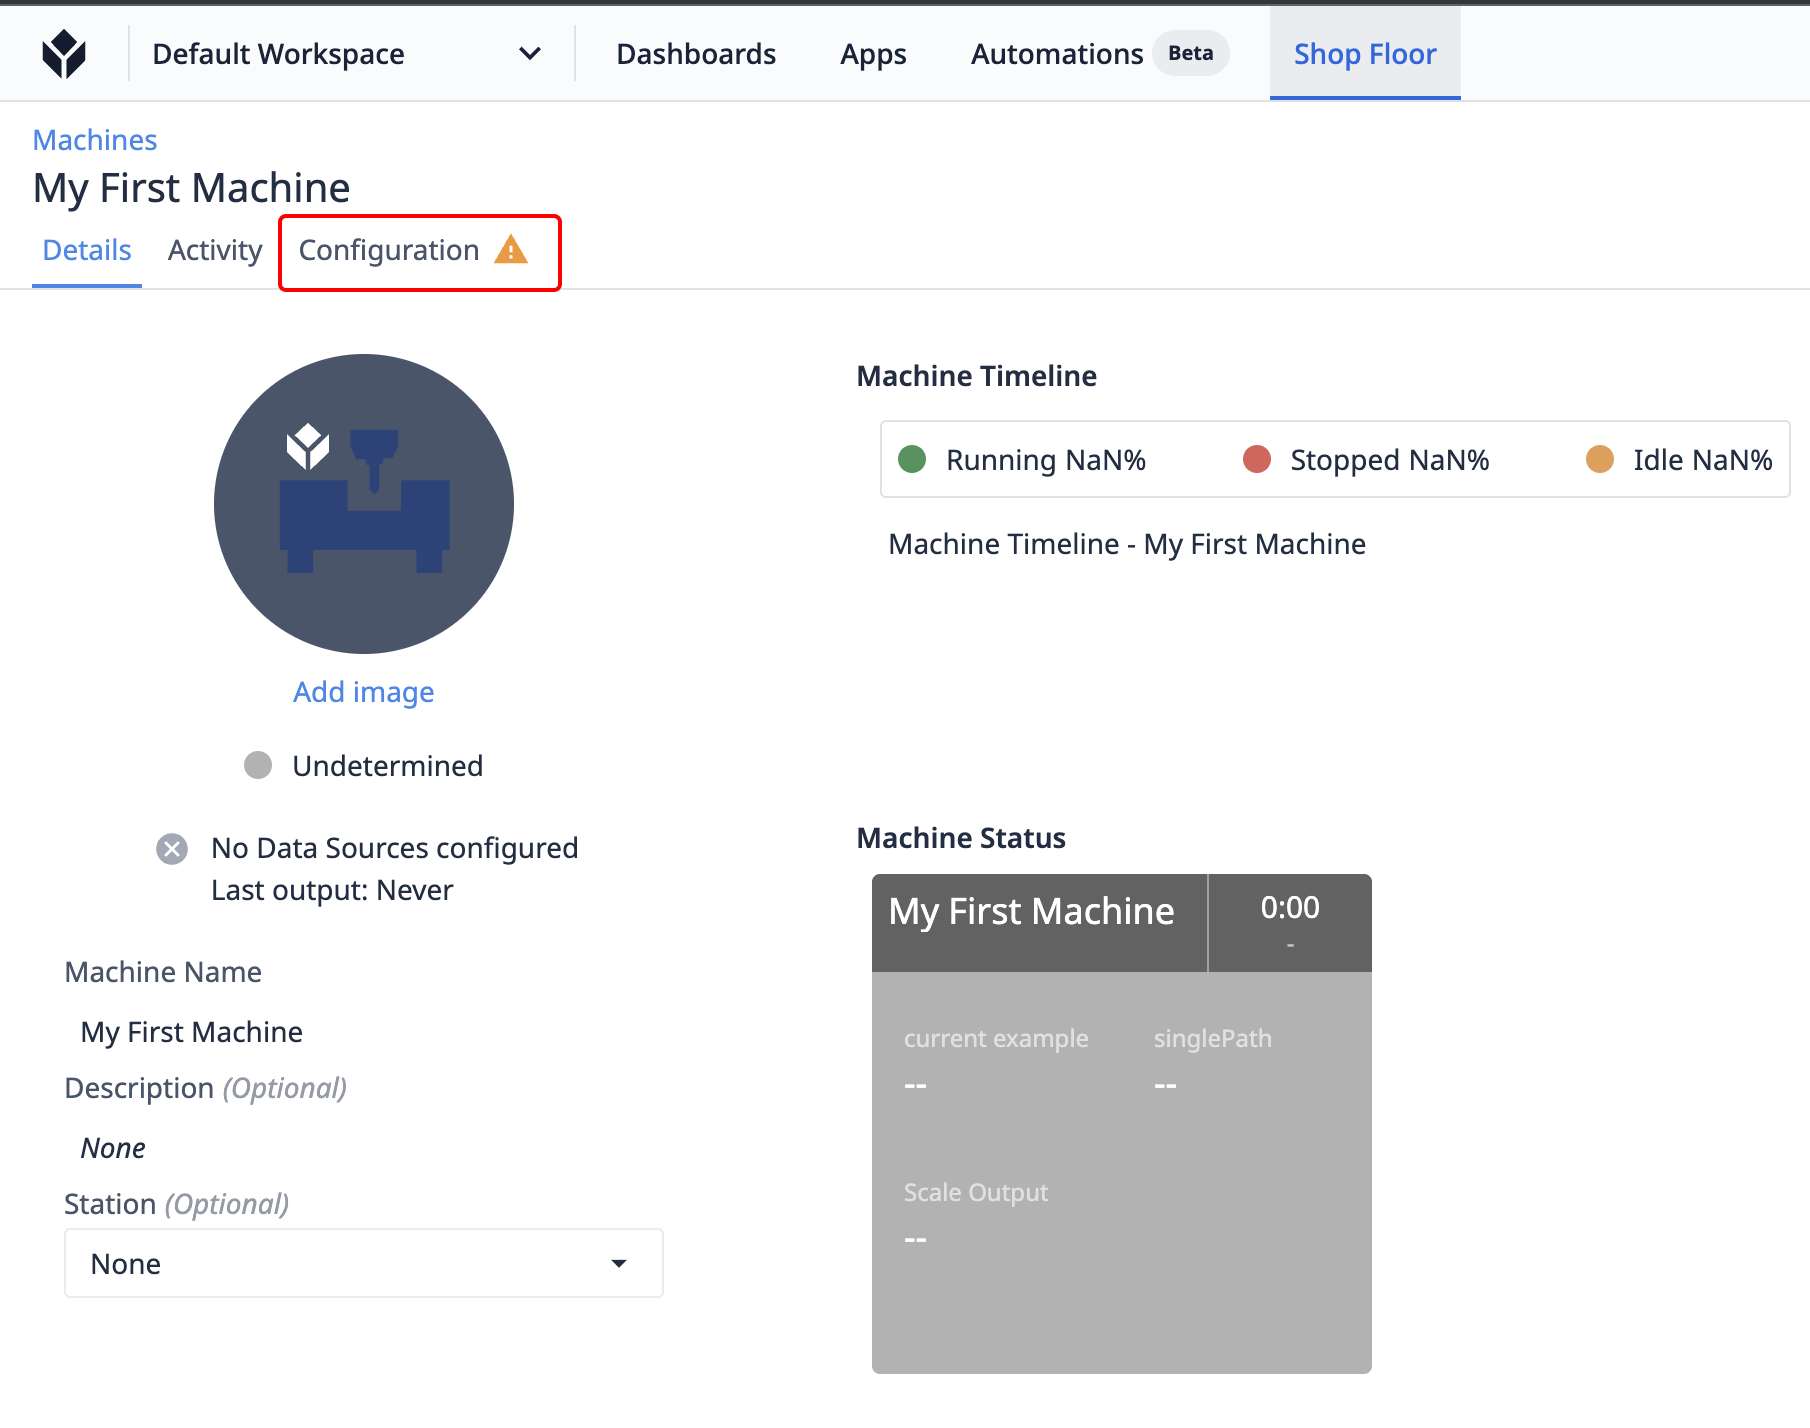
Navigate to the Configuration tab.
Notice that this tab has a yellow warning icon indicating that some machine attributes are not currently mapped to machine data sources
-
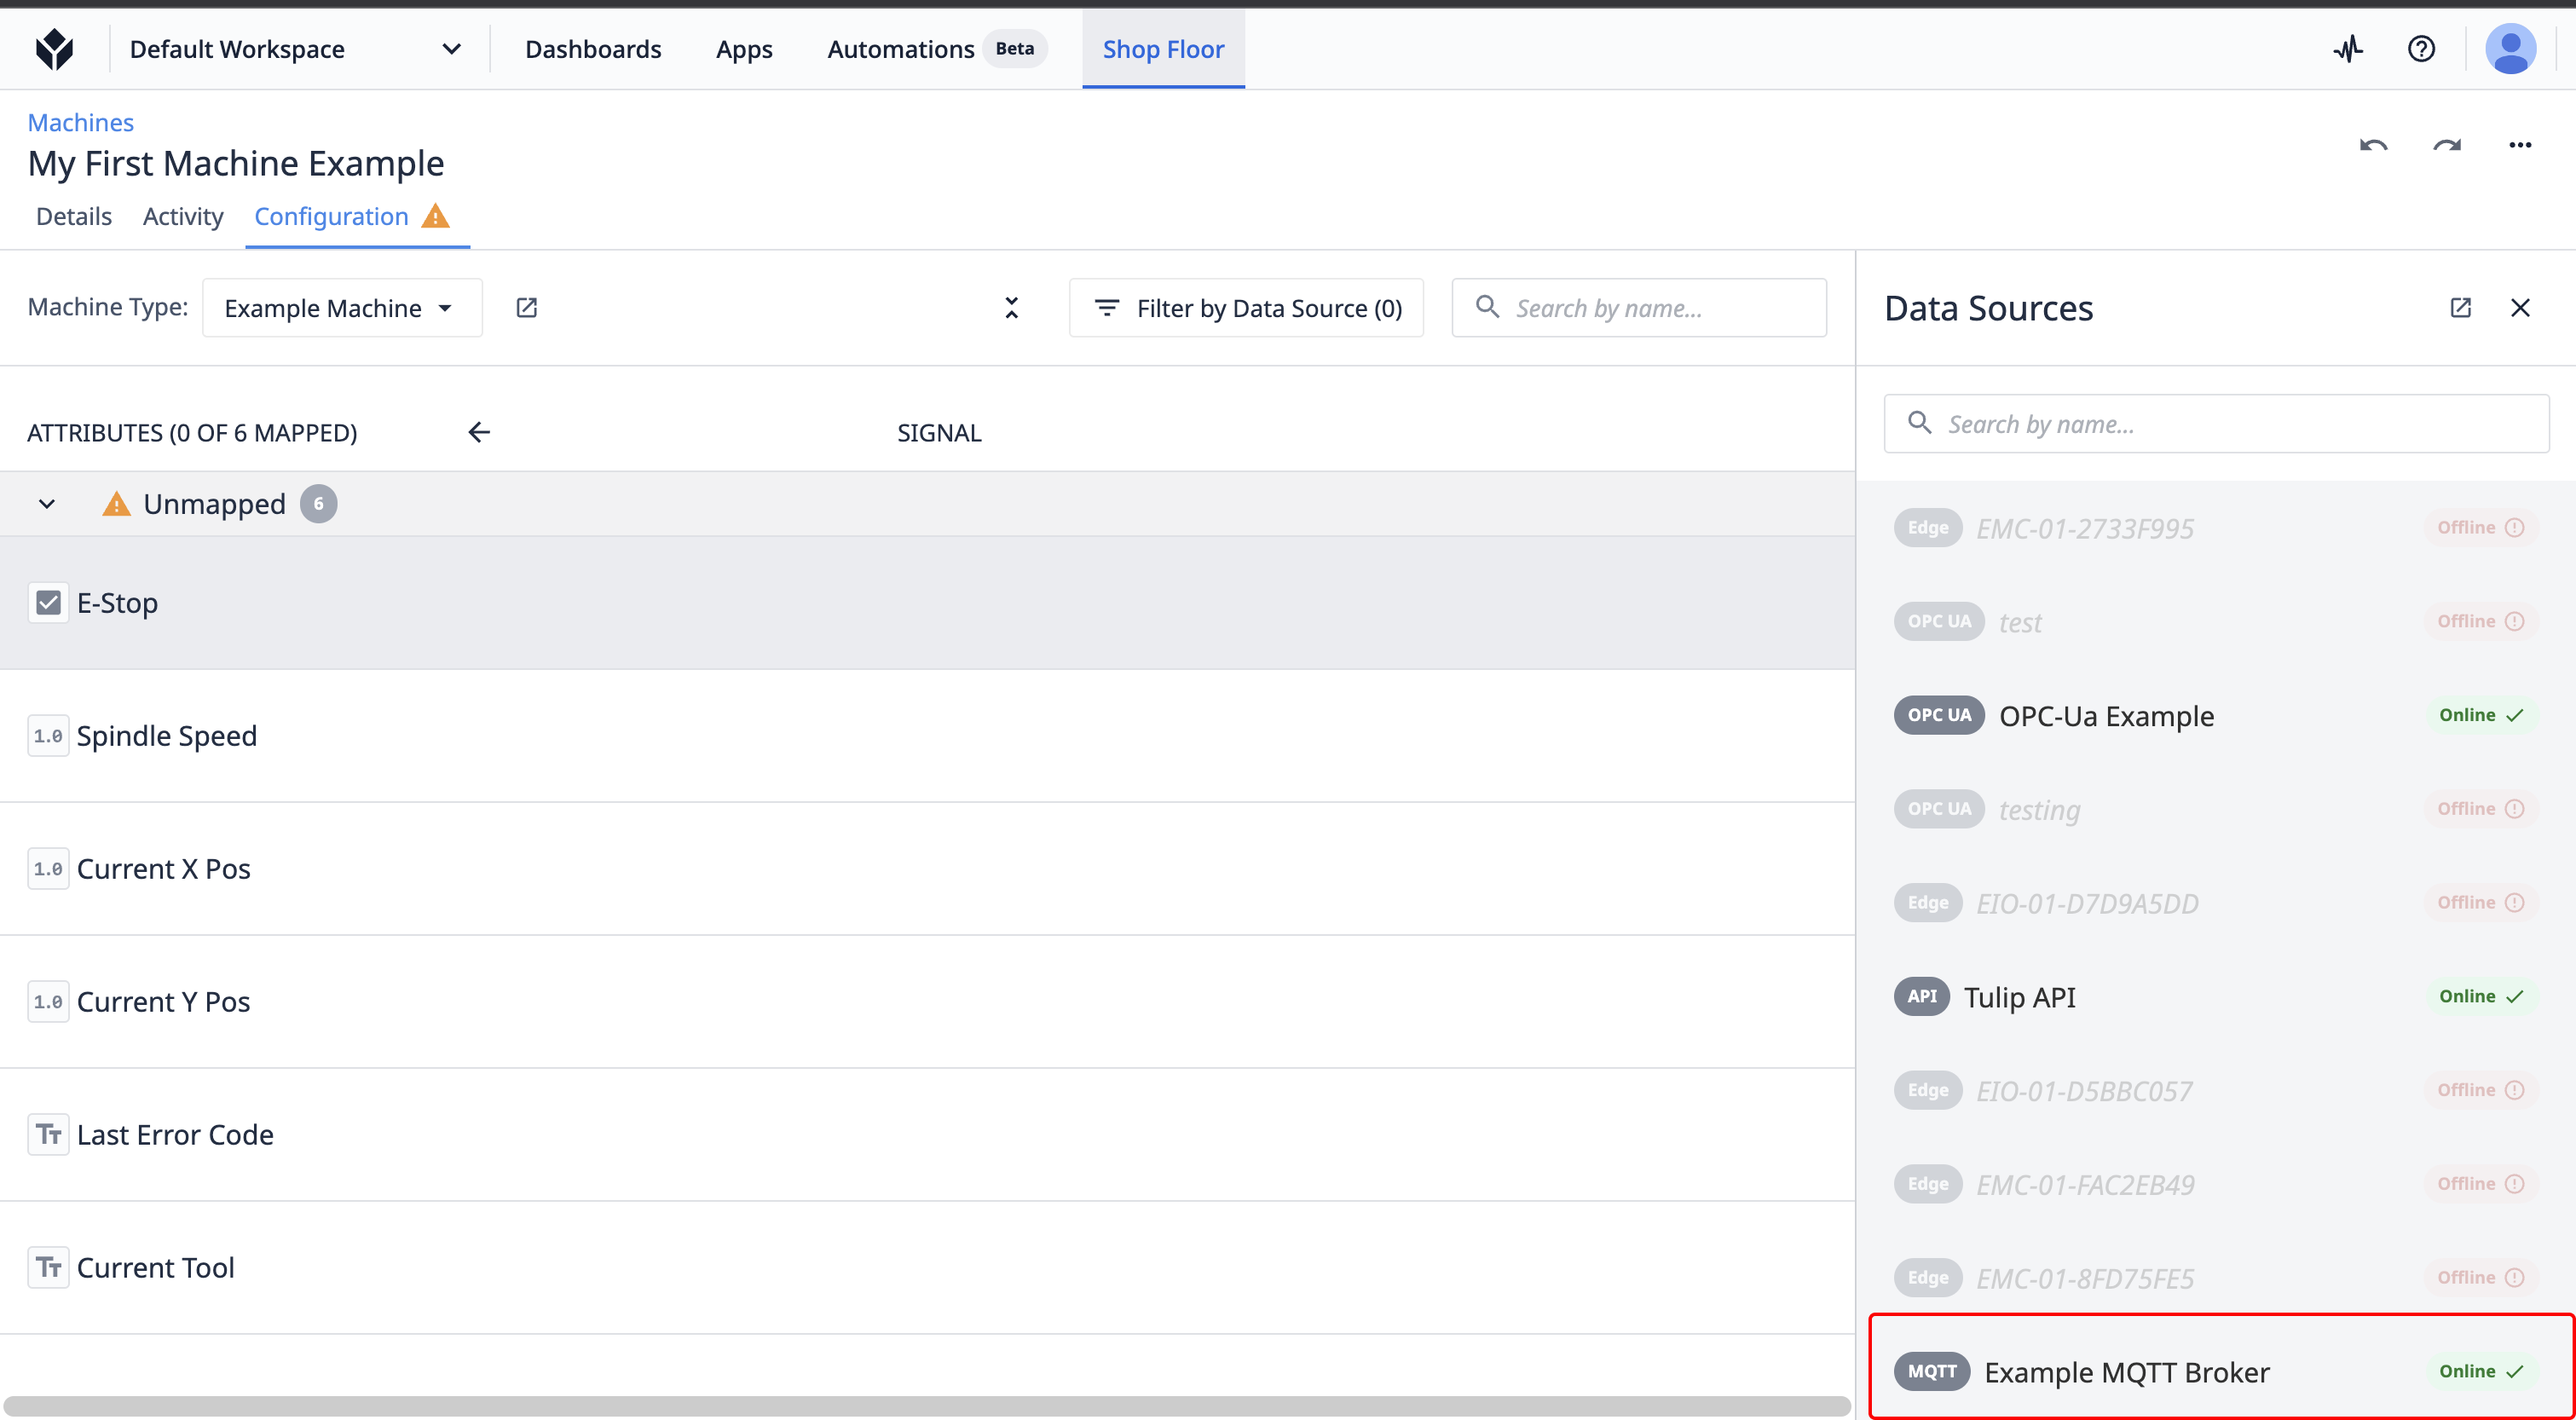
Select an attribute. Depending on your desired data source type, mapping will differ.
Map to MQTT
-
Select your broker.
-
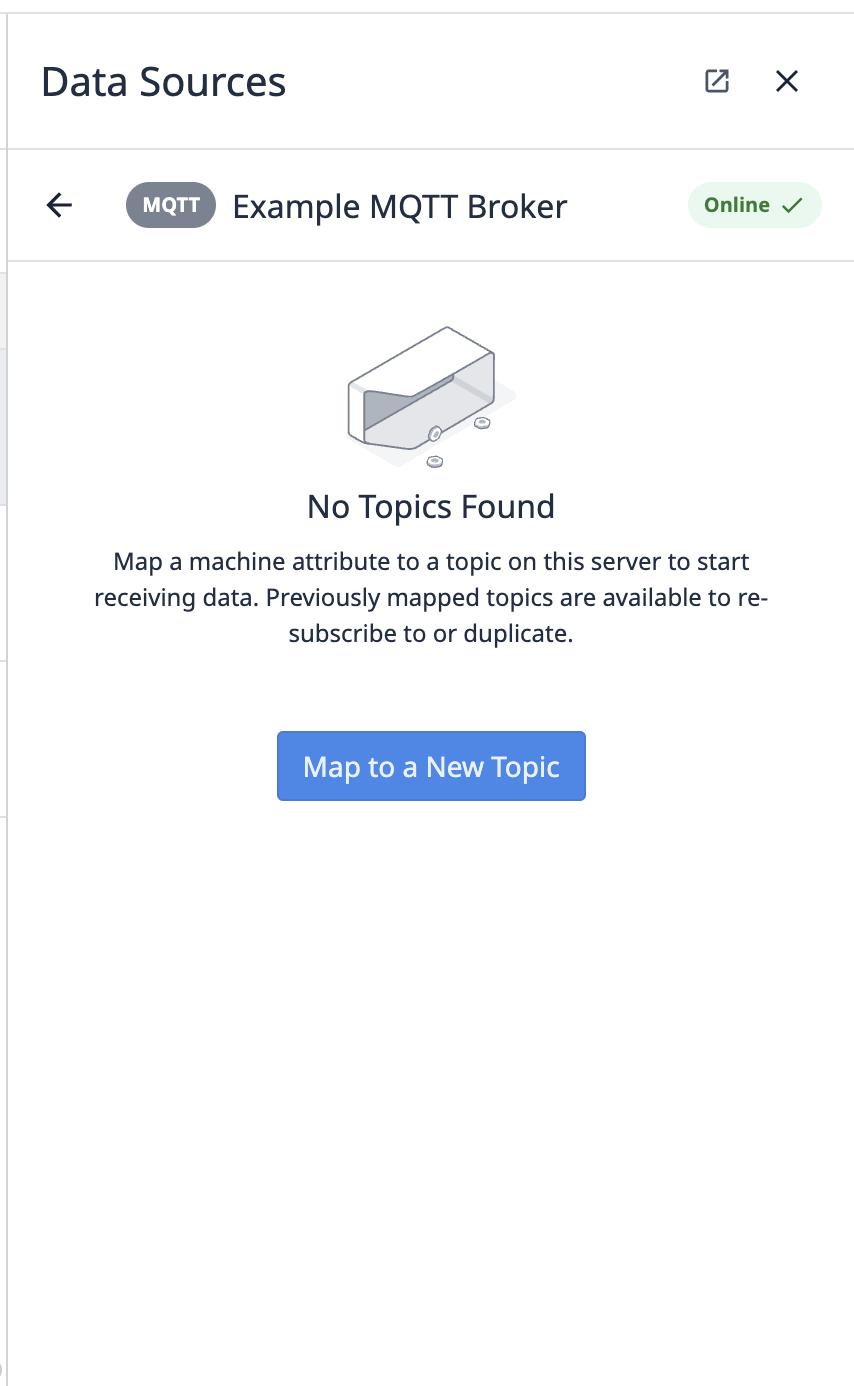
If no topics have been mapped on this machine select "Map to a new topic".
-
Enter the topic path where your machine is outputting data.
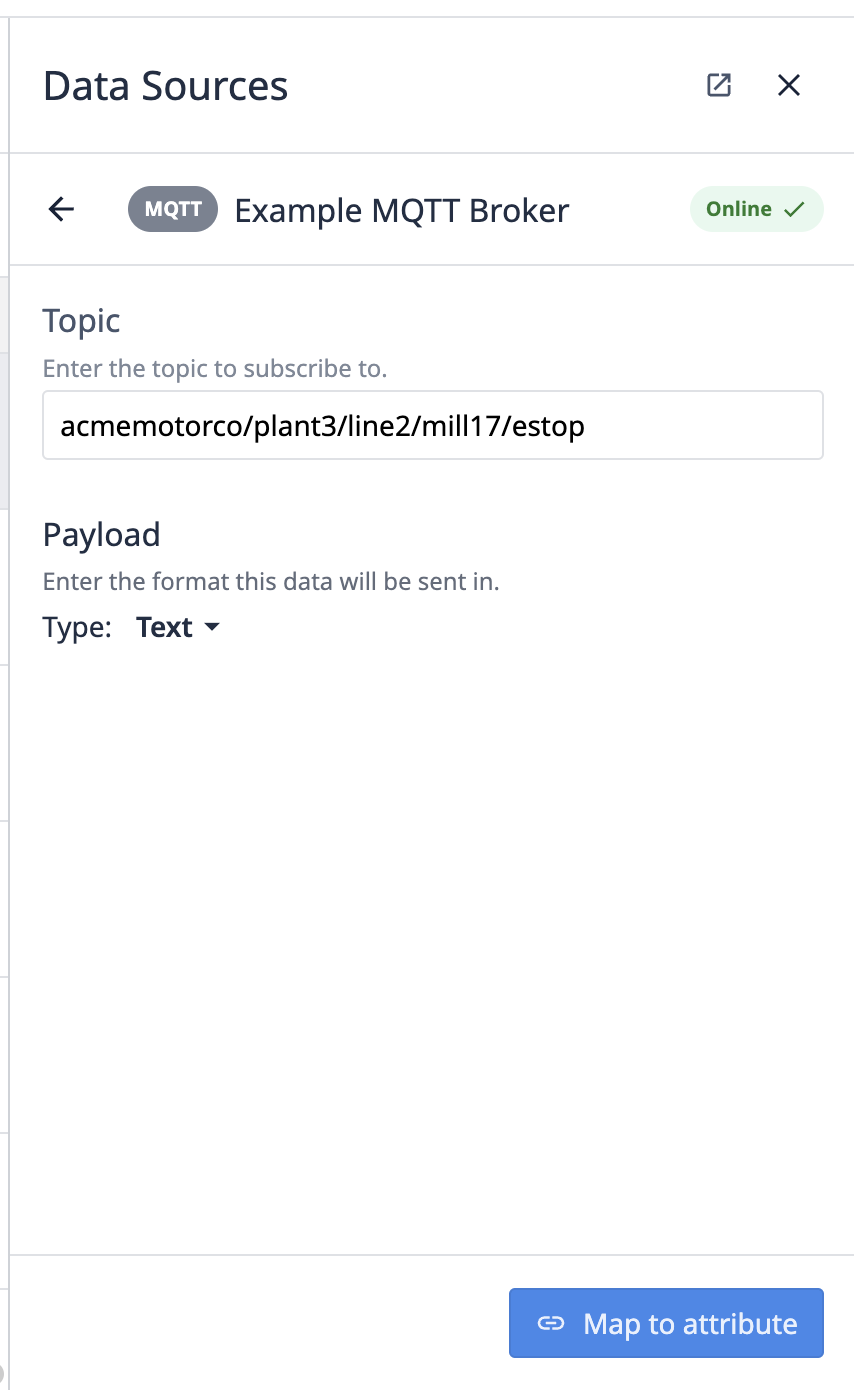
We don't currently support single or multilevel wildcards in MQTT topics.
Get latest message
Select the Get Latest Message button to pull the last message (or the retain message) for the entered topic.
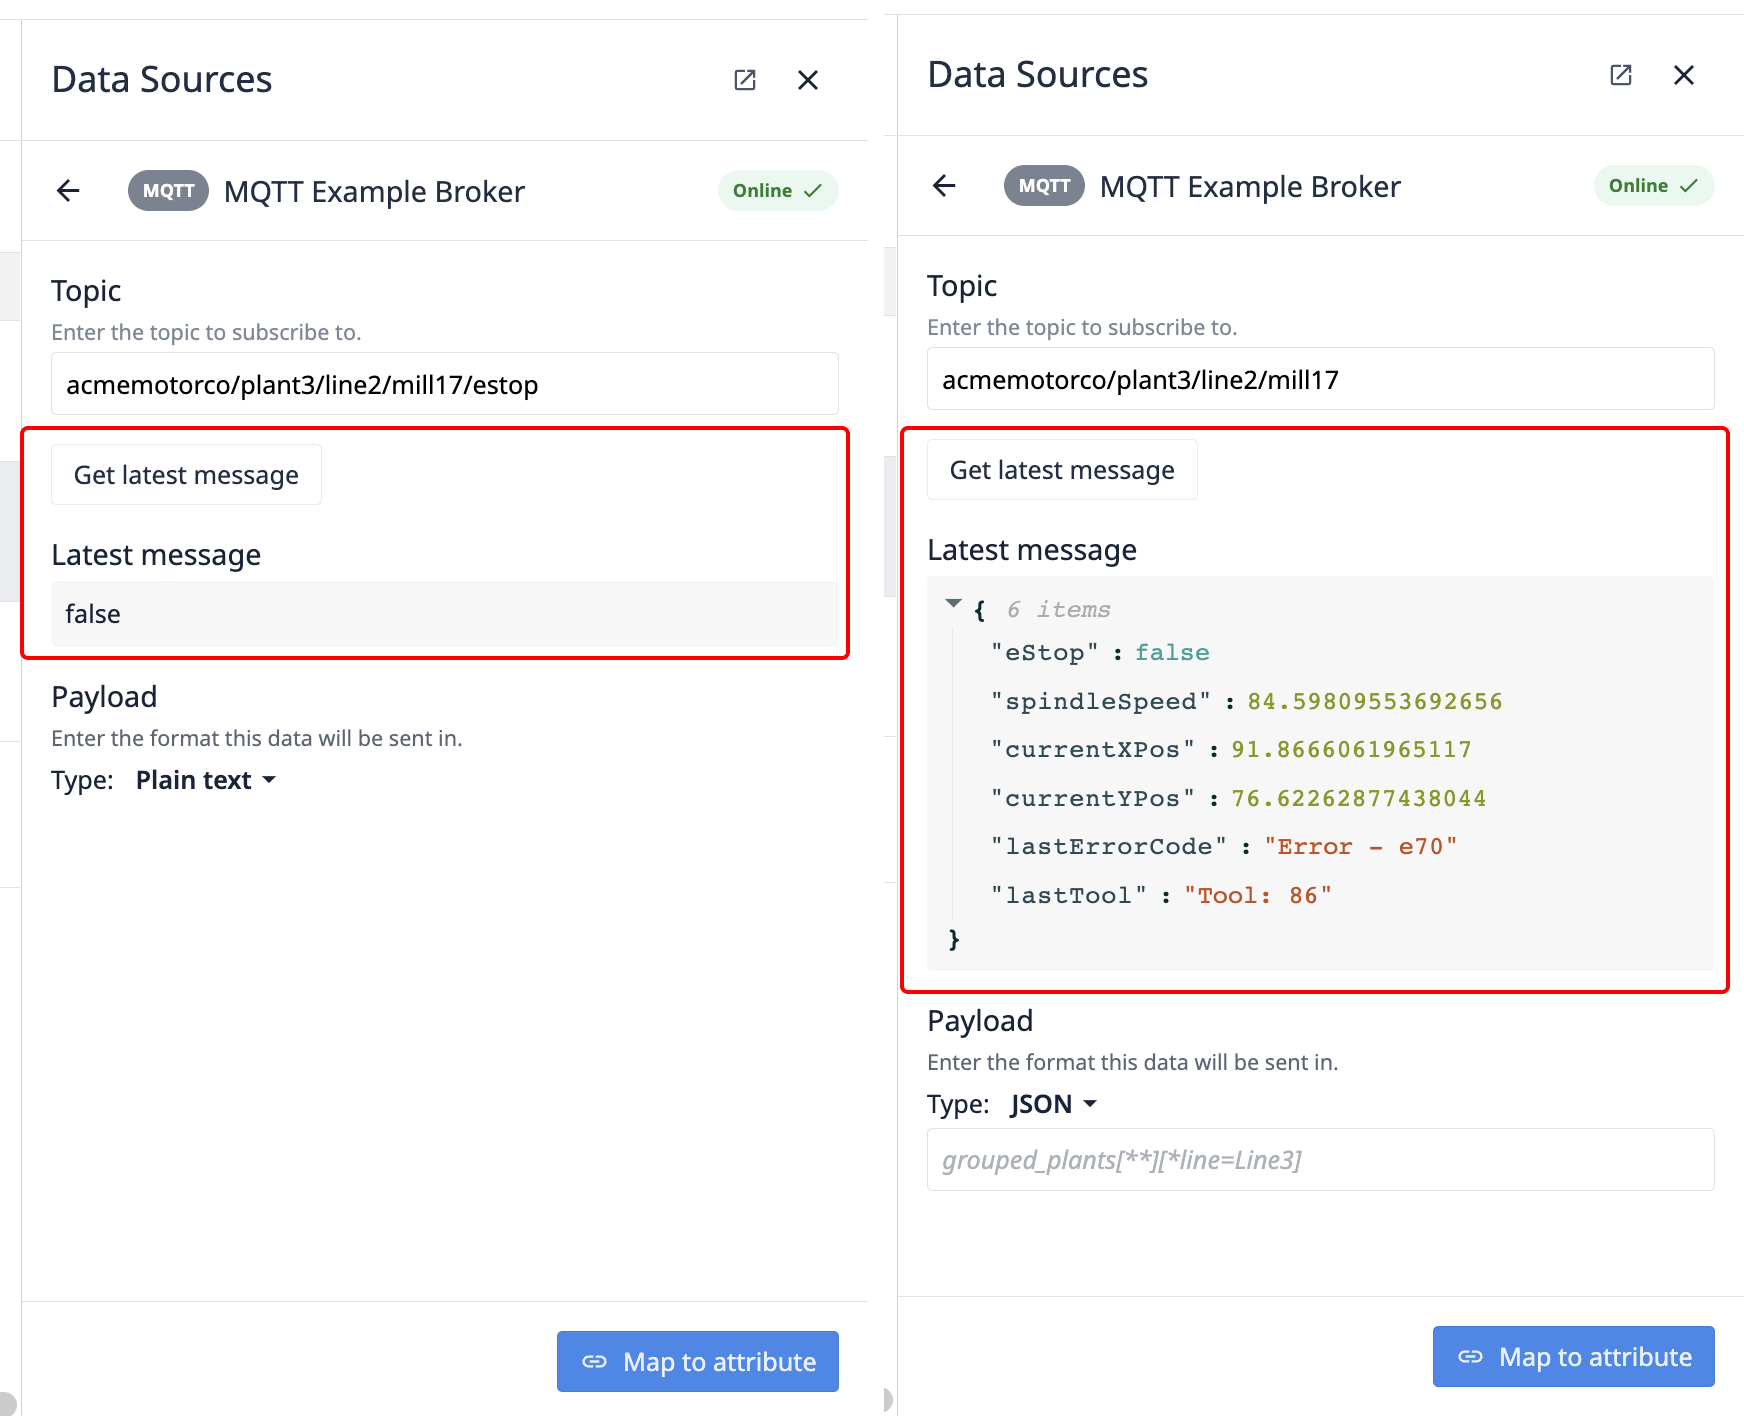
If another machine attribute is mapped to this topic, we will return the latest message, even if the retained flag was not enabled on that message. This avoids interruptions in this data streaming to those other machine attributes. If the topic is unused by other machines, the retained message will be returned.
JSON payloads
If the data being passed as a json payload, JSON can be selected from the payload type and a selector can be added to identify what part of the JSON blob to map to the machine attribute, or a key:value pair can be selected in the latest message and a selector will automatically be generated. Tulip implements the JSON-Query format for all JSON extractors.
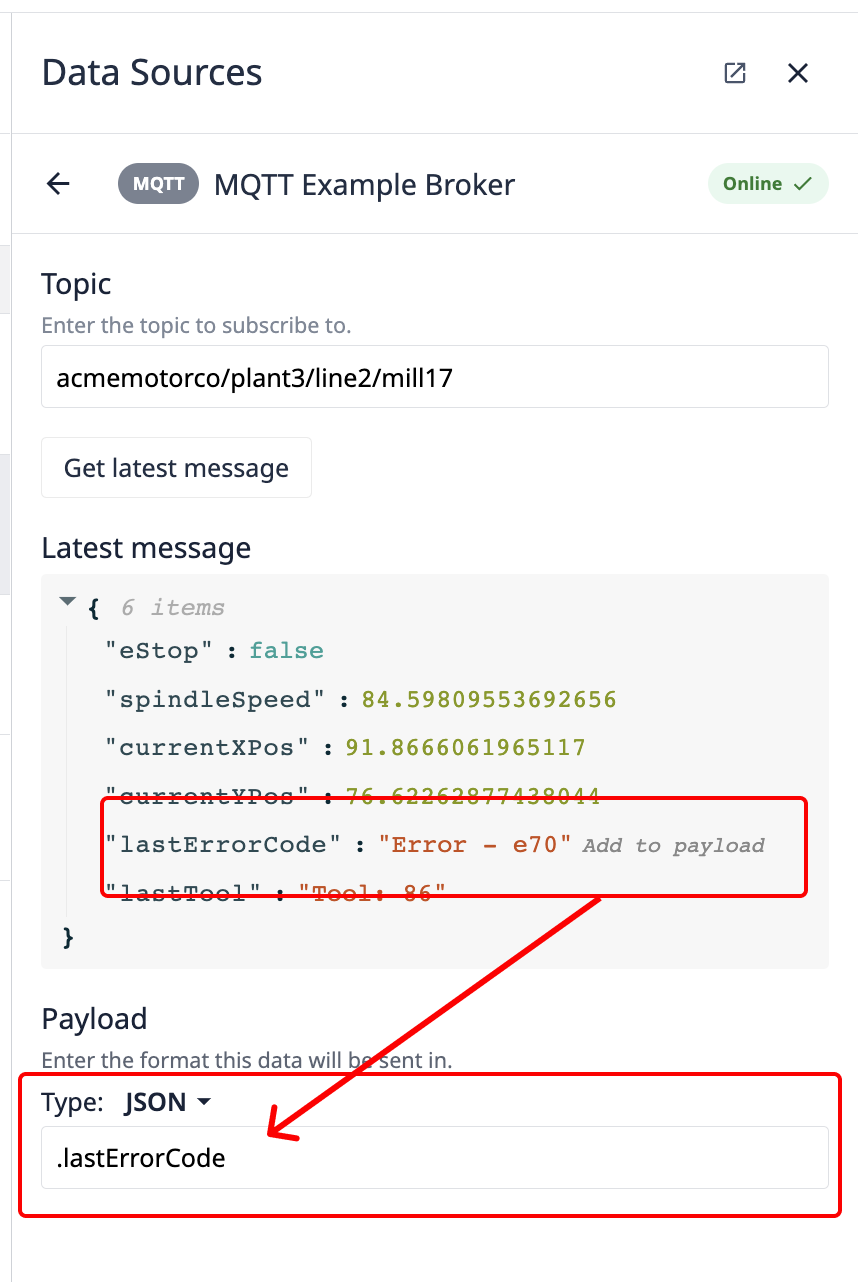
Select Map to Attribute.
Map to OPC-UA
OPC UA Server's differ in their implemention of the OPC UA spec. Tulip has been built for complete compatibility with PTC Kepware-compliant OPC UA servers, and may only support a subset of functionality for other OPC UA servers.
OPC UA servers implemented directly by PLCs often implement unique signatures for their OPC UA servers. Kepware has invested the time to build implementations to each of these server specs. Learn more.
- Select your OPC UA Data Source.
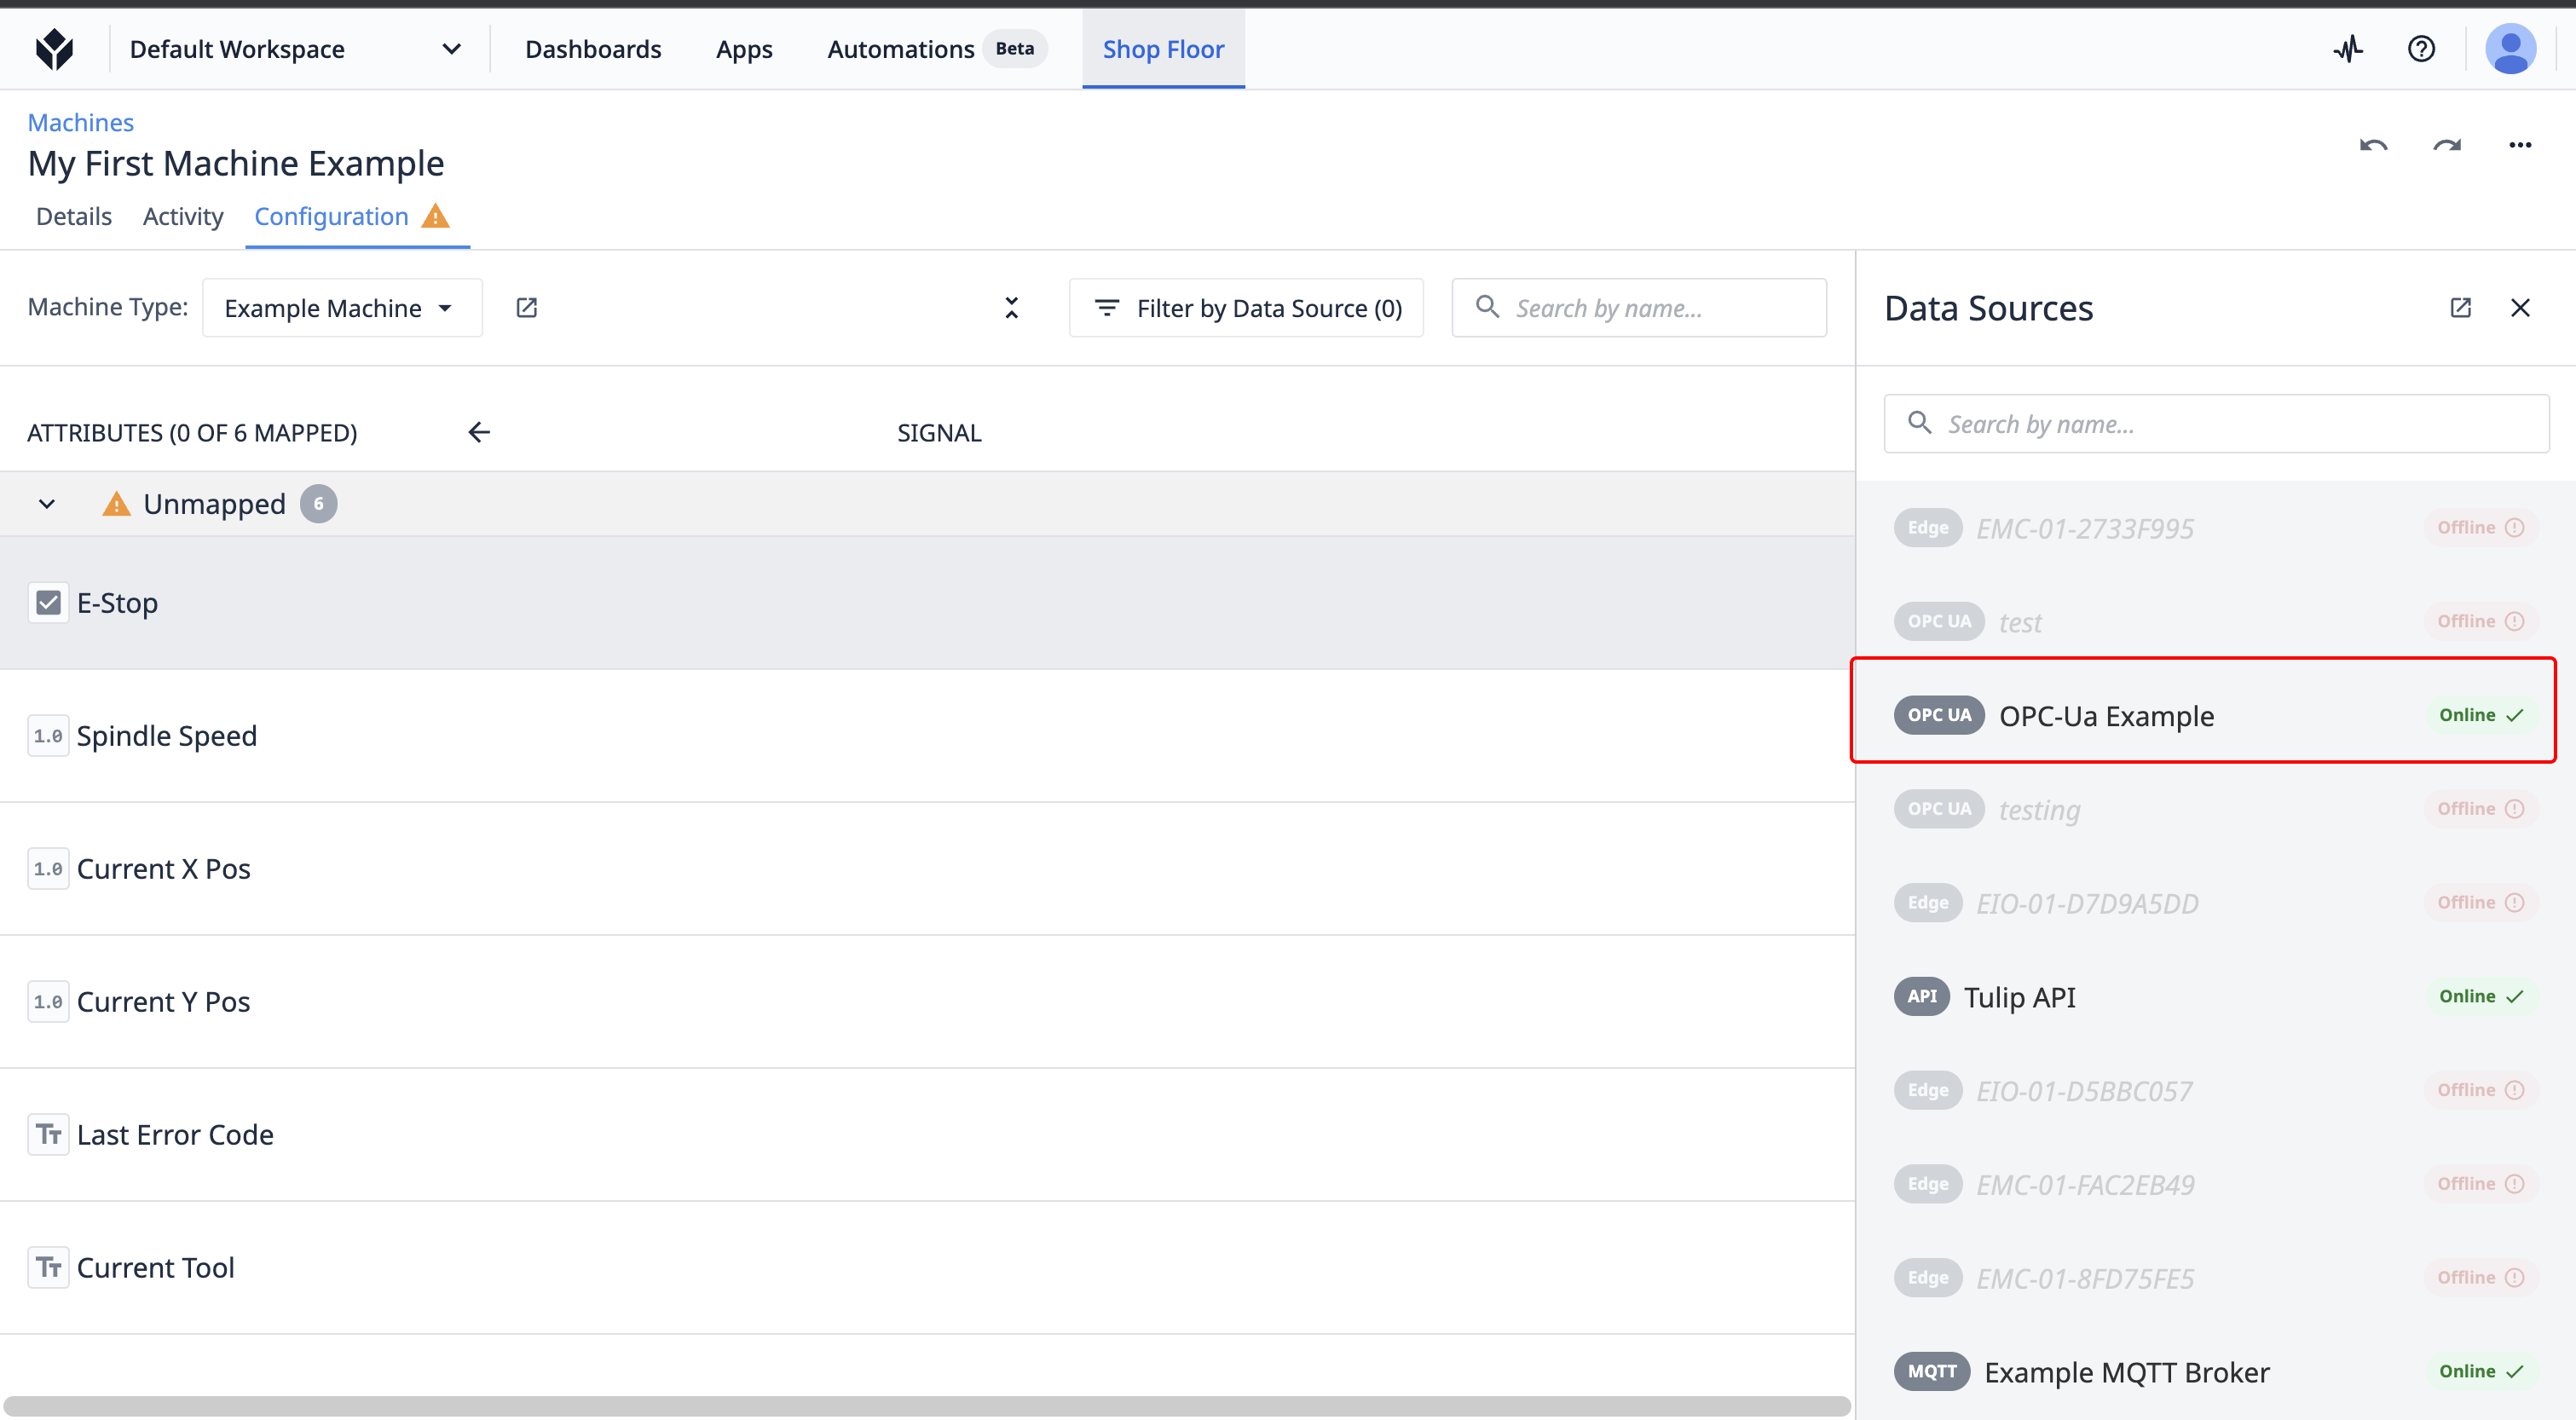
-
Navigate to the OPC UA Node associated with this machine attribute.
-
Click the map icon.
Note: Only machine attributes of the same type can be mapped to OPC-Ua nodes
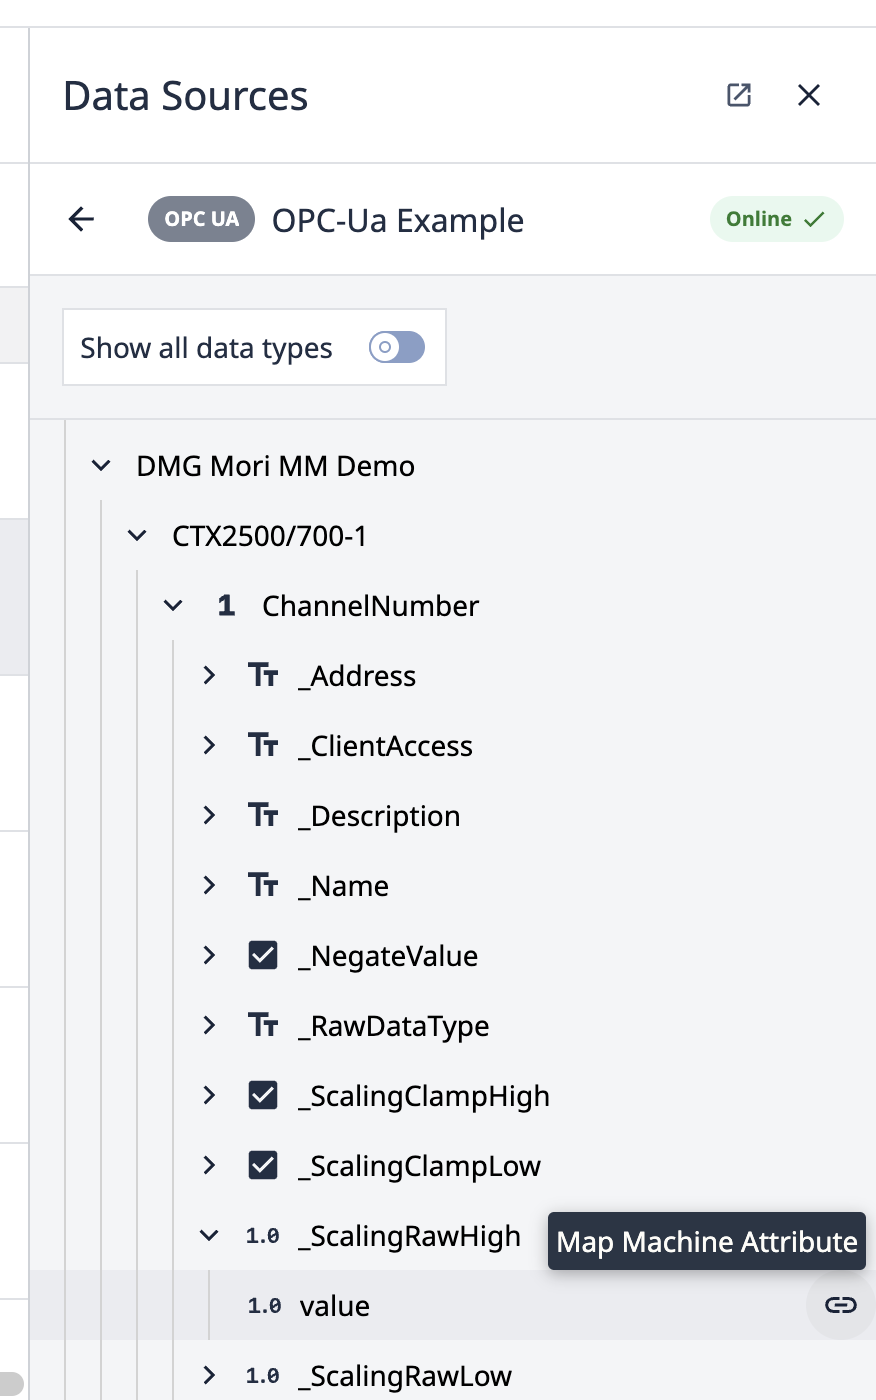
OPC UA data types
| Machine attribute type | Supported OPC UA type(s) |
|---|---|
| Boolean | Boolean |
| Integer | SByte, Byte, Int16, UInt16, Int32, UInt32 |
| Number (floating point) | Float, Double |
| Text | String, LocalizedText |
Map to Tulip API
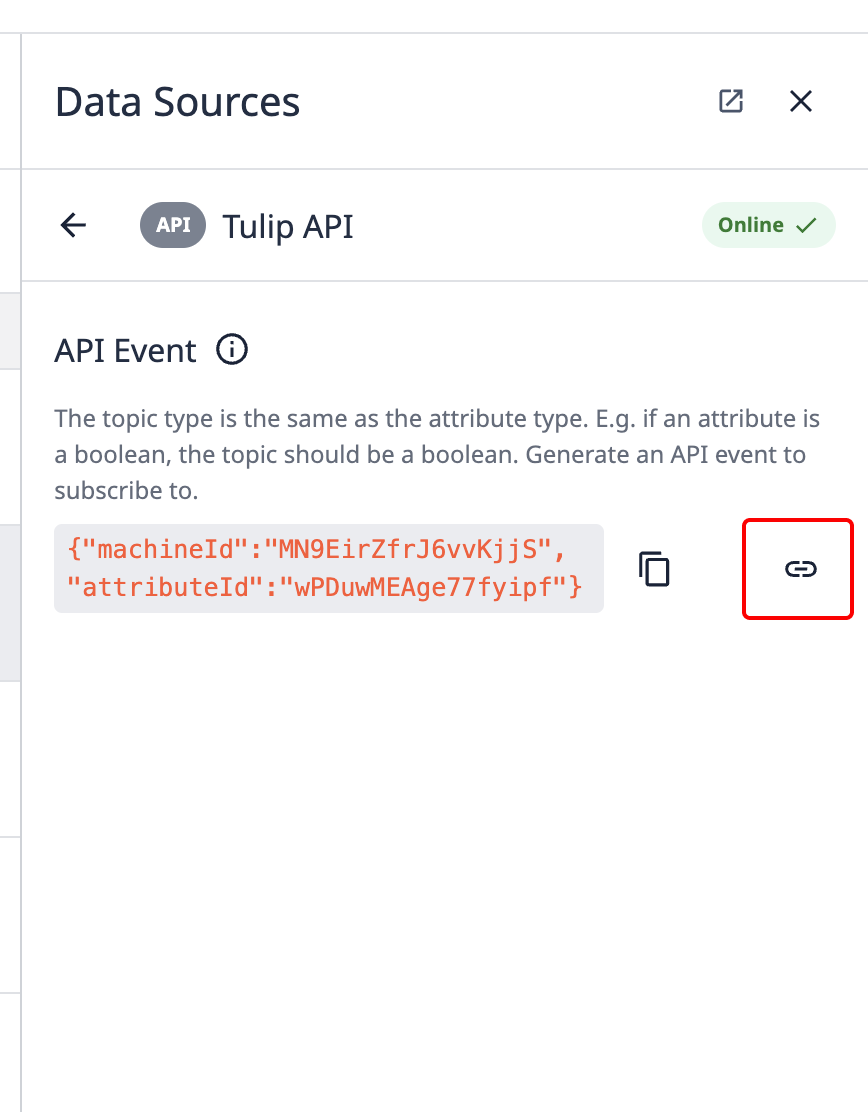
To pass data into a Tulip machine from any other hardware, you can leverage the machines API.
- Select Tulip API from the machine data source selector.
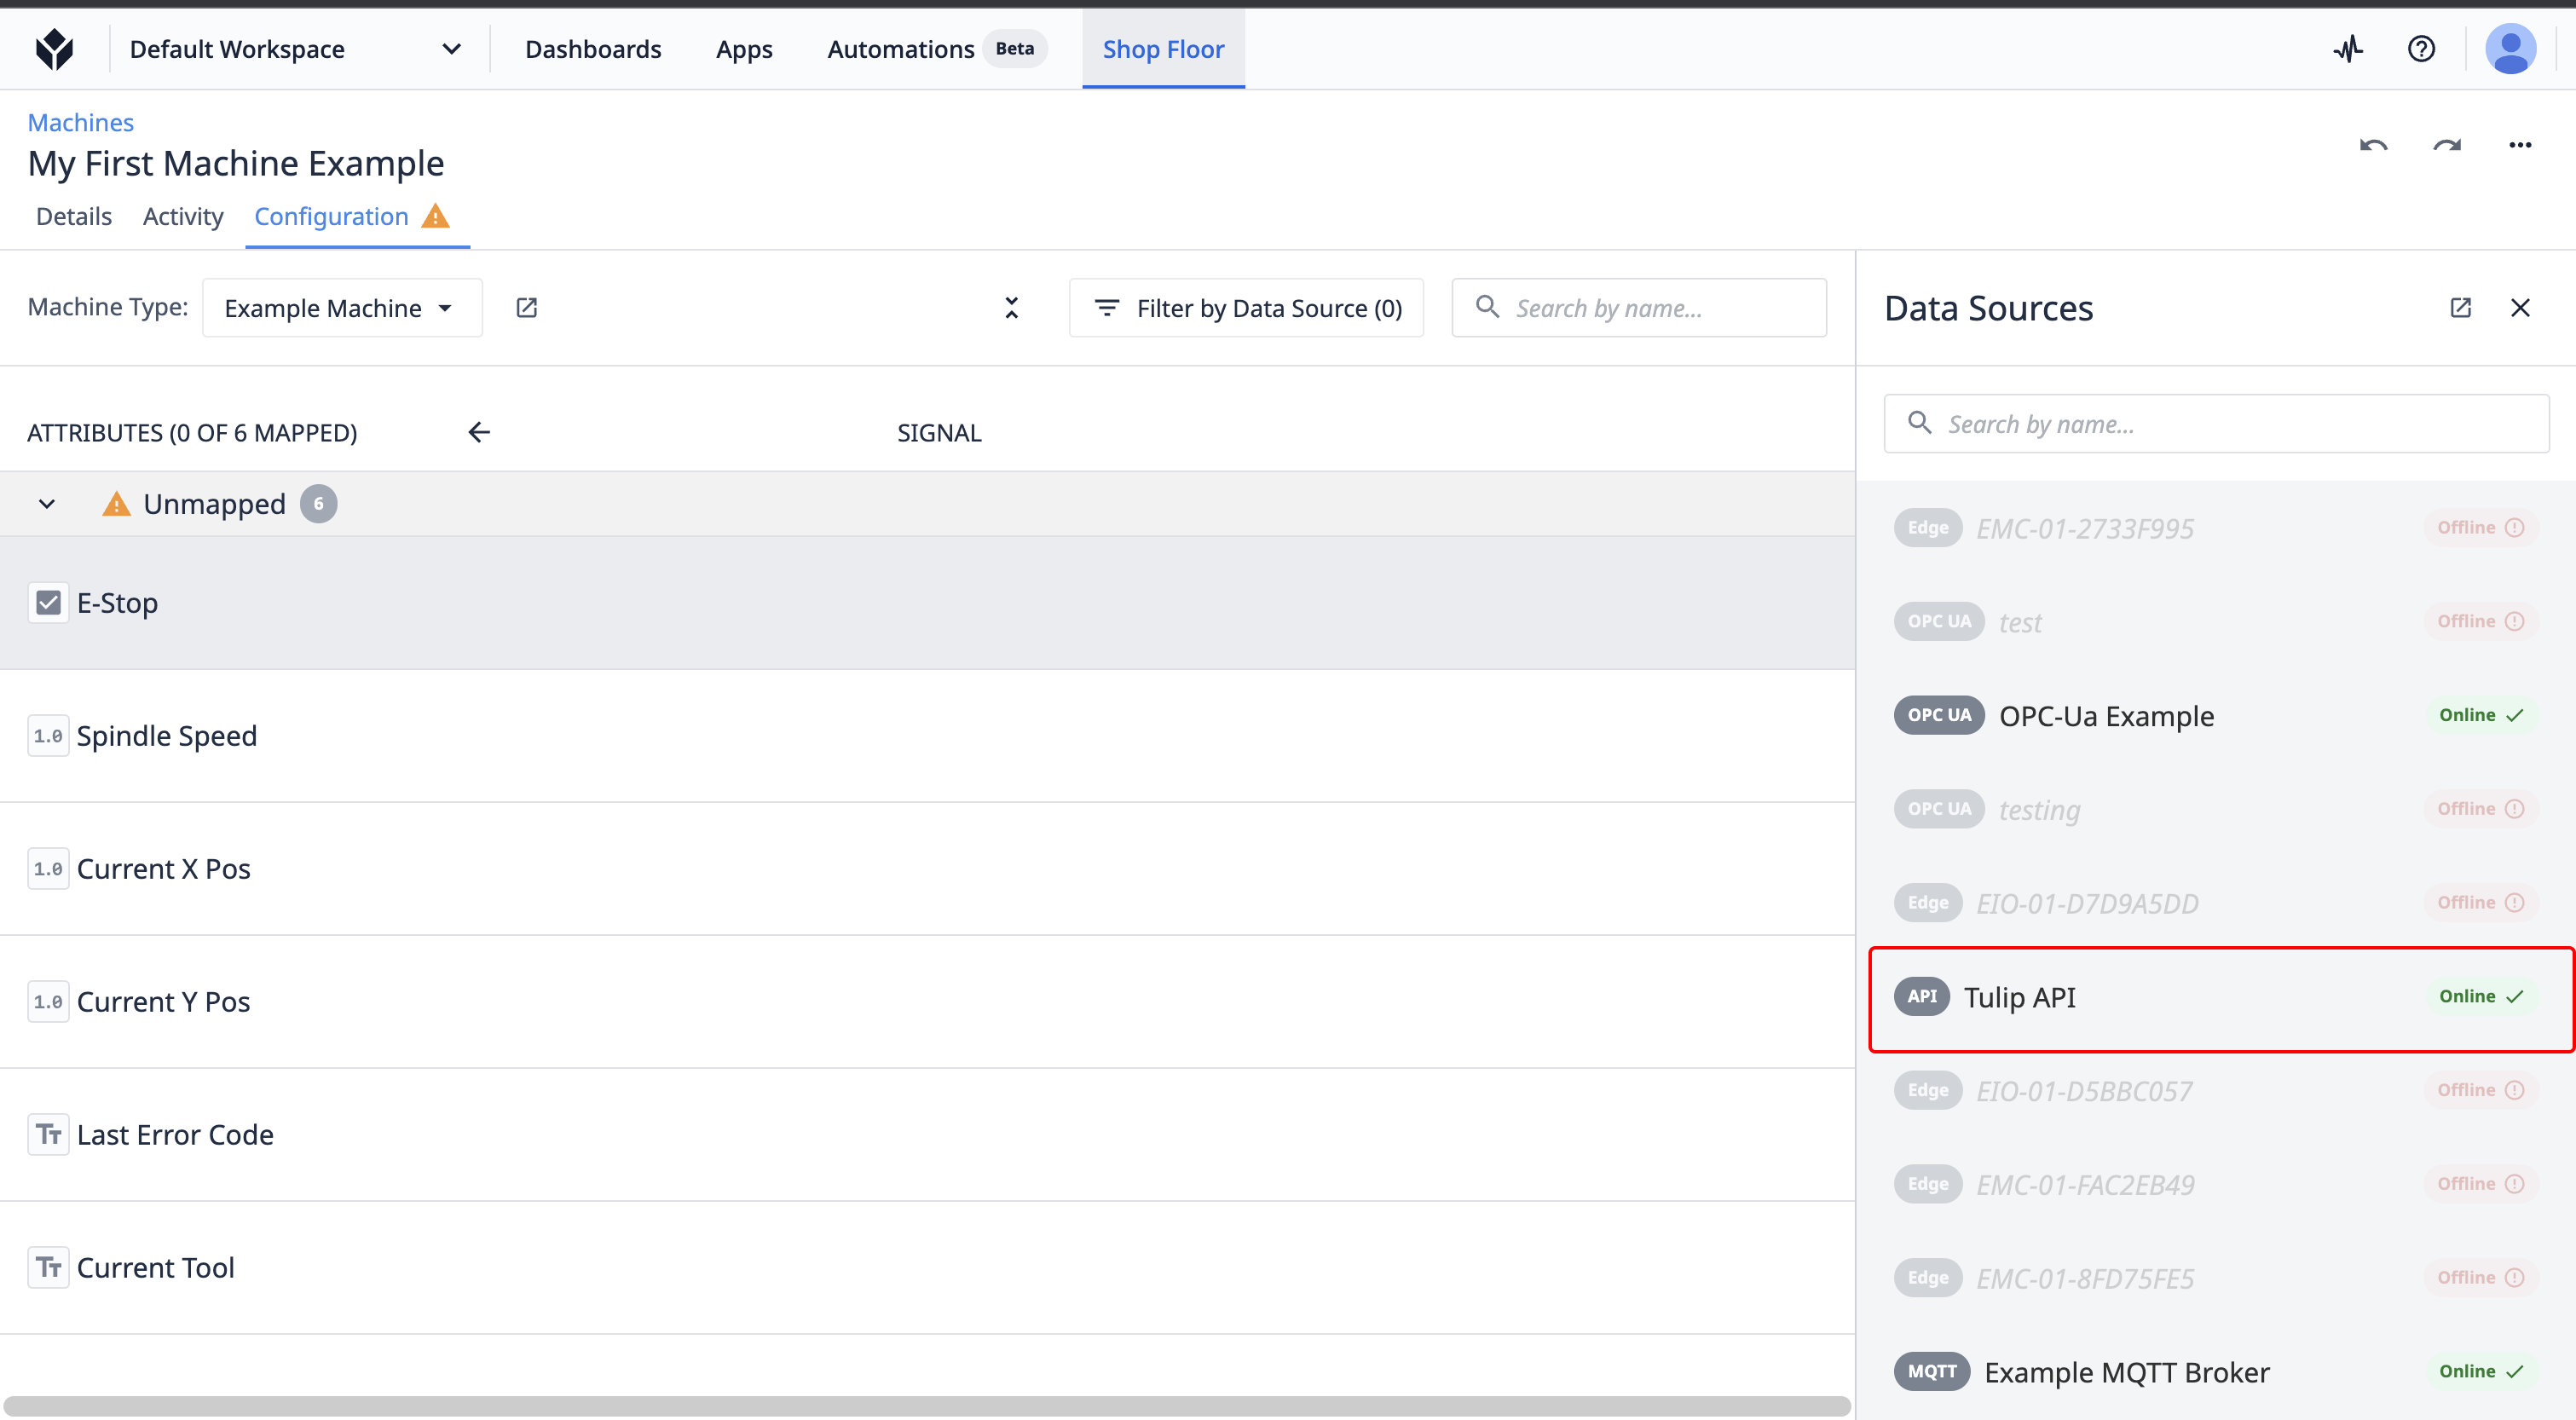
- Select the Map icon to map this machine attribute to a Tulip API endpoint.
Viewing History of the machine
Using Machine Triggers, you will want to map these Attributes to states so that you can accurately track the status of the machine on a second by second basis.
After you set up those triggers, you can see a history of the past machine states using the Activity History tab within each individual machine.
Here's how to access the history:
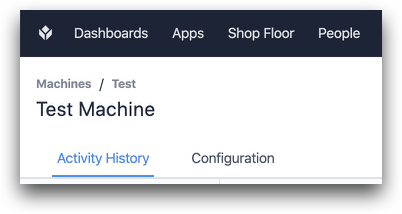
And here's an example of the history:
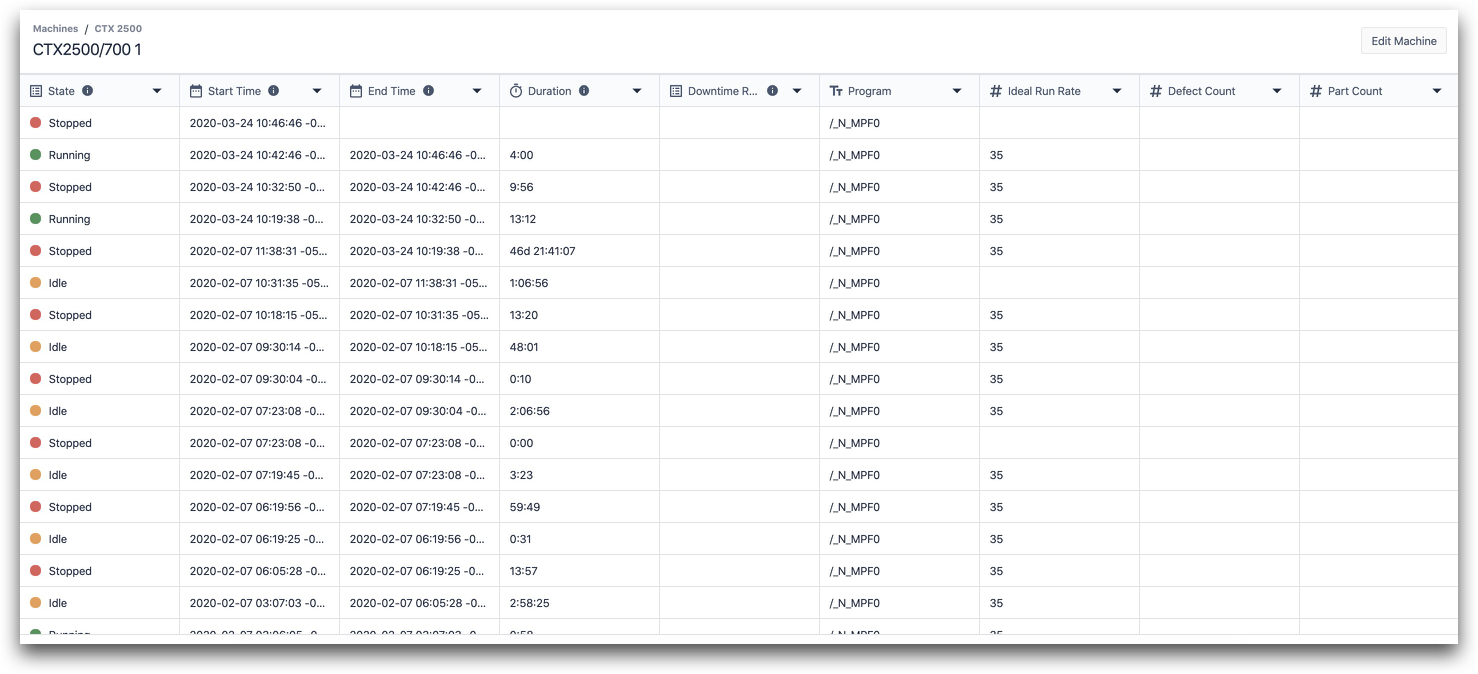
Each row in the history is defined by the amount of time that the machine spent in a certain state.
Here are the columns in this view with data type:
- State (enum)
- Start Time (datetime)
- End Time (datetime)
- Duration (interval)
- Downtime Reason (enum)
- Program (text)
- Ideal Run Rate (number)
- Defect Count (number)
- Part Count (number)
Machine triggers can update the columns for each state based on attributes that you have mapped.
Ingestion limits
The following rate limits are enforced for machine data sources:
| Protocol | Rate limit | Note |
|---|---|---|
| MQTT | 1hz per machine attribute | Events reported immedately |
| OPC UA | 1hz per machine attribute | Tags polled every 1000ms |
| API | No Limit | |
| Overall | 500hz per instance | When combining all types across all machines |
Other machine limits
| Limit | |
|---|---|
| Are there limits to the number of Machines I can configure? | No limit. |
| Are there limits to the number of Machine Types I can configure? | No limit. |
| Are there limits to the number of attributes per machine type? | No limit. |
| Are there limits to the number of Machine data sources? | No limit. |
| What is the timeout for writing a Machine Attribute? | 20 Seconds (Configurable) |
Did you find what you were looking for?
You can also head to community.tulip.co to post your question or see if others have solved a similar topic!


