To download the app, visit: Library
Enable SQDC meetings with a single app
Purpose
The purpose of this app is to help users hold SQDC meetings with just one tool. We've taken out the 'Cost' part of the meeting and added in 'Inventory' and 'Productivity'.
Setup
To configure the app, first you have to set target numbers for each category: safety, quality, delivery, inventory, productivity. These numbers were set randomly in this app. You also have to adjust the default values of each target Variable and update the Analytics: adding your numbers at the reference lines within the analytics.
The app saves the current date and time as Selected Date and Today's Date. On the Status step, you can modify Selected Date. However, steps like Safety, Inventory, etc., use Today's Date, which can't be changed.
Tables Used
The app utilizes two Tables: Performance Metrics and Actions. The Action table is implemented to log different actions, whereas the Performance Metrics table assists in logging the daily meeting results.
How it works
The main step of the app is the Status step. Here, you are presented with a date search Widget and five columns for safety, quality, delivery, inventory, and productivity. Beneath each category, there are two analytics: one displaying the trend and the other exhibiting the recorded number for the selected date. Additionally, each category includes an analytics that showcases the number of open actions.
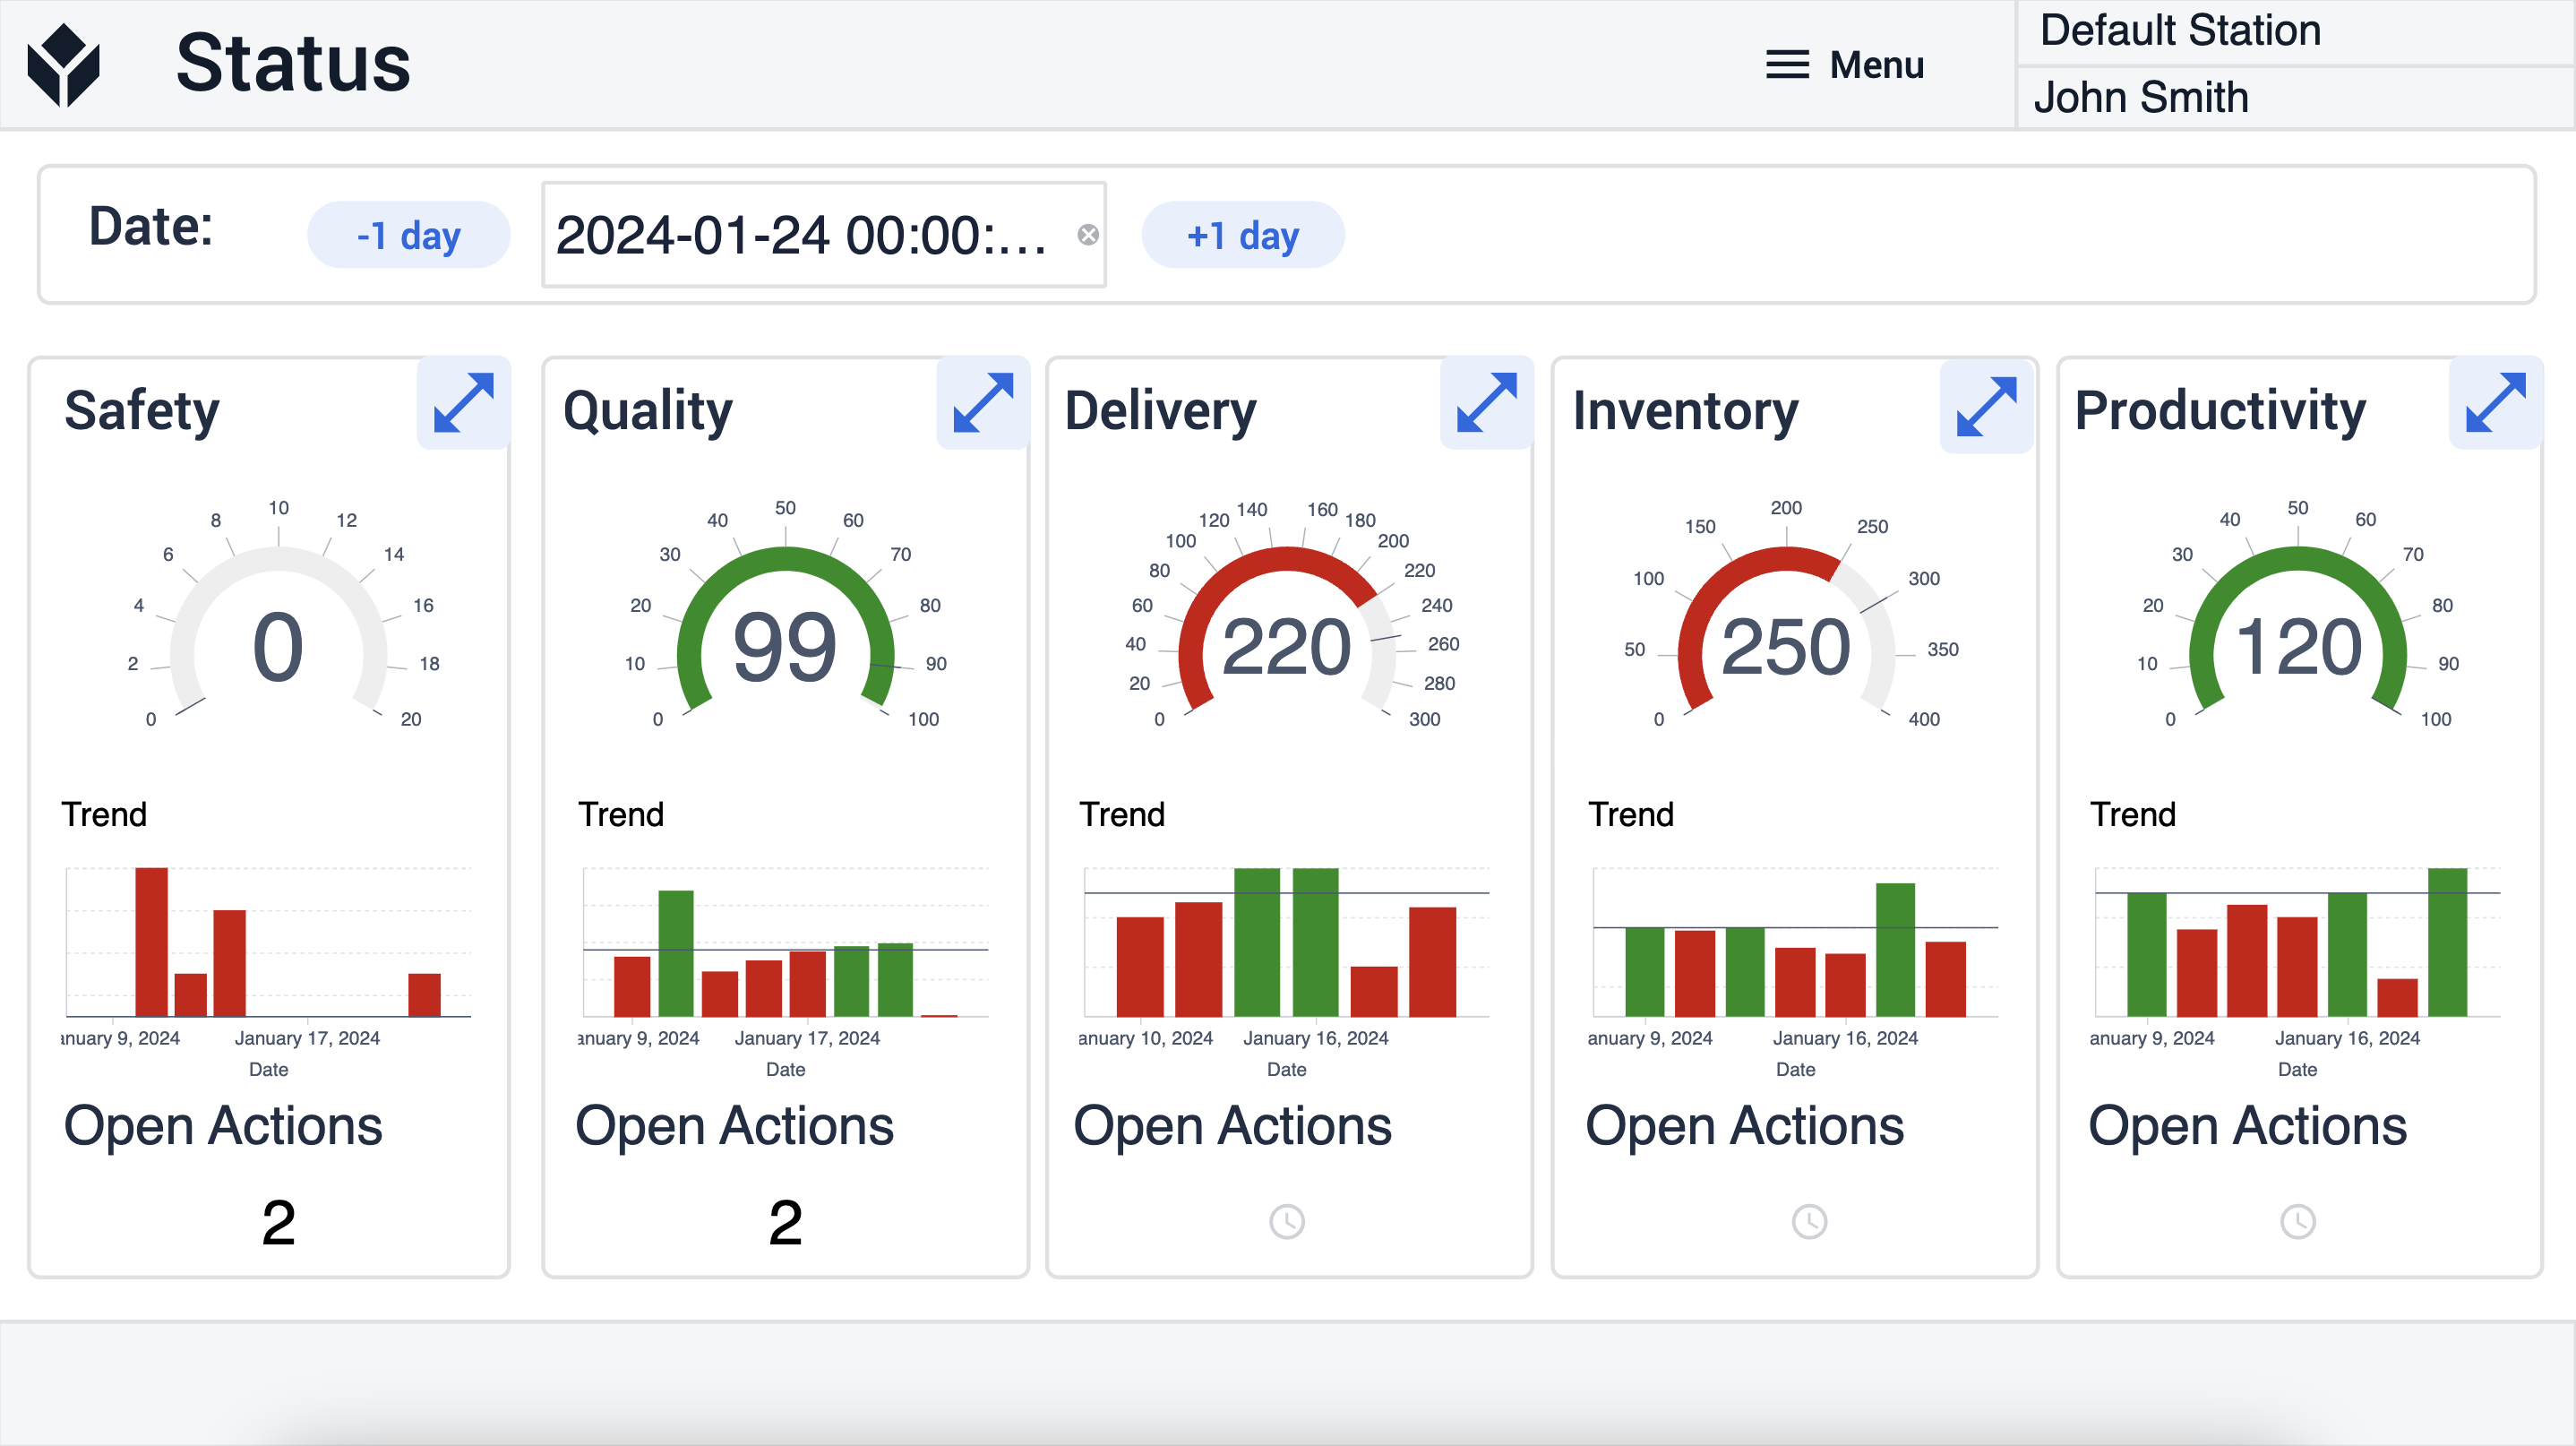
If the user selects a different day, the 'selected date' variable will change, which in turn will affect the analytics. It will reflect the recorded numbers for that selected date.
If the user select the safety's expand button the app will navigate to the Safety's step.
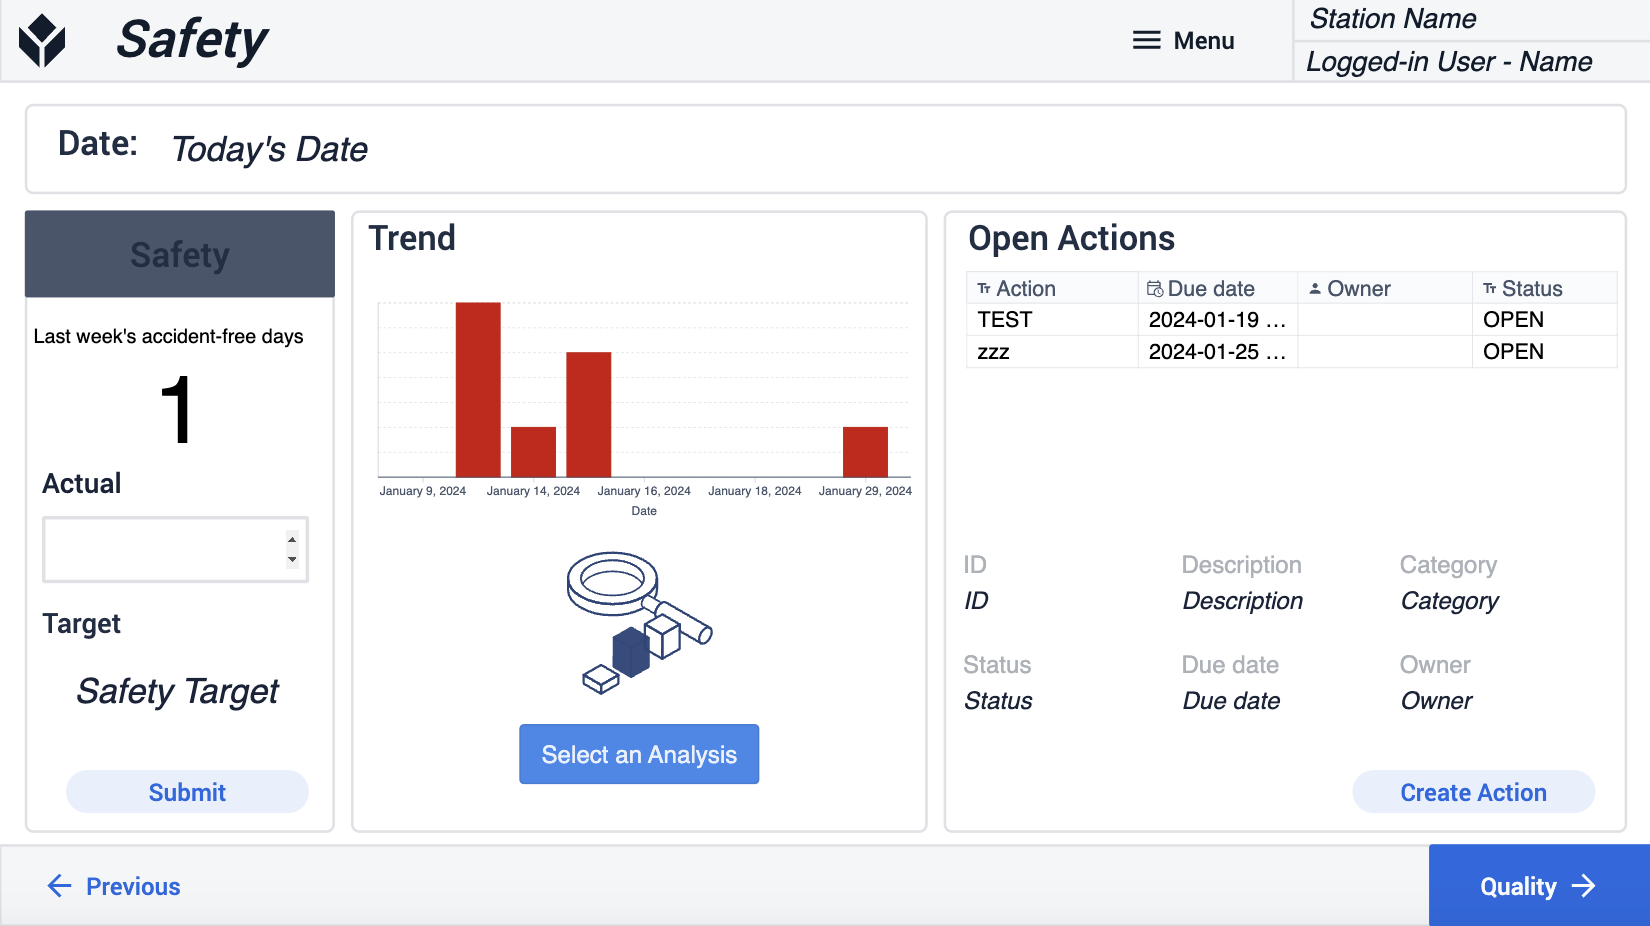
This step is divided into four sections: Today's Date, Log Today's Result, Analytics, and Open Actions. Today's Date, which was created at the start of the app, is presented at the top.
In the Log Today's Result section, you can input a number and click on the Submit button to save this number to the Performance Metrics table.
This logic also includes color changes. It checks whether the reported actual number is higher or lower than the target number. If it doesn't reach the goal, the Safety label turns red; if it does, the label becomes green.
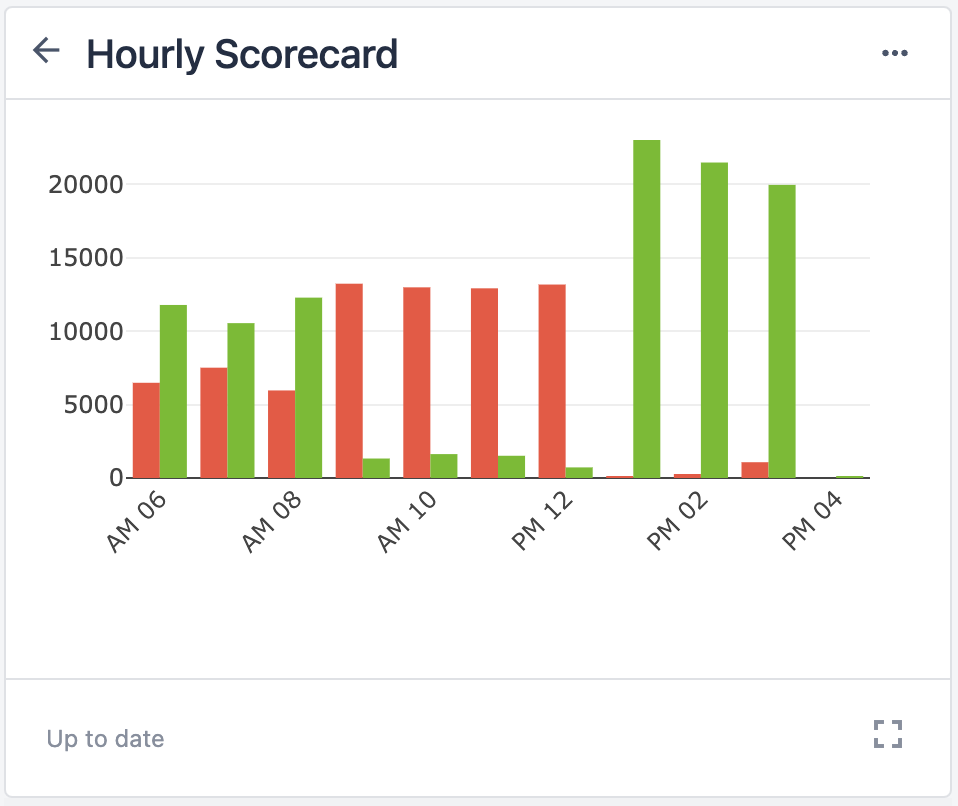
In the Analytics section, you can see the trend on a larger scale. There's also an empty space meant for a Pareto chart, allowing you to create a chart that best suits your operations.
In the Open Actions section, all open actions related to the safety category are displayed. By selecting one from the table, you can view its details beneath the table.
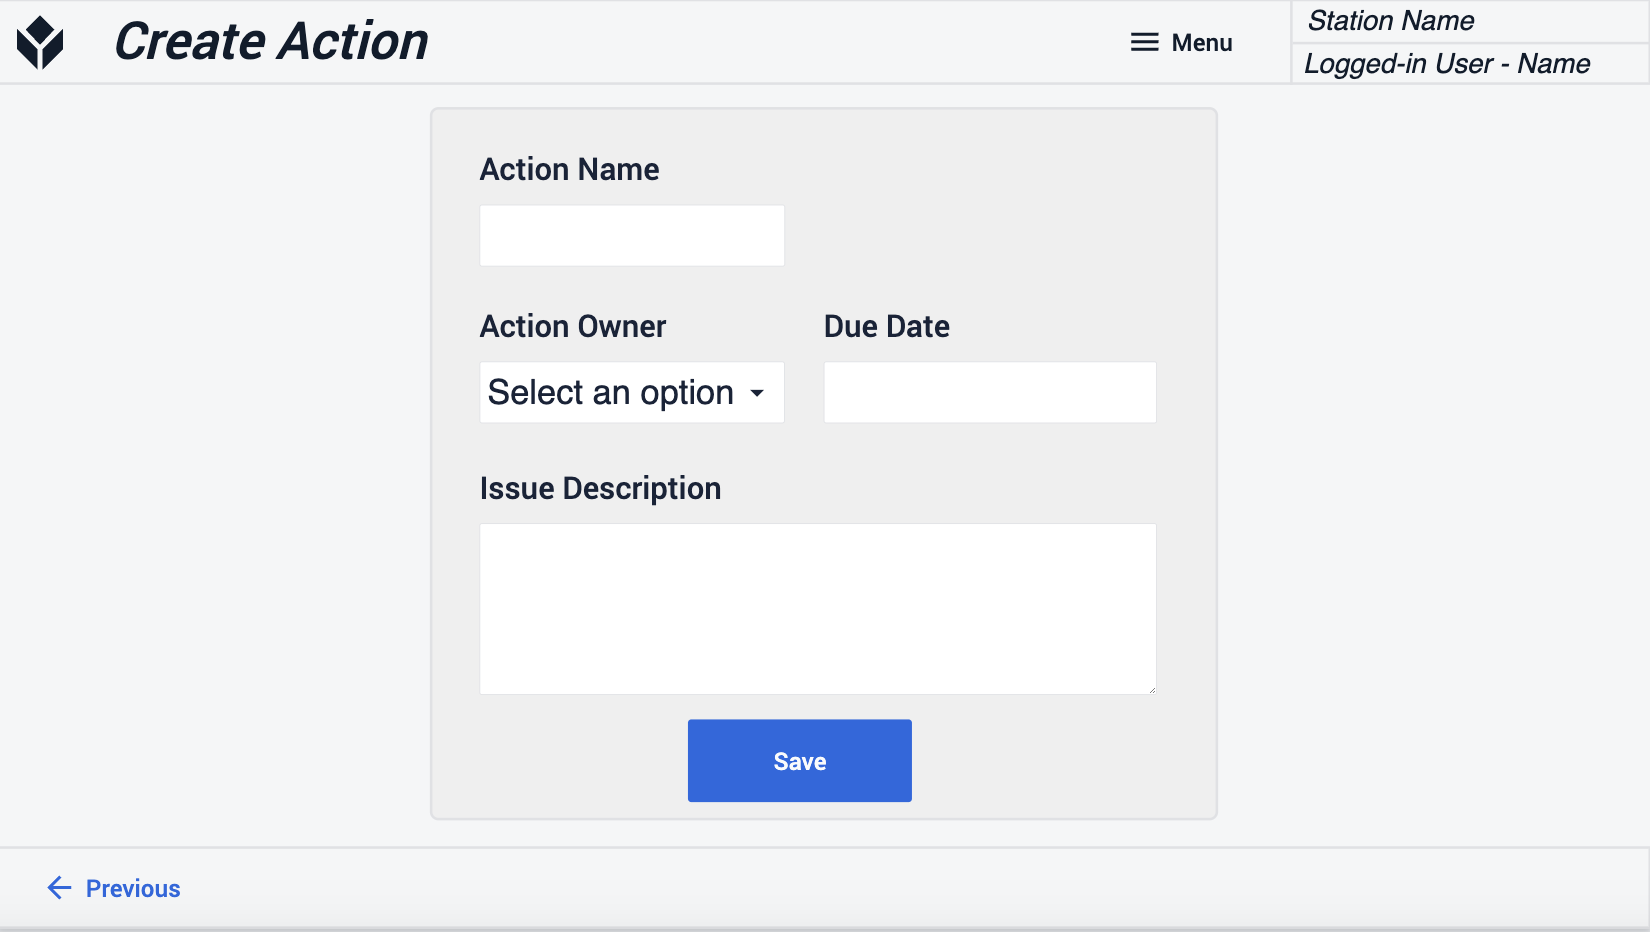
Additionally, you have the option to create new actions by clicking on the Create Action button.
The app will navigate to the Create Action step where you can create new actions.
The remaining category steps have the same structure as the safety one.
.gif)