


Analyses are dynamic visualizations of the data that your operations create. Leveraging analyses can enable KPI-driving improvements within minutes, instead of days of weeks.
Analyses can drive insights from all the different data sources in Tulip:
- App Completions
- Table Data
- Machine Data
Analyses automatically update so the insights just keep coming!
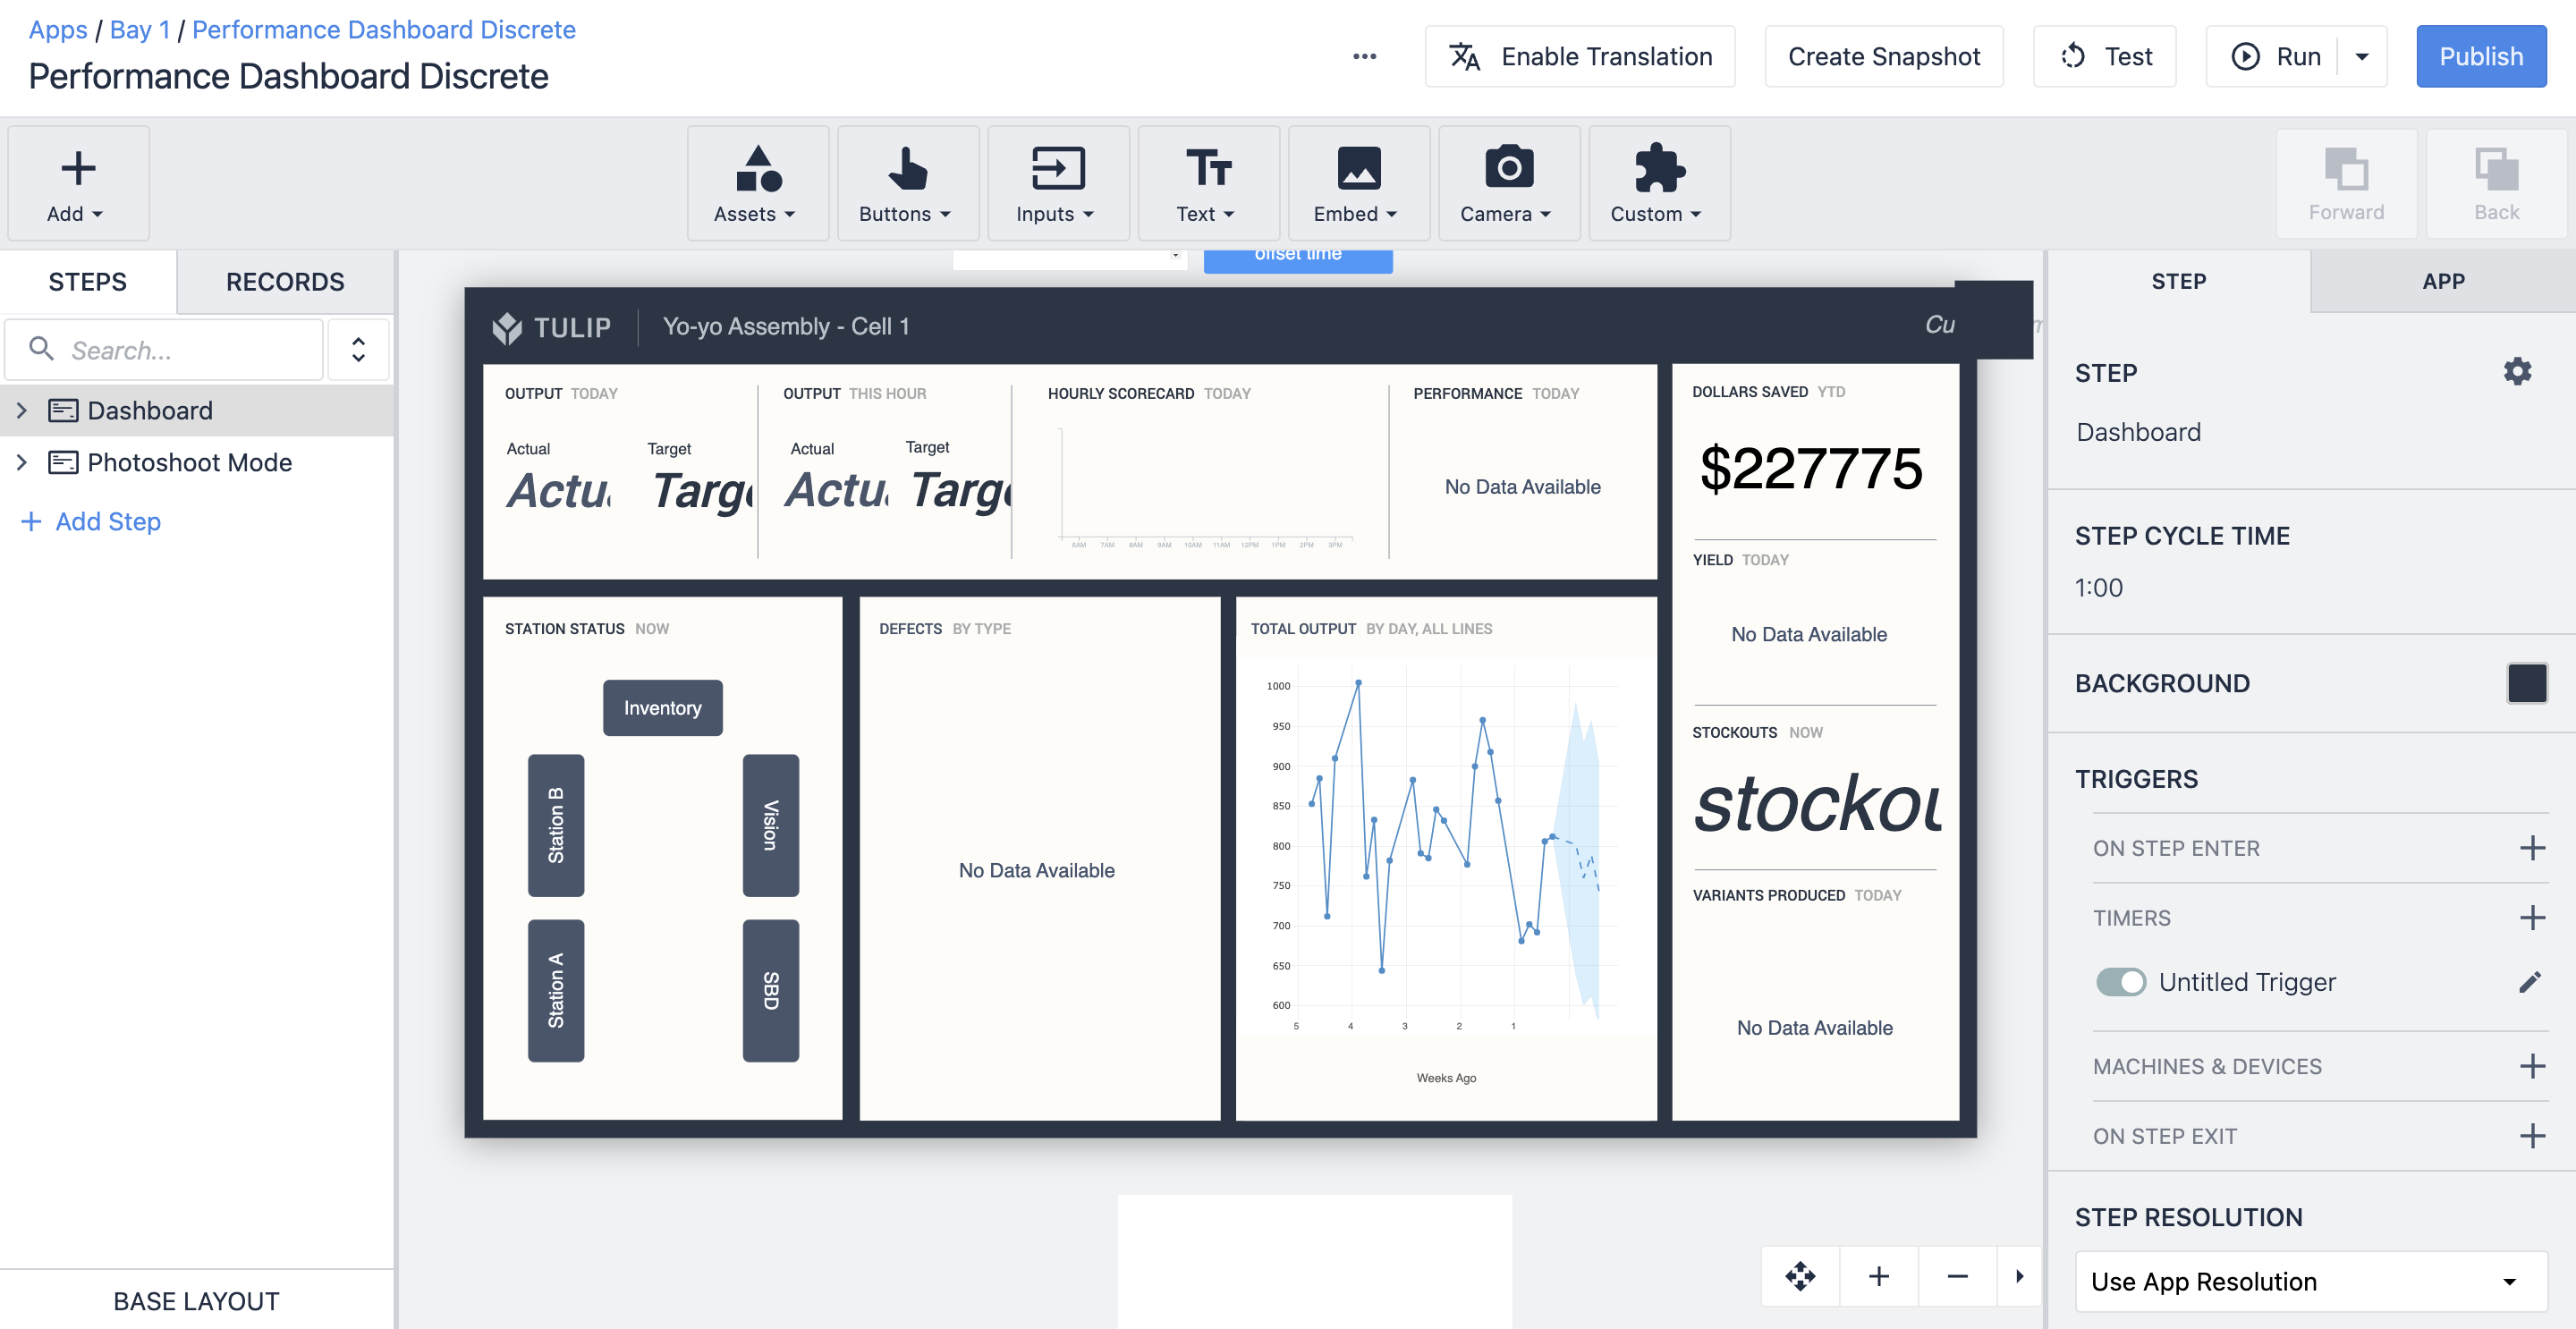
In apps
Analytics can also be embedded within applications to further the discoveries for your operators. Game-ify your operations by displaying for the metrics your users are being expected to maintain.
Embedded Analytics further enrich the Tulip experience by enabling dynamic filtering of the data that matters for your operators.
Learn more about how to add an analysis to an app step here.
Share an analysis
If you want to share a single analysis, you should find the analysis you want to share in a dashboard or in the App Summary view. Click the gear icon, and select Share.
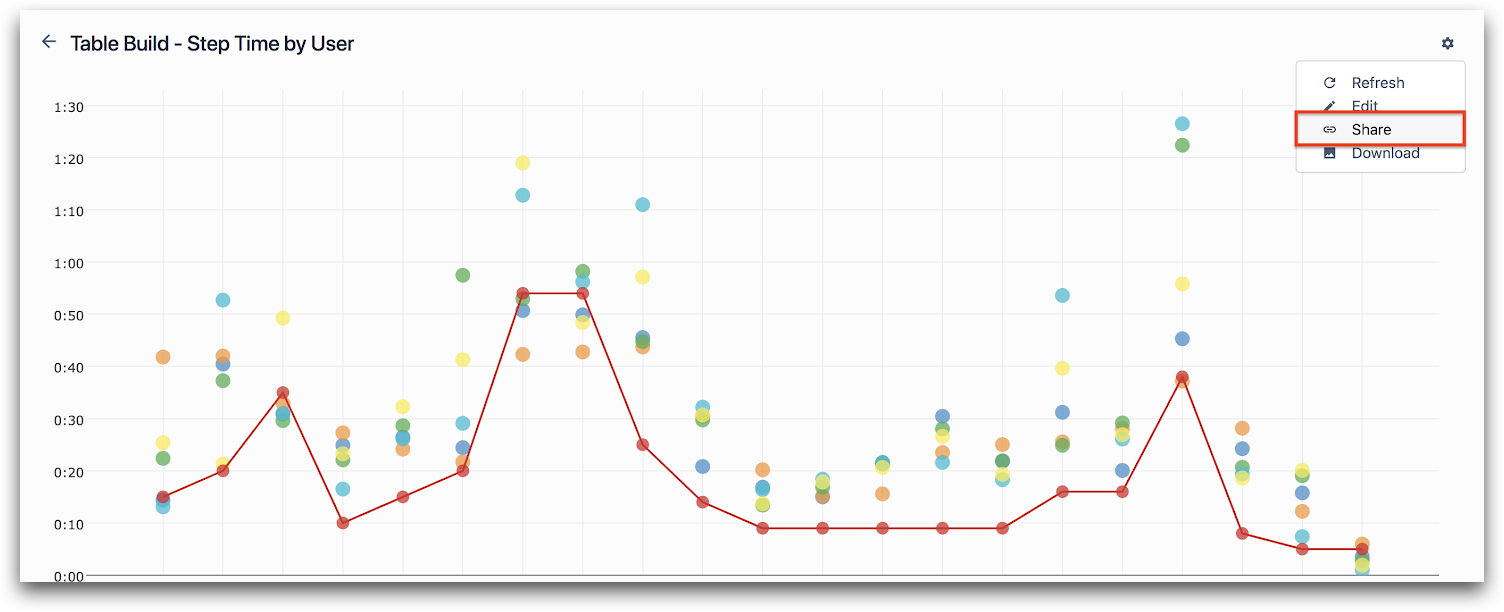
You can also use the Sharing menu at the top of the Analytics Editor.
The sharing link only grants access to the shared analysis and does not allow unauthenticated users to modify the analysis or access any other part of Tulip.
However, if you happen to visit the shared analysis link while logged into Tulip, the system will automatically show you various editing options that will disappear when you log out.
If you want to stop sharing the analysis, click the Share button, and then select Stop Sharing.
Note that this will immediately and permanently disable the shared link. Anyone who has the shared analysis open will be redirected to a “Shared Analysis Not Found” page. If you choose to share the analysis again, it will create a new link. The old link will not work again once disabled.
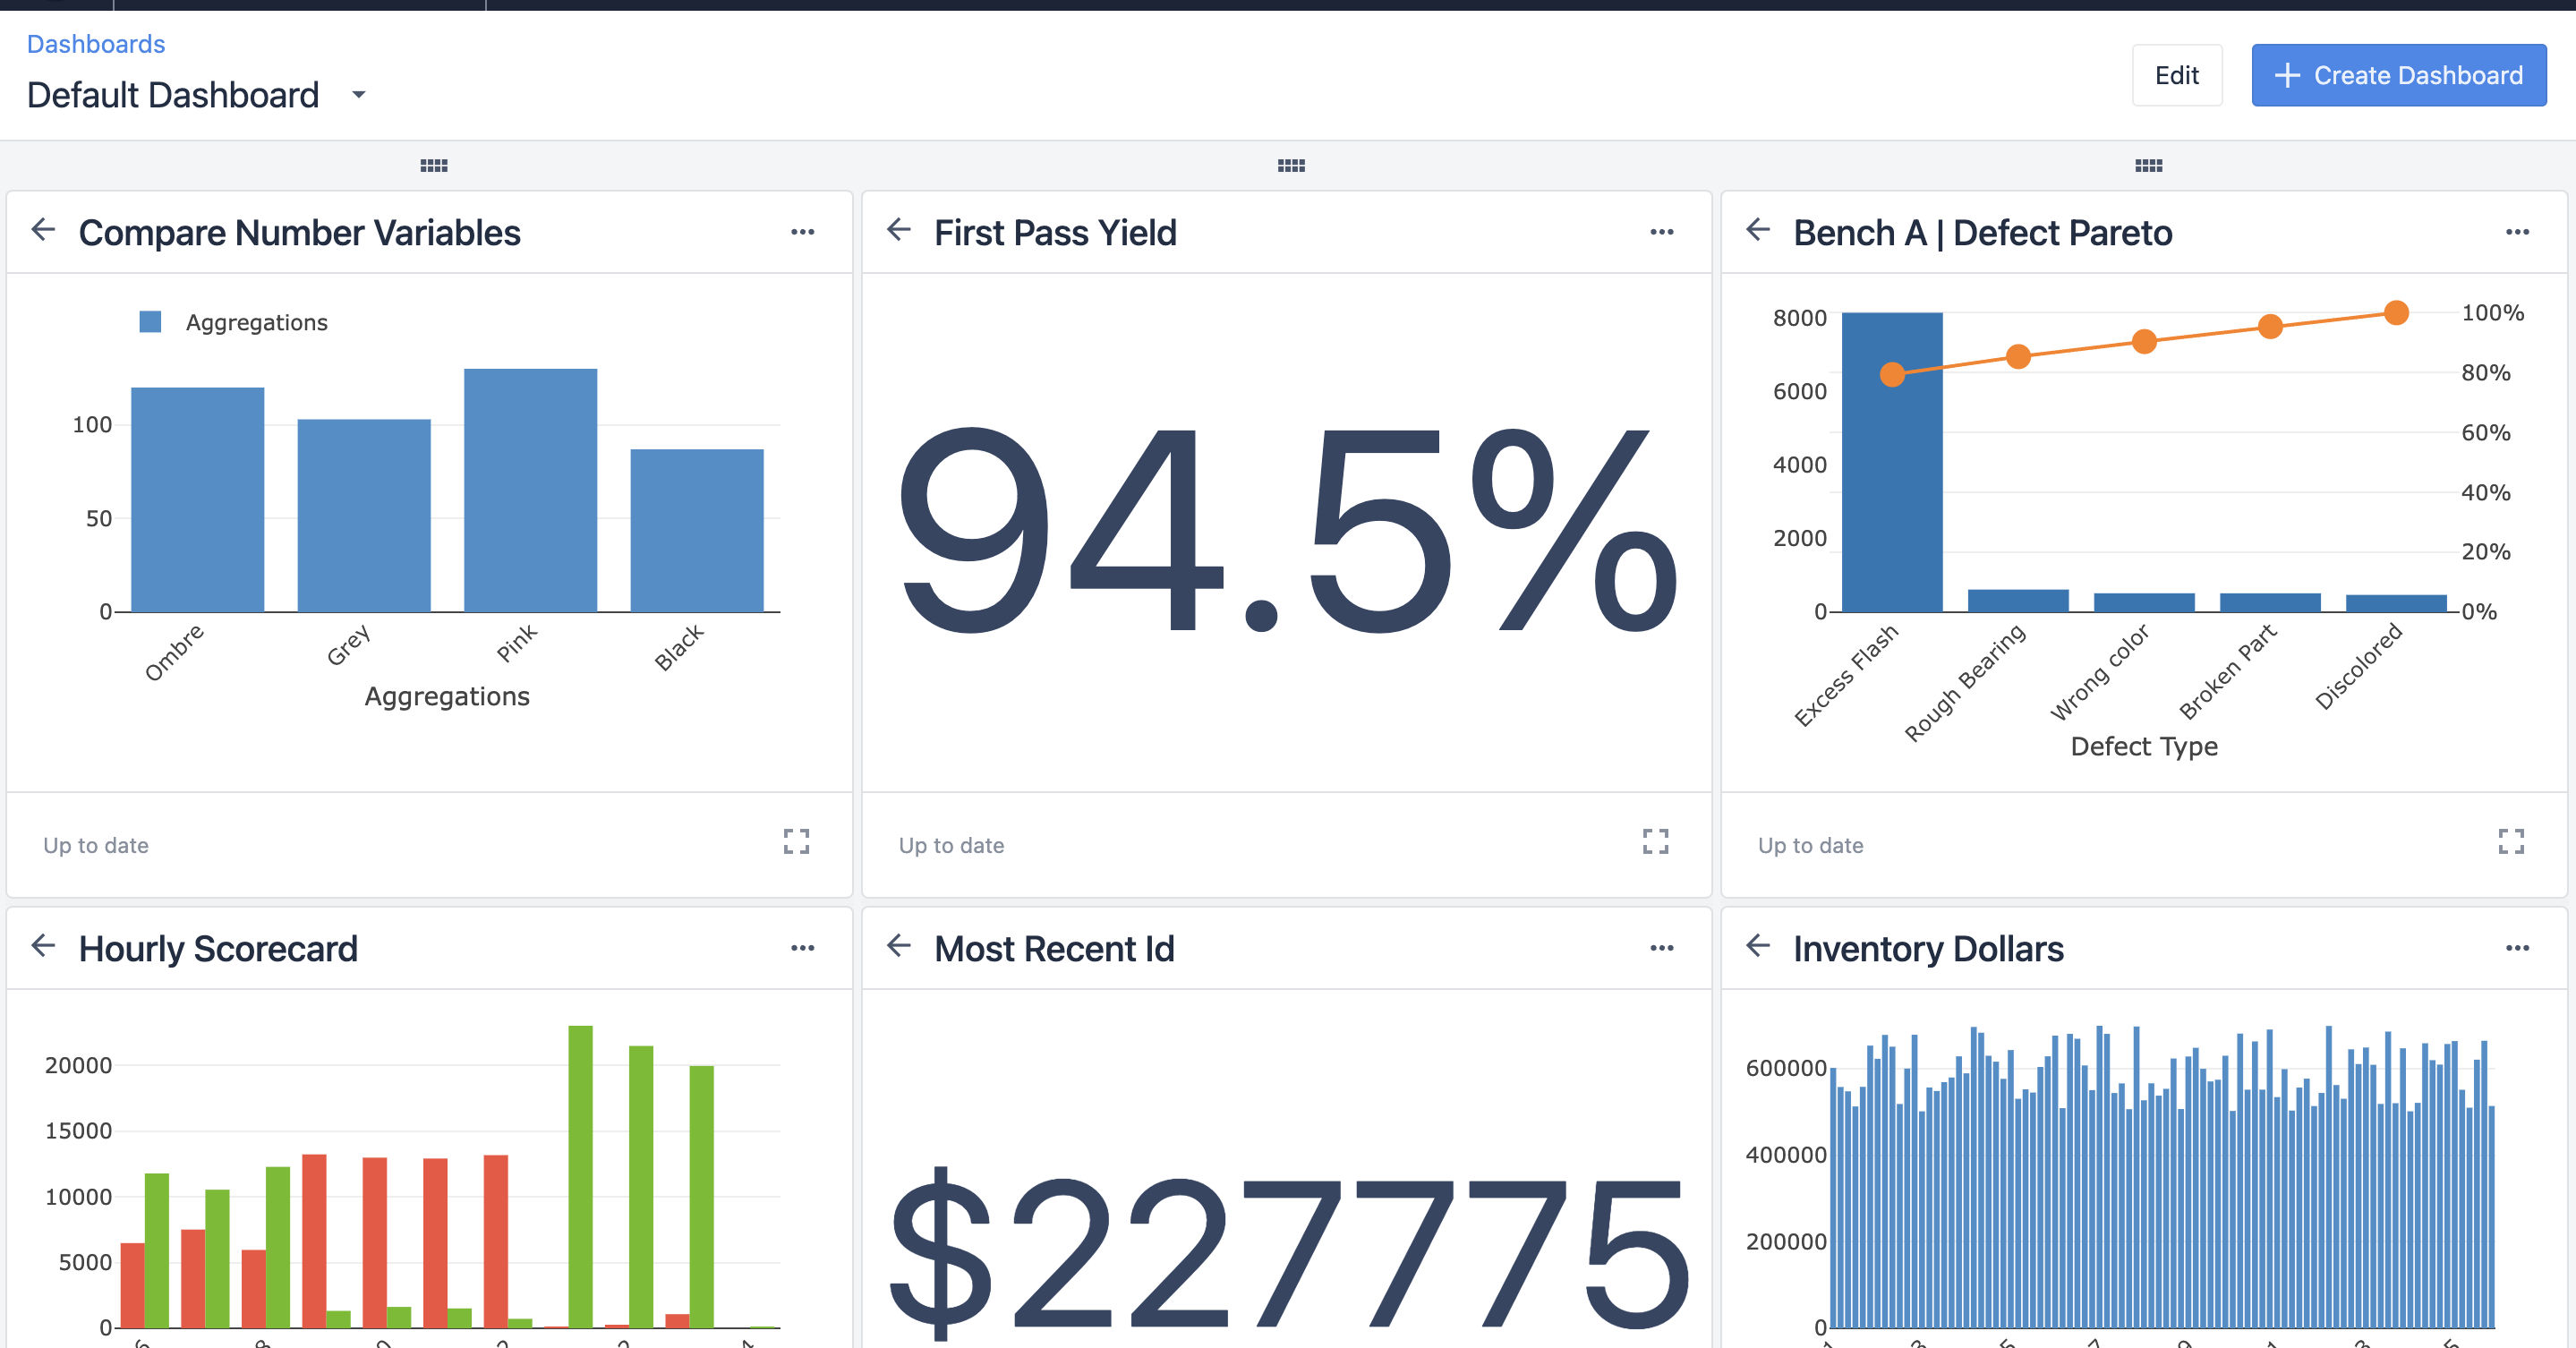
Dashboards
Dashboards are groupings of analyses. Often one metric doesn't represent success or failure, but instead a group of analyses are needed to illuminate your process performance.
Learn more about dashboards here.
Limits
| Limit | |
|---|---|
| Minimum refresh rate | 5 Seconds |
| Chart layers per analytic | See here |
.gif)