To download the app, visit: Library
This article provides a summary of how the Tables and applications that make up the Table-Based Work Instructions templates are structured and built.
Work instructions are documents that clearly and precisely describe the procedures and tasks for operators on the shop floor. It describes individual procedures of the work process and the tasks that make them up.
Tulip’s digital work instruction templates enable the logging of Completion data (defects, defect reasons, number of output units ect.) effectively. It also provides Analytics of this data to make the planning and optimization of the work process easier.
Tulip provides App-based Work Instruction templates, which don't depend on any Tables and use only variables to hold data, and Table-Based Work Instruction templates. In the latter, the detailed descriptions of both the procedures and the tasks are stored in Tulip Tables.
These tables can support a workflow with complex or dynamically changing procedures and provide transparent documentation of them.
Tulip Tables Used
The Table Based Work Instructions templates are based on three tables: Procedures, Tasks, and Paramaters. The relationship between these tables is formed by Linked Records.
Each record in the Procedure table is a procedure, that has its own ID, description, and type. To all the Procedures, one or more Tasks are linked from the Tasks table. These tasks also have their IDs and descriptions, in addition, we can add several different attributes to them. Similarly, one or more Parameters can be linked to each task. These parameters are defining exactly how the operator should execute the task.
Fields of Procedure table
- ID: a unique text ID for each procedure
- Description: the name of the procedure
- Type: the category of the procedure
- Task: this is a linked field where each record contains all the task IDs form the Tasks table
Fields of Tasks table
Required fields:
- ID: a unique text ID for each task
- Description: the name and the description of the task
- Procedure: this is a linked field where a procedure links to each task
- Guidance photo: an image illustrating the task
- Task number: the Integer number of the given task in a series of tasks within a procedure
Optional fields:
- Type: the category of the task
- Equipment: The list of equipment needed to execute the task
- Expected time: The expected time to complete the step or task, also known as the cycle time
- USL: If the step requires a measurement, this is the upper spec limit
- Target: If the step requires a measurement, this is the nominal target
- LSL: If the step requires a measurement, this is the lower spec limit
- Parameters: this is a linked field where parameters link to each task
Fields of Parameters table
- ID: a unique text ID for each parameter
- Setting name: the feature of the task
- Value: the value of the feature stored in setting name
- Task: this is a linked field to store the task ID of the task to which the paramterer applies
Creating the tables
When any of the Table-Based Work Instructions applications are downloaded to an instance, the tables used in the applications are created int he same instance; however, they will be empty. To populate the Tulip Tables, use the Table Creator application.
In the application the user can:
- Add new procedures in to the Procedure table
- Edit existing procedures
- Add new task to a procedure
- Edit an existing task
- Re-order the task in a procedure, by changing the task numbers of the tasks
- Add parameters to tasks
- Edit existing parameters
When you select any of these actions in the main step a side editor window will appear where you can execute the selected action.
For example, if you choose to edit a task, this step will appear, where you can edit the field for your choice and click Save.
Apps
One task per step
Link to app:
This is the simplest-table based work instructions template. The user selects a procedure from an interactive table and on the following steps the app displays the sequence of tasks in the selected procedure. During the execution of the task, the operator can log any possible defects with defect reason and can add notes containing the details of the defect. After all the tasks the user can select the number of outputs and save completion data. The analytics from the completion data can be viewed at any time while using the app.
Application structure
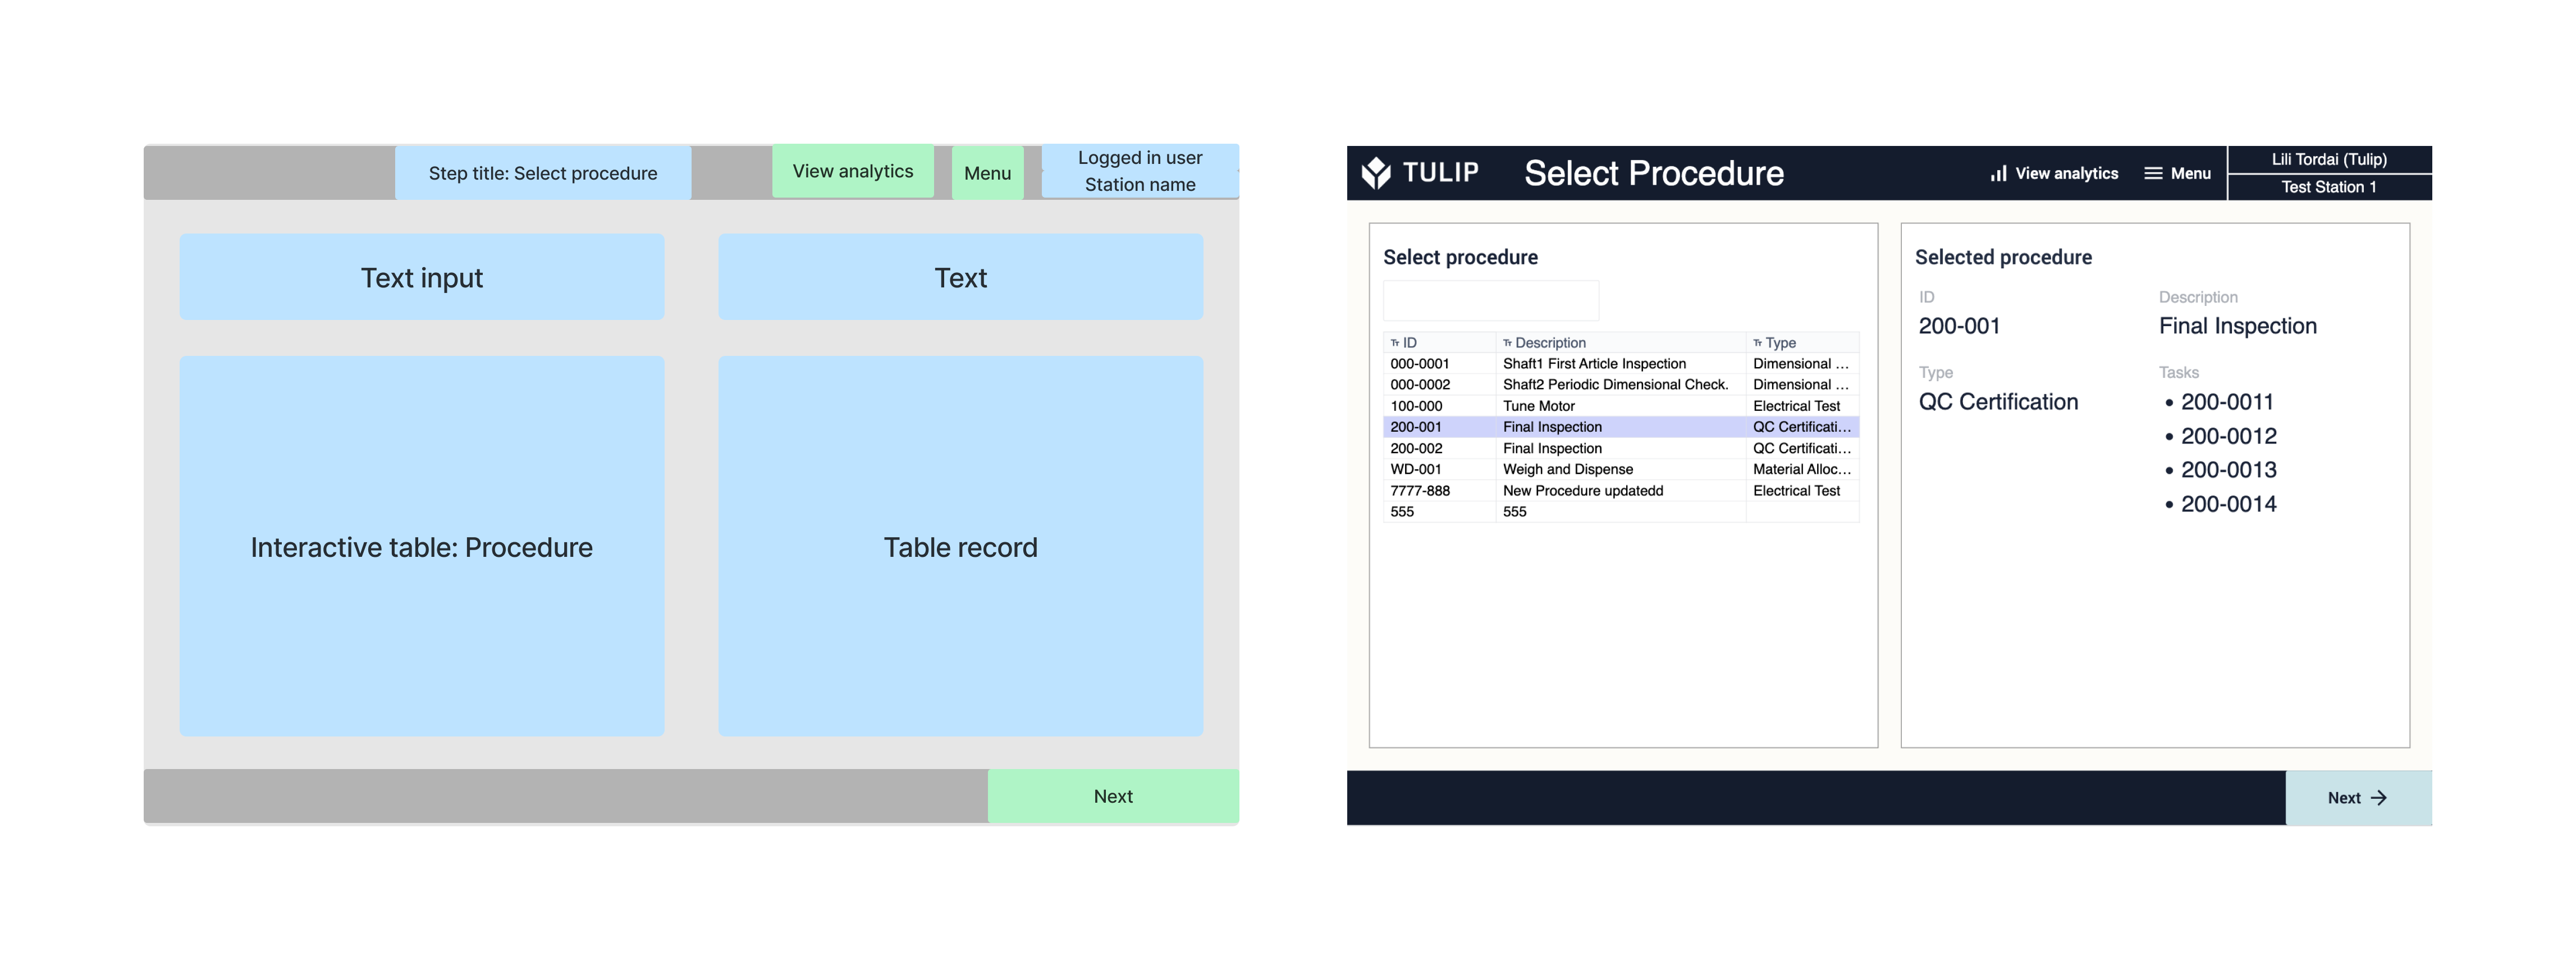
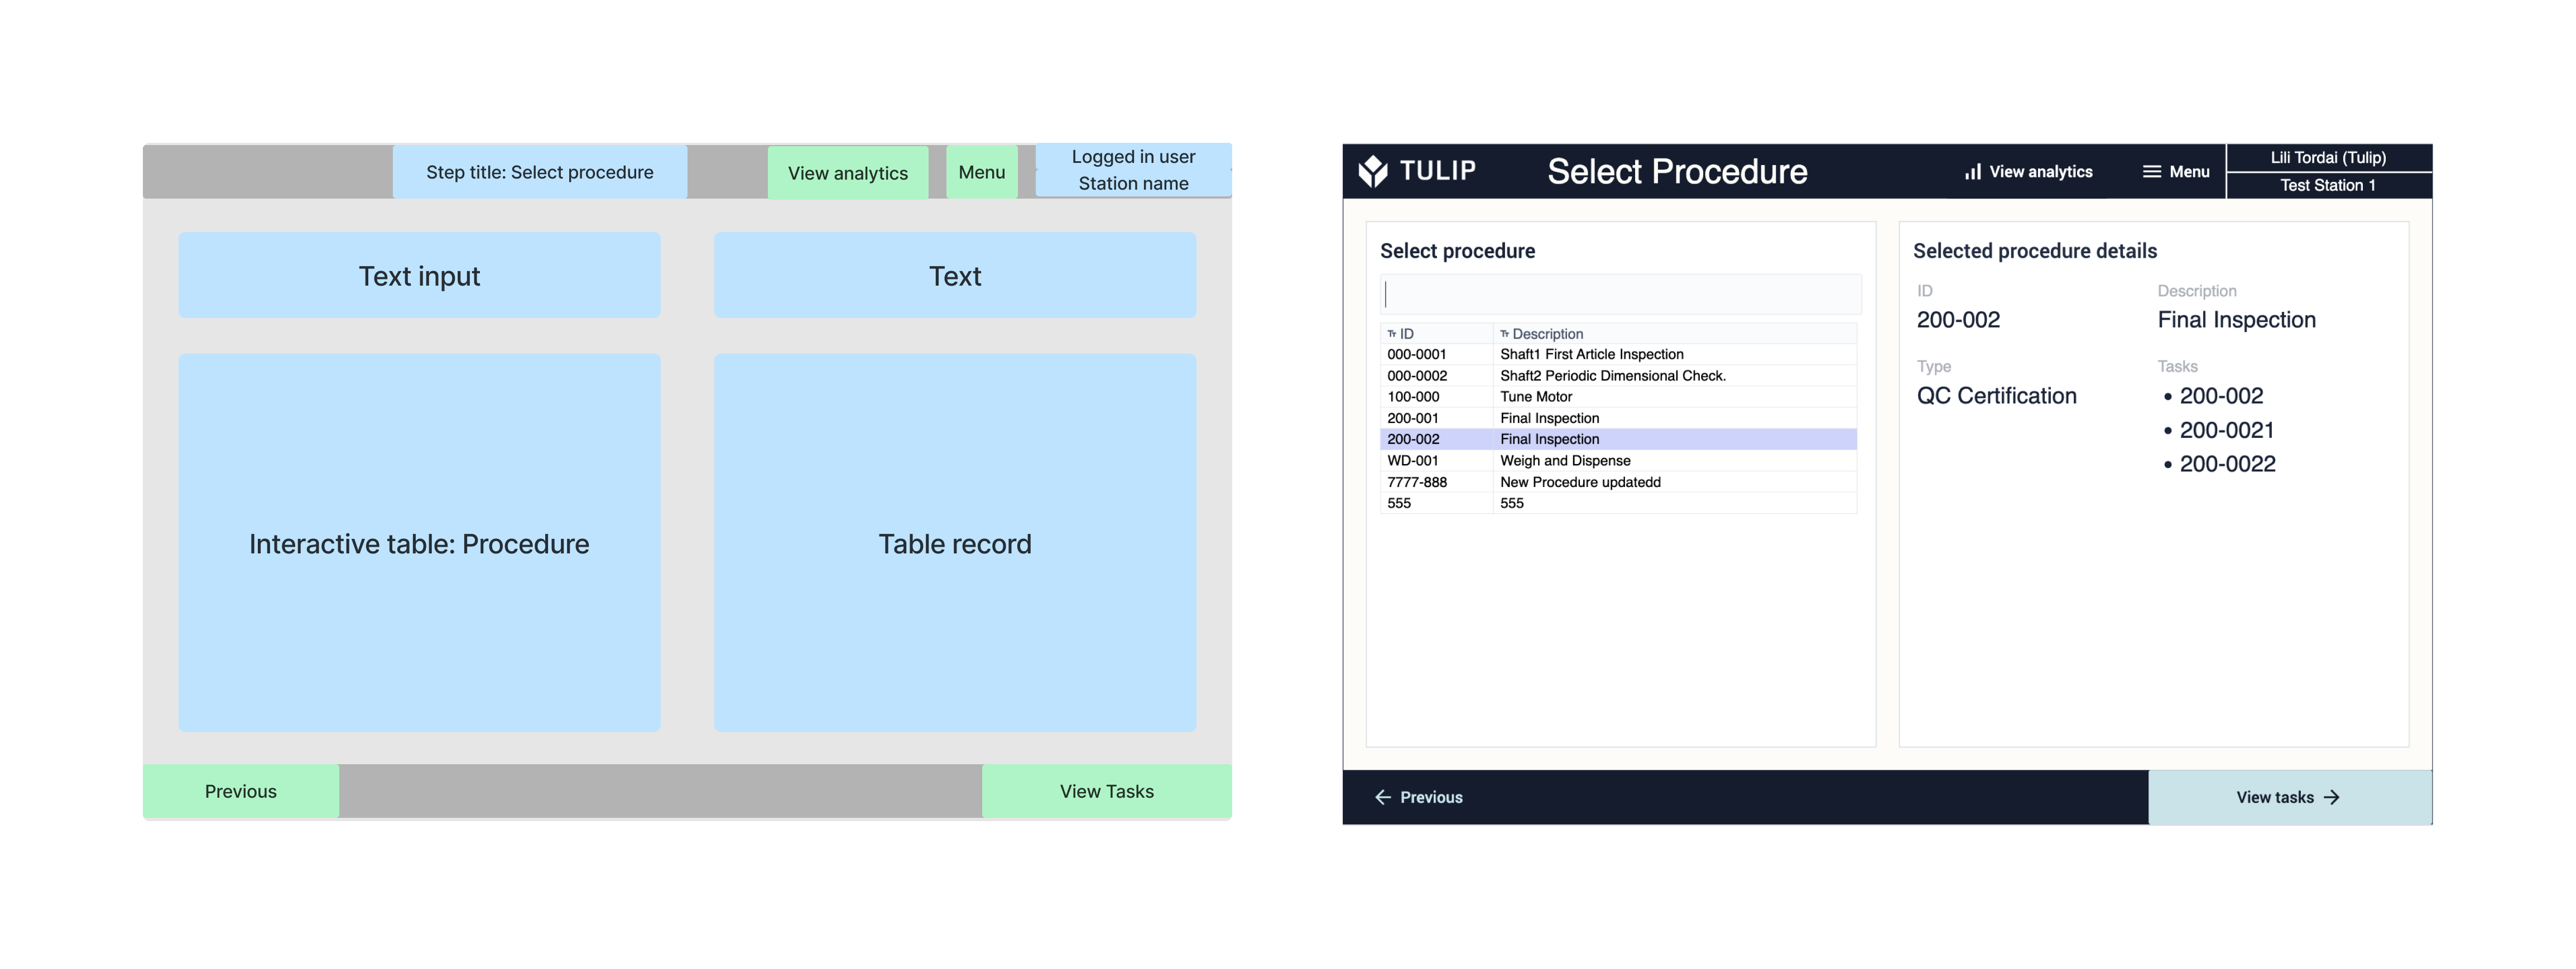
On step Select Procedure, the user can select procedures from an interactive table and display it’s details.
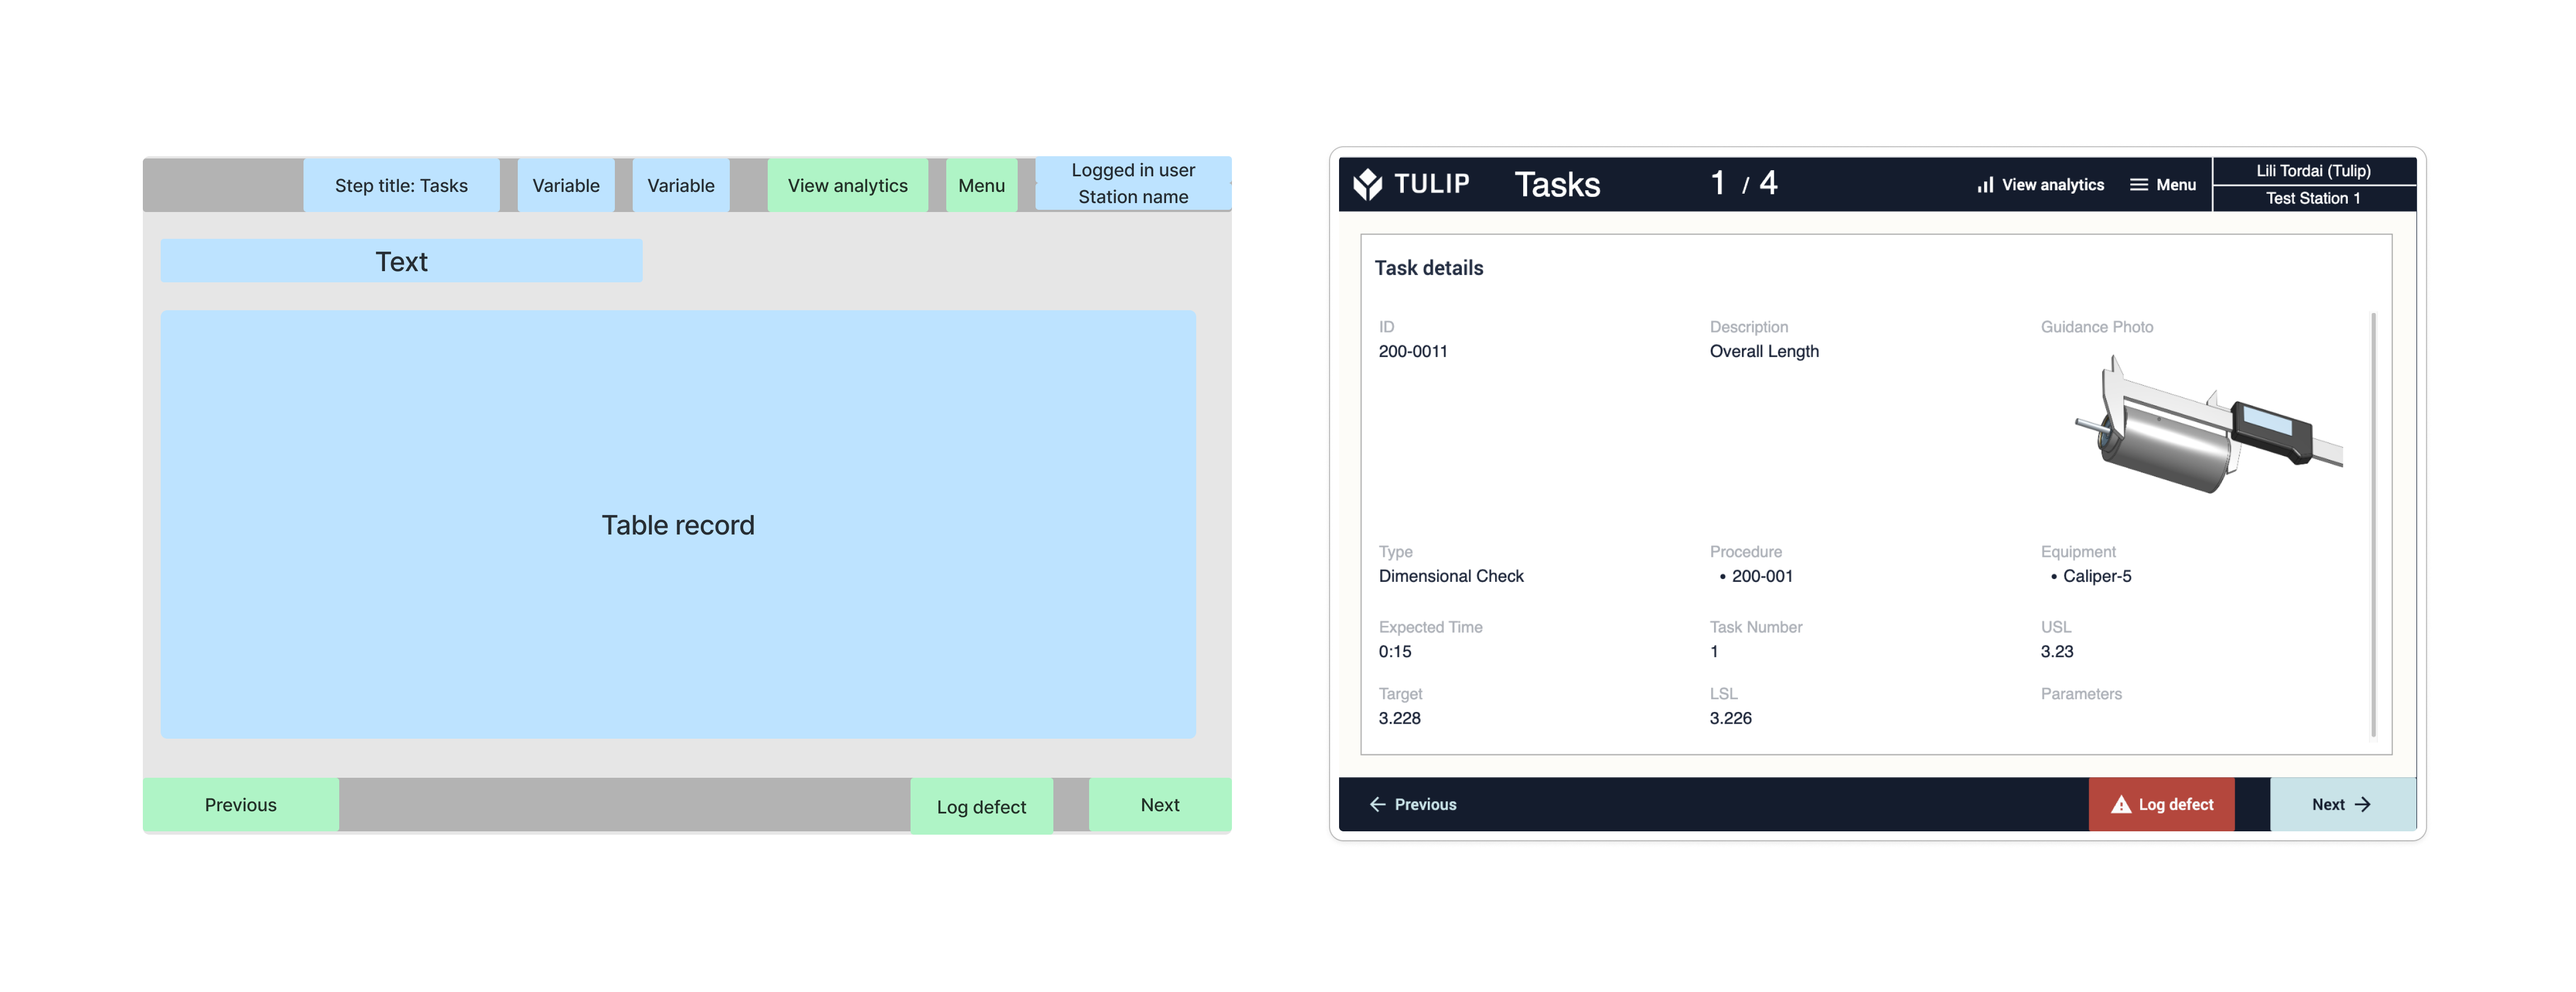
On step Tasks the user can iterate through all the tasks belonging to the selected procedure. As long as they are further tasks to display, the task number is incremented when the next button is clicked. The next task is queried based on the selected procedure and the task number.
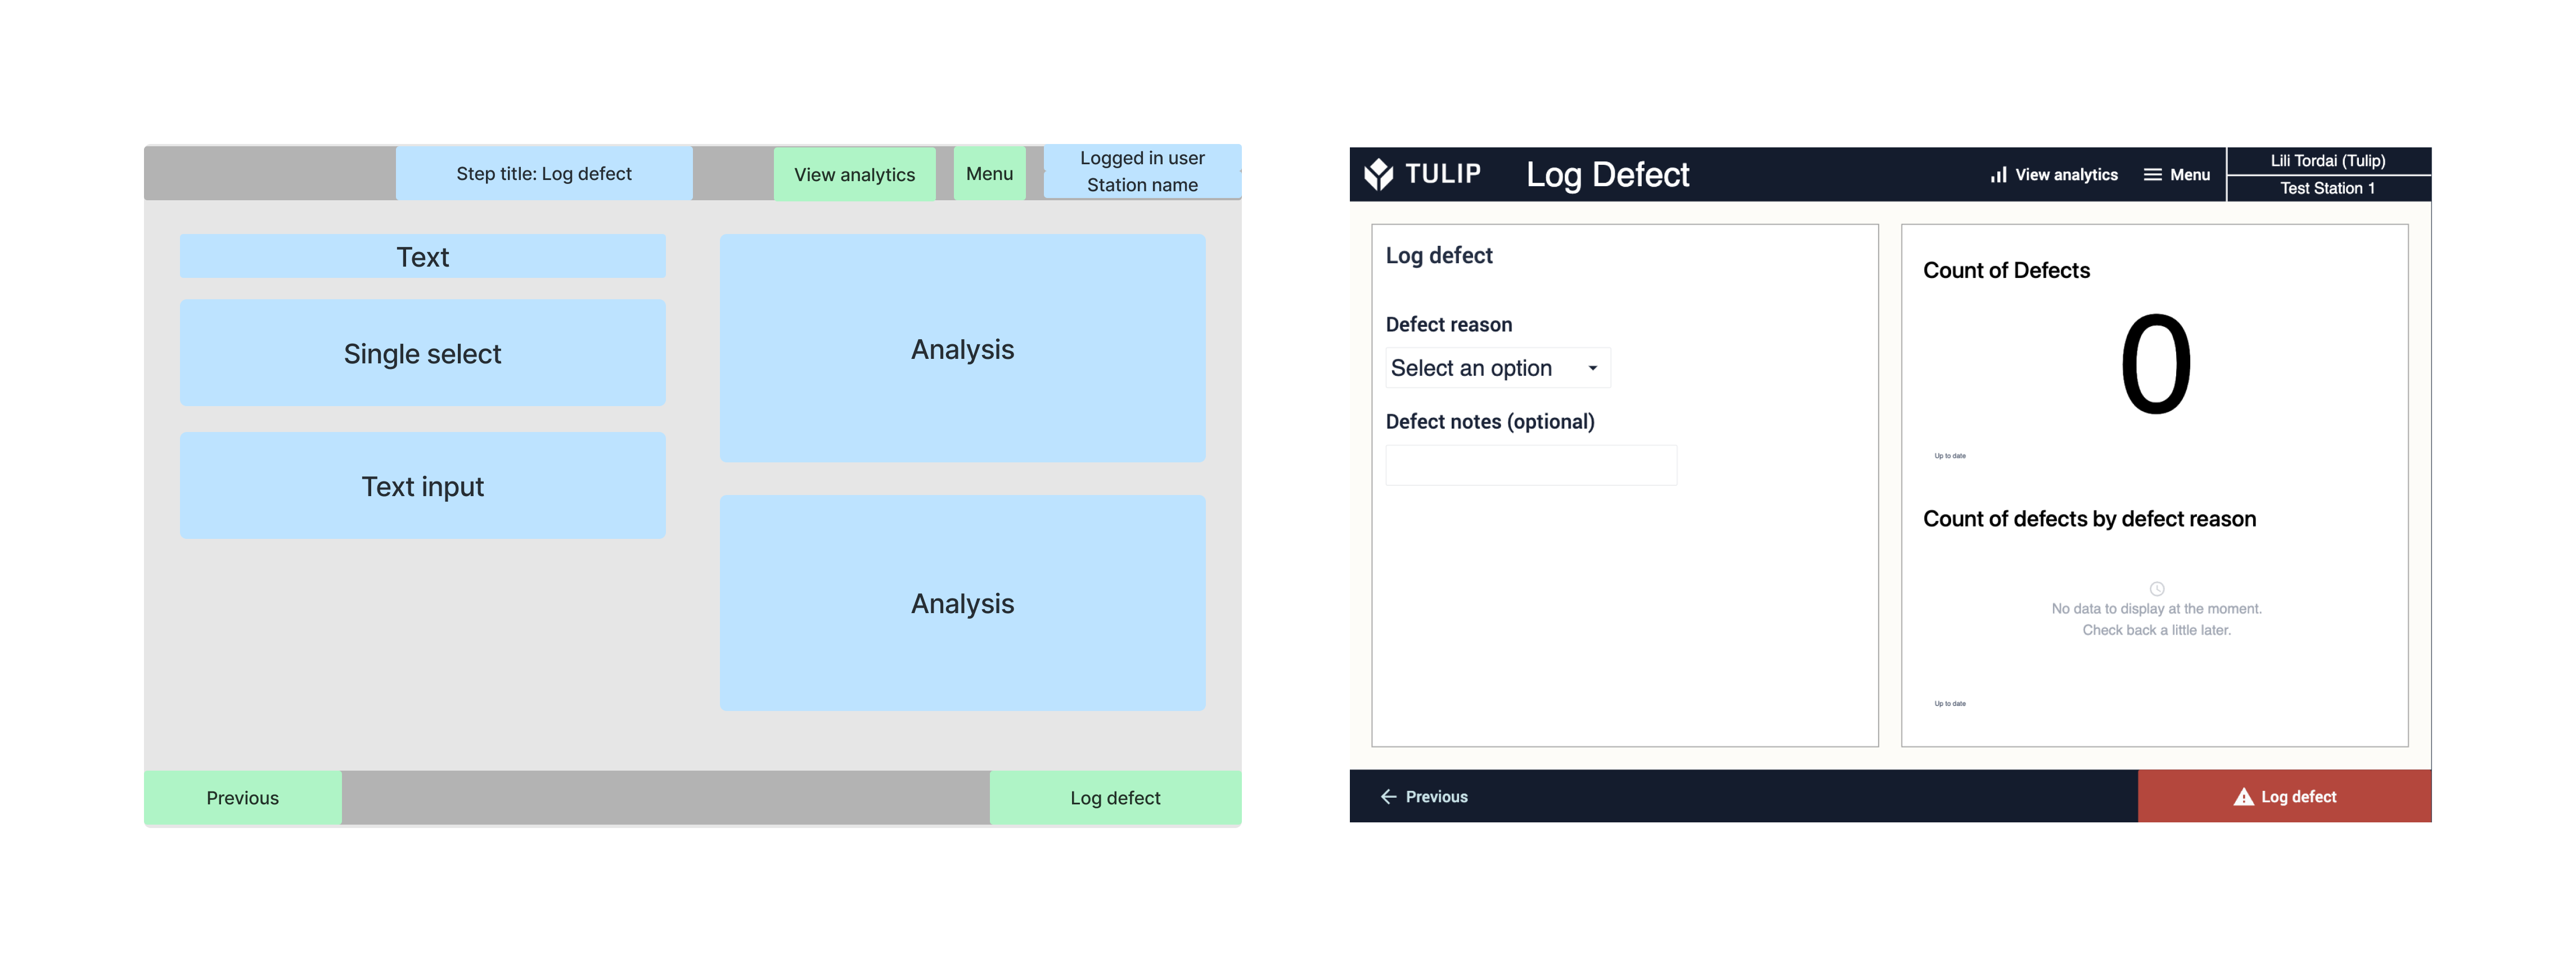
On step Log Defect, there is a single select pane where the user must select a defect reason. In addition they can save text inputs as defect notes. By clicking the button log defect, the app navigates to the Task step where the workflow was interrupted.
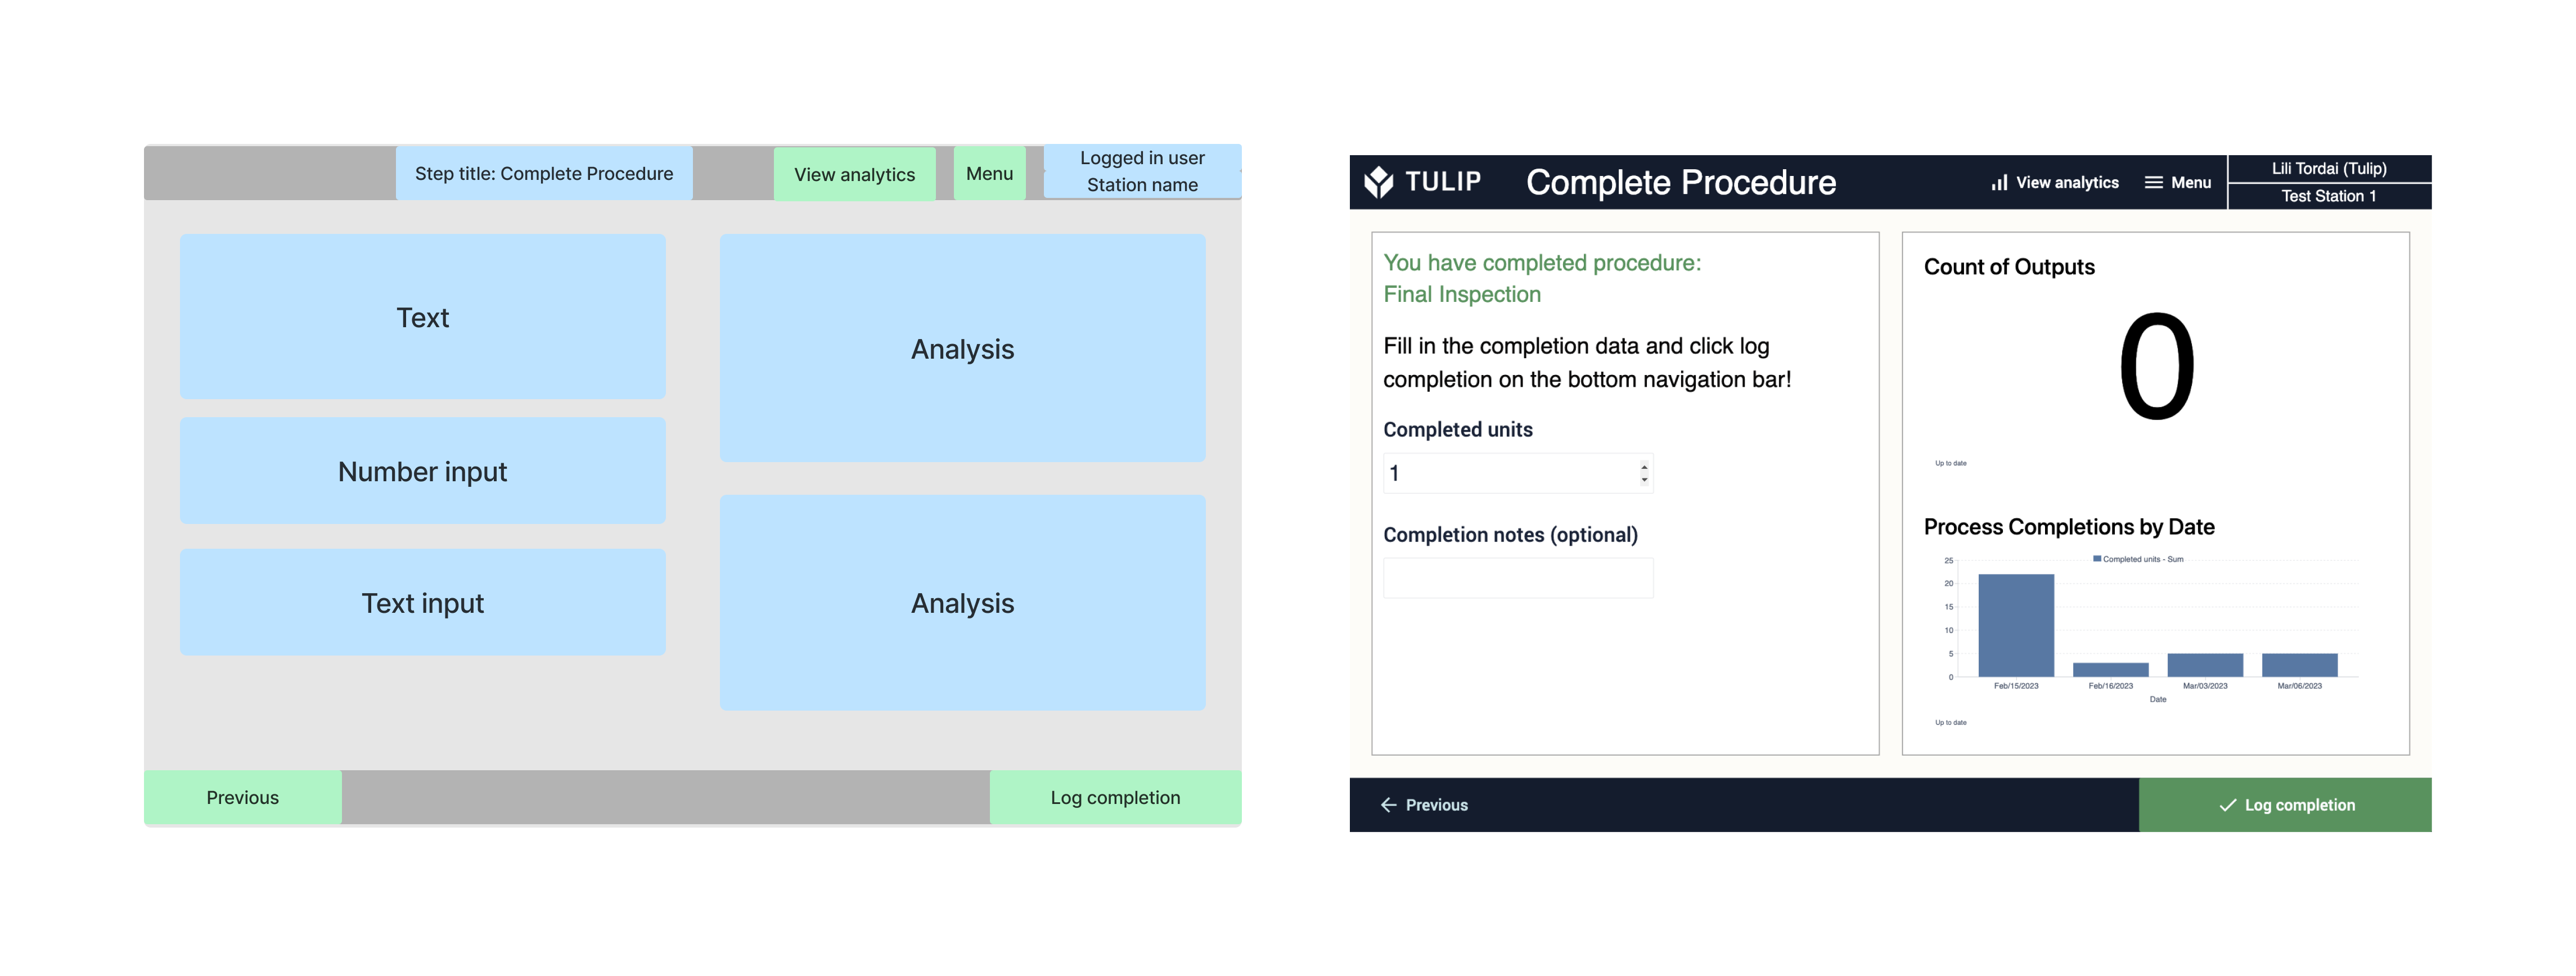
On step Complete procedure, the user must select the number of completed units, and they can also add Notes just like they could when logging defects. By clicking the button log completion, the app navigates back to step Select Procedure.
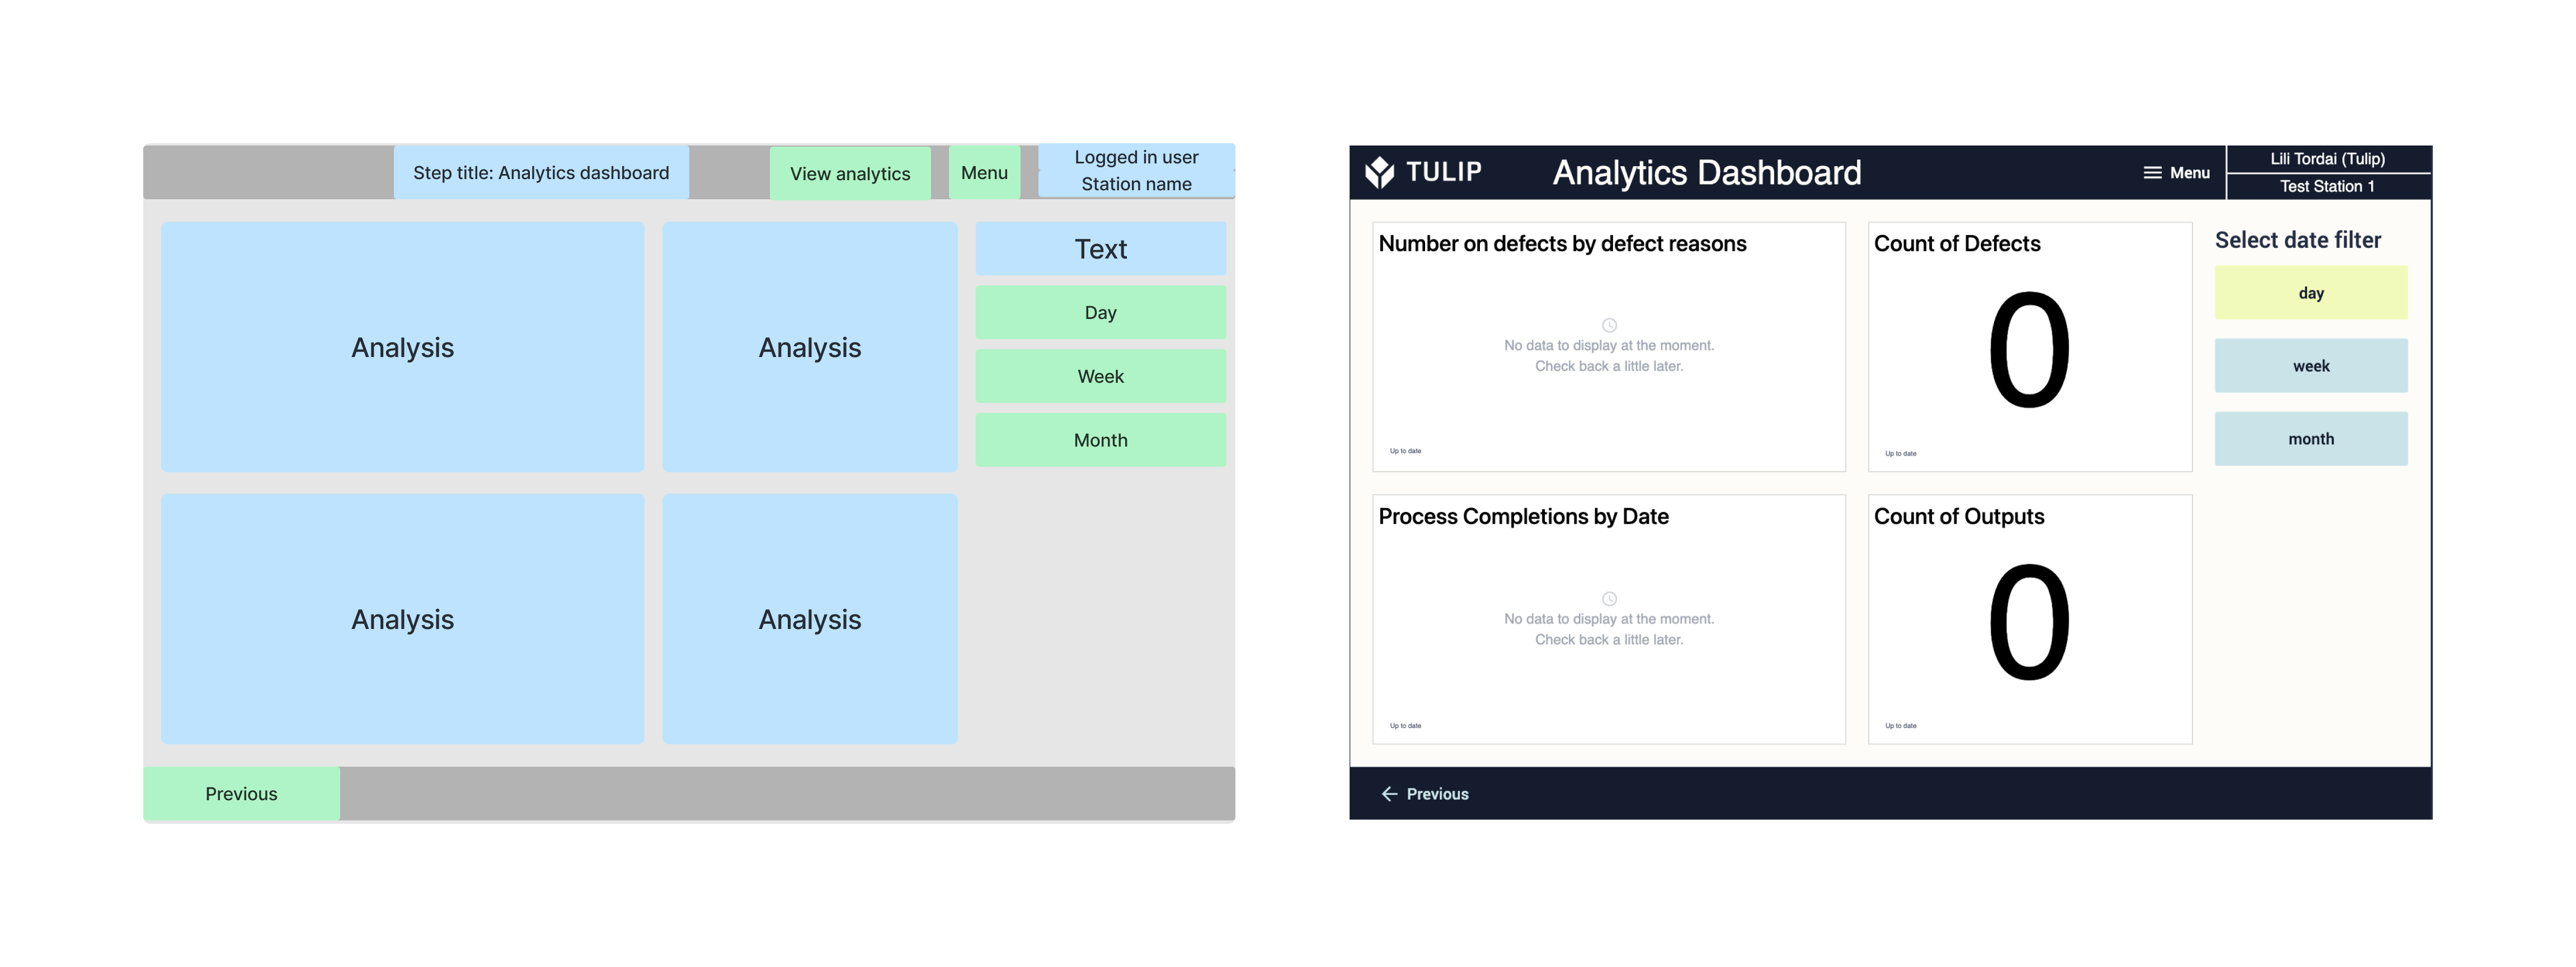
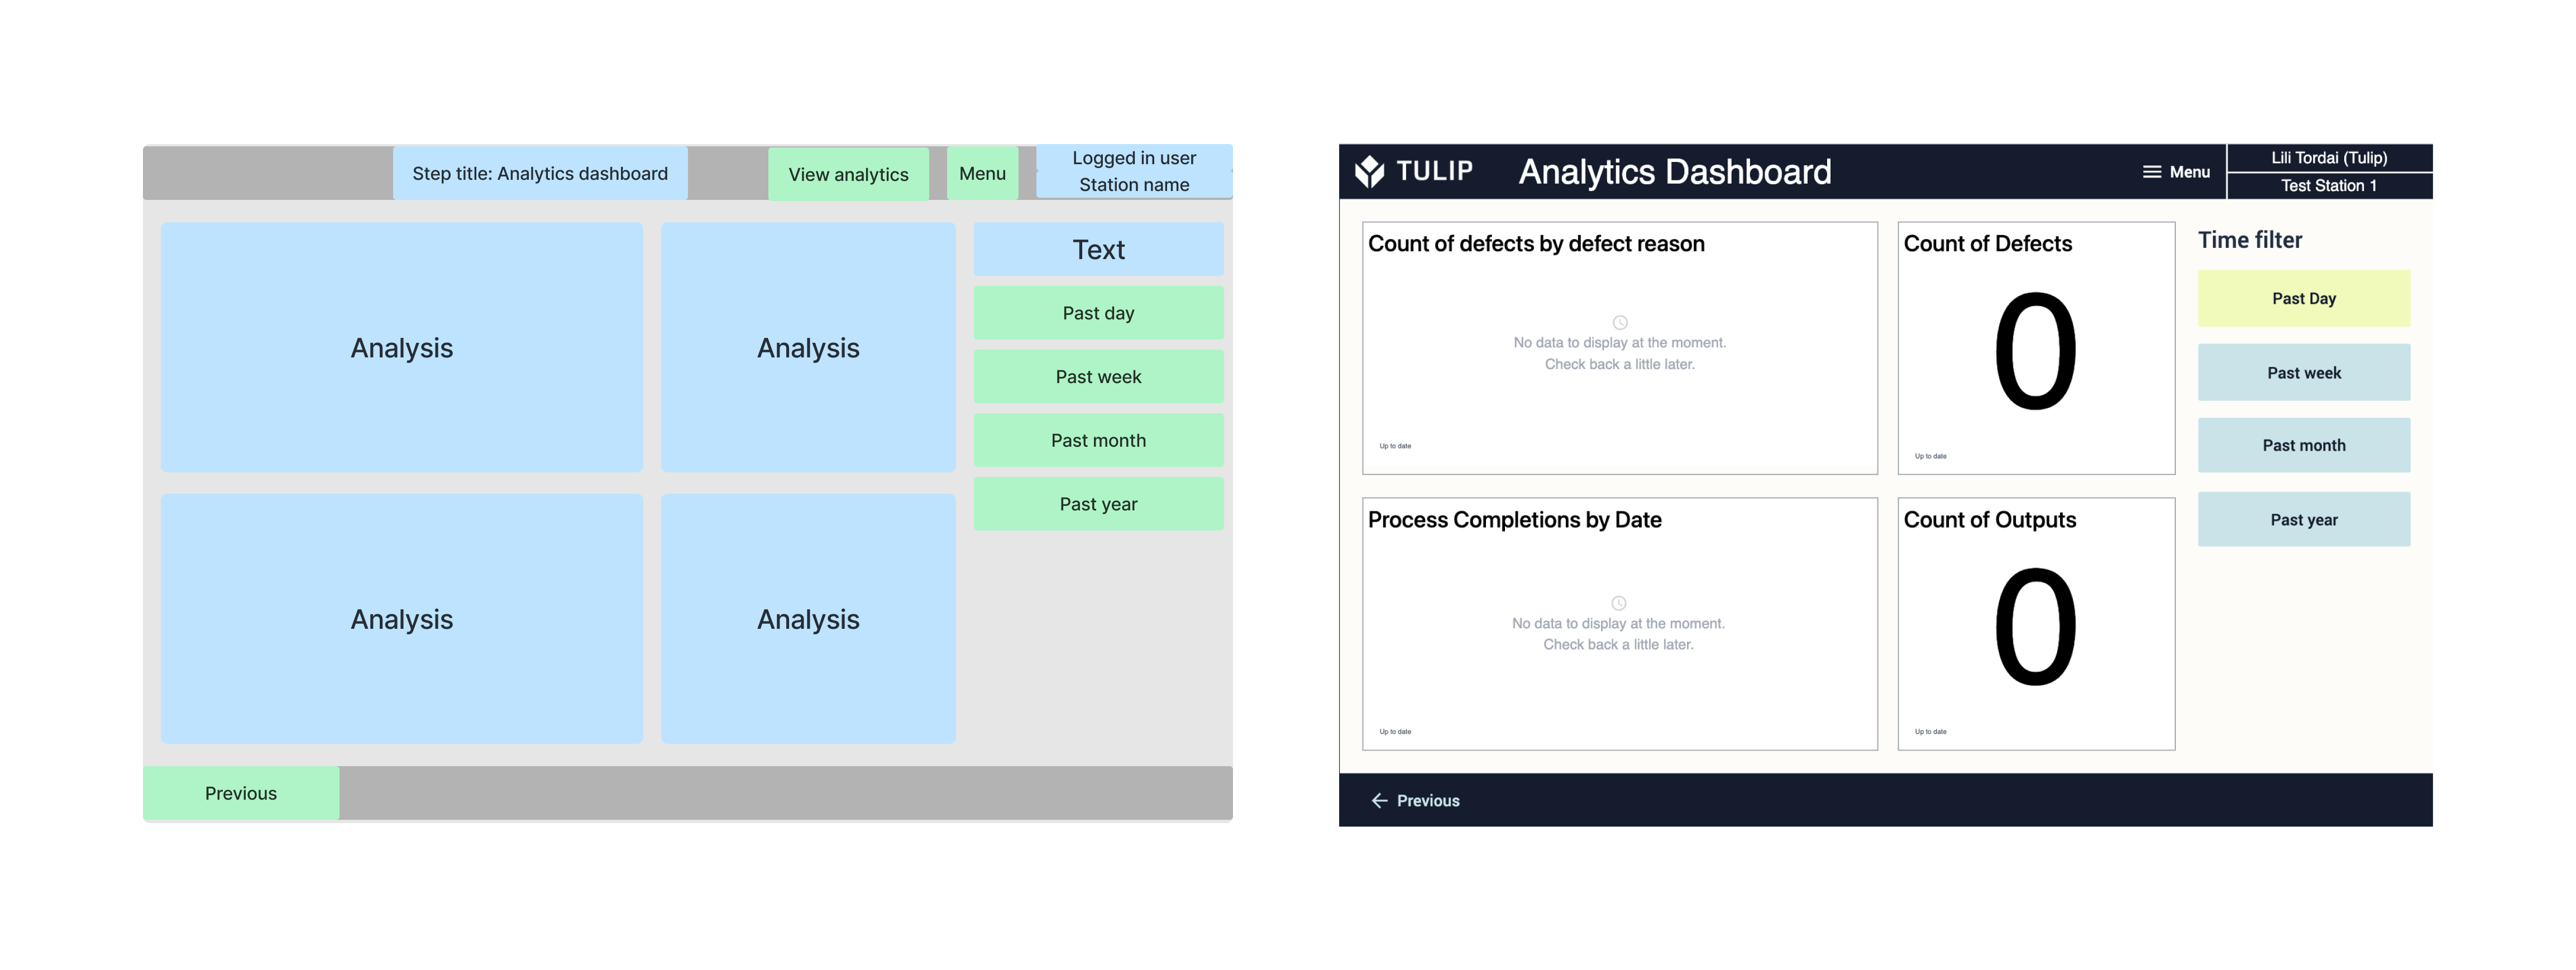
The user can navigate to the Analytics Dashboard step from all the other steps of the app. The analytics graphs can be customized an filtered. The time filtes can be selected by using buttons.
Procedure scroller and Procedure scroller with parameters
Procedure scroller is a work instructions template, where the user selects a procedure form an interactive table and the sequence of tasks displays. View the details of the tasks by selecting them, however you do not need to click though all the steps before logging completion. During the execution of the task, the operator can log any possible defects with defect reason and can add notes containing the details of the defect. The analytics from the completion data can be viewed at any time while using the app.
The Procedure scroller with parameters template is the same as the procedure scroller, with the difference that you can add parameters to the tasks. When a task is selected, the applied parameters are shown next the the task details.
Application structure
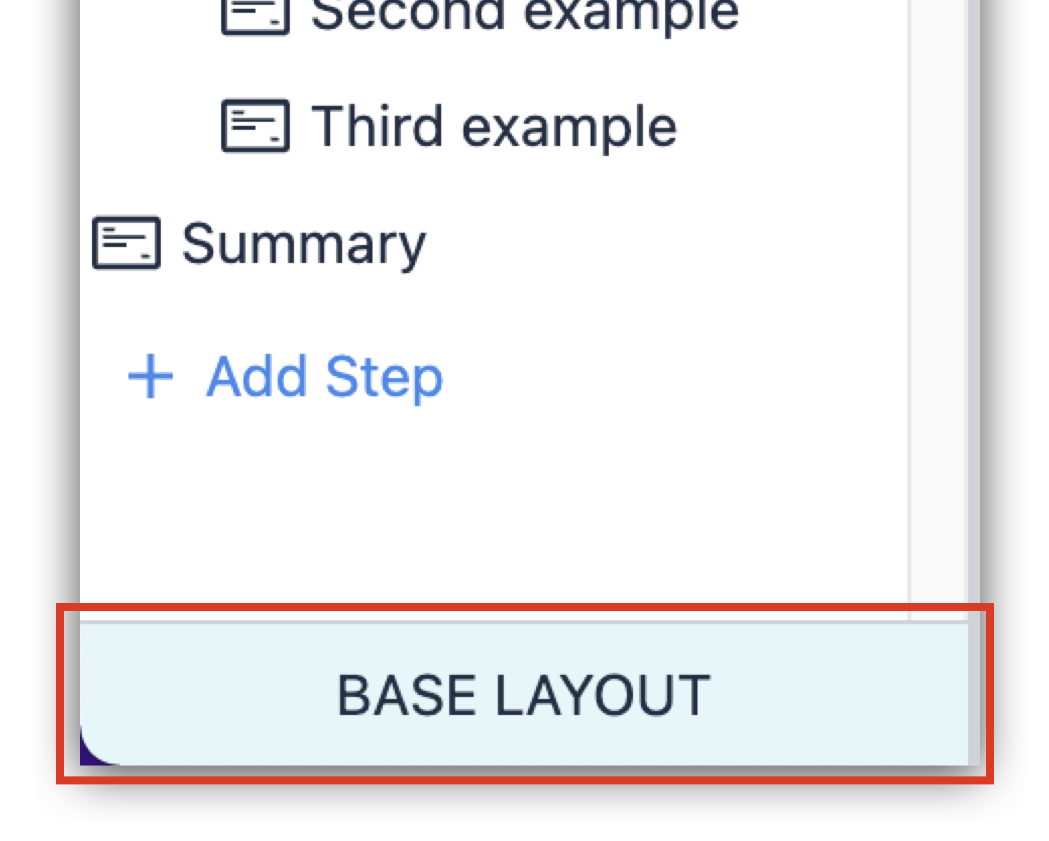
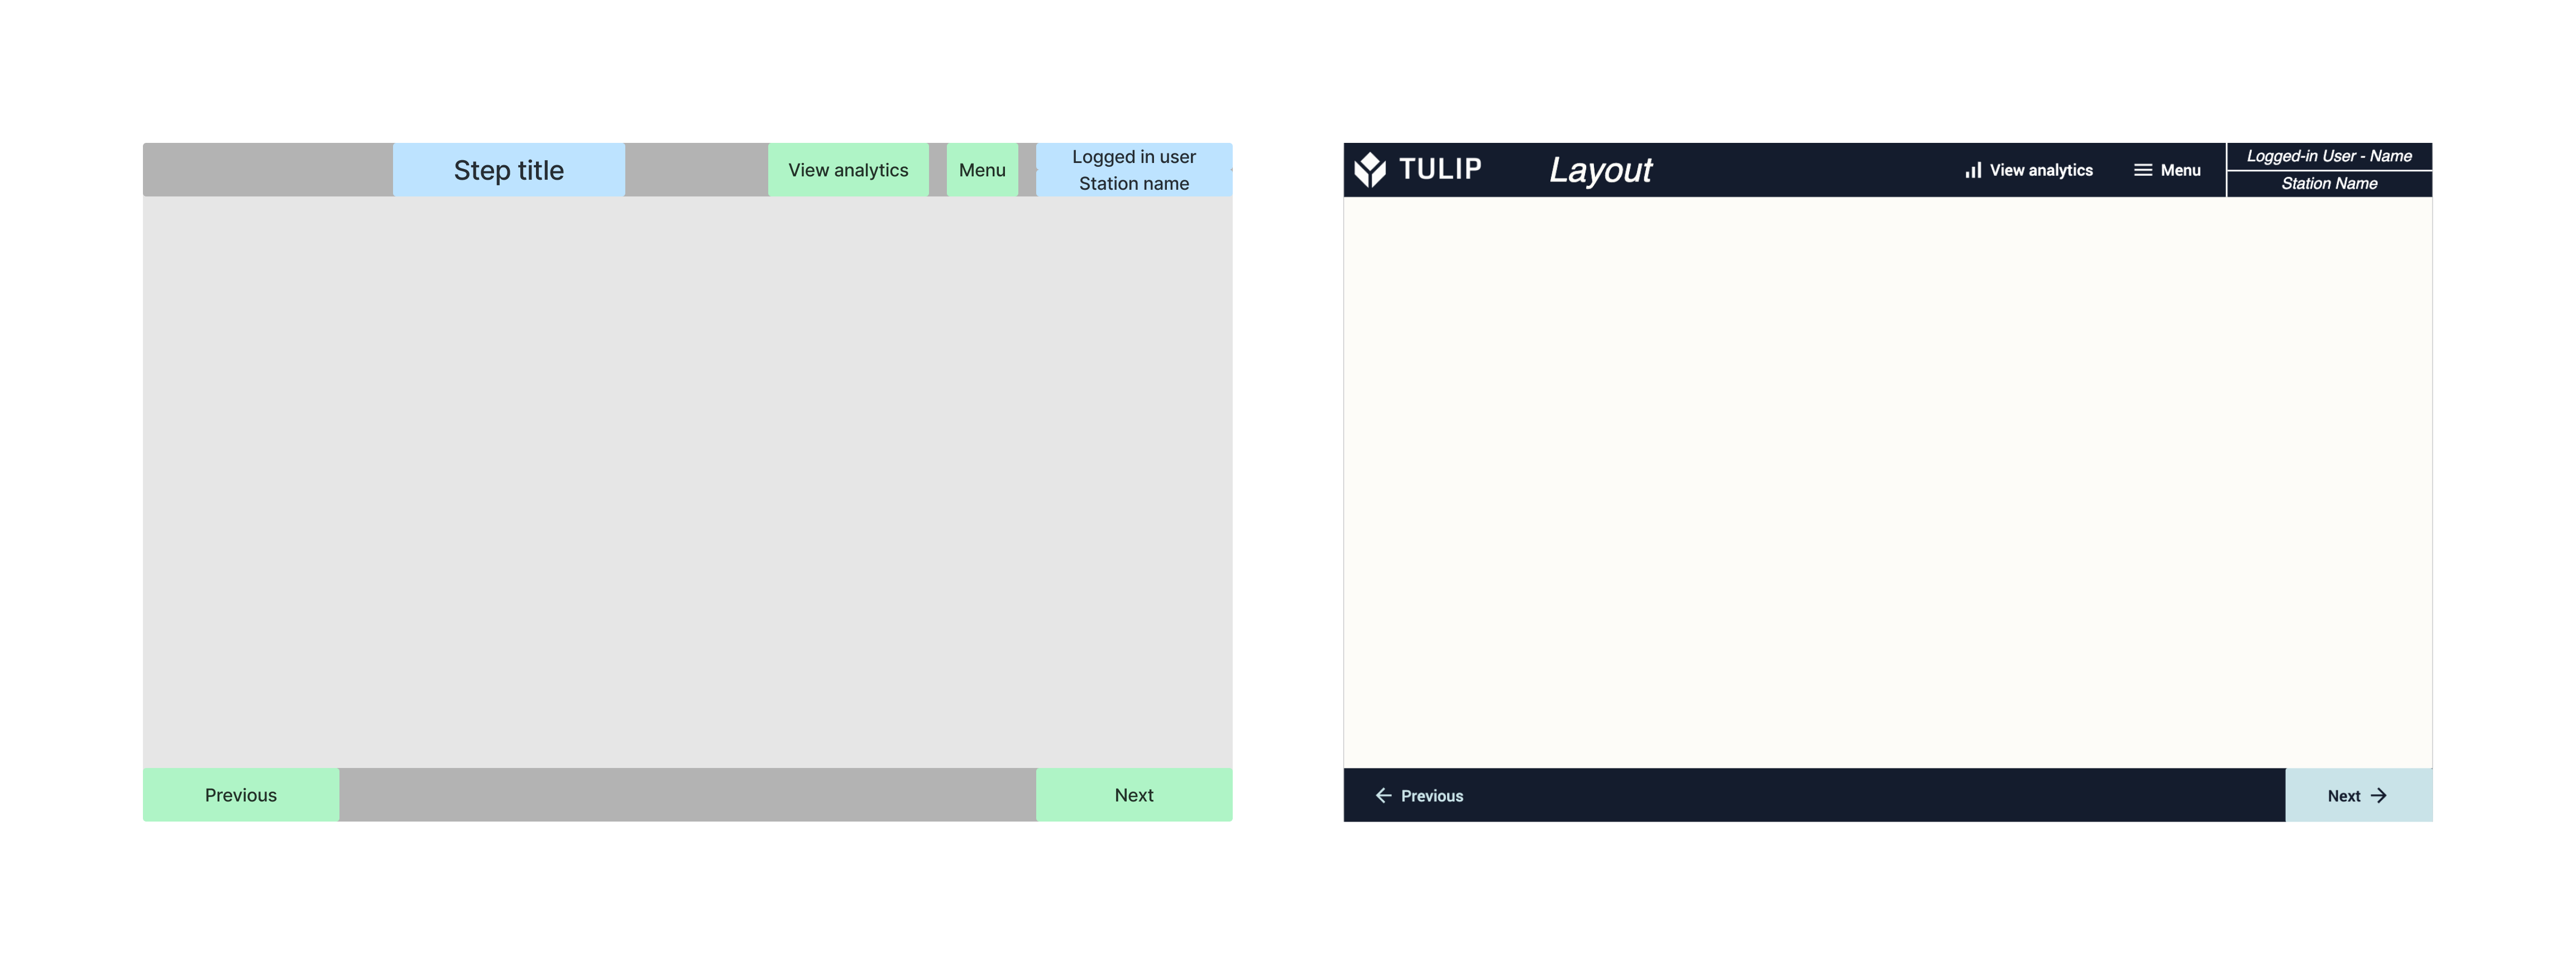
All the steps are having the same Base Layout with a top and a bottom navigation bar. On the top navigation bar there is the step name, the menu button, the name of the logged-in user and the station name. On the button navigation bar the previous and next buttons can be found.
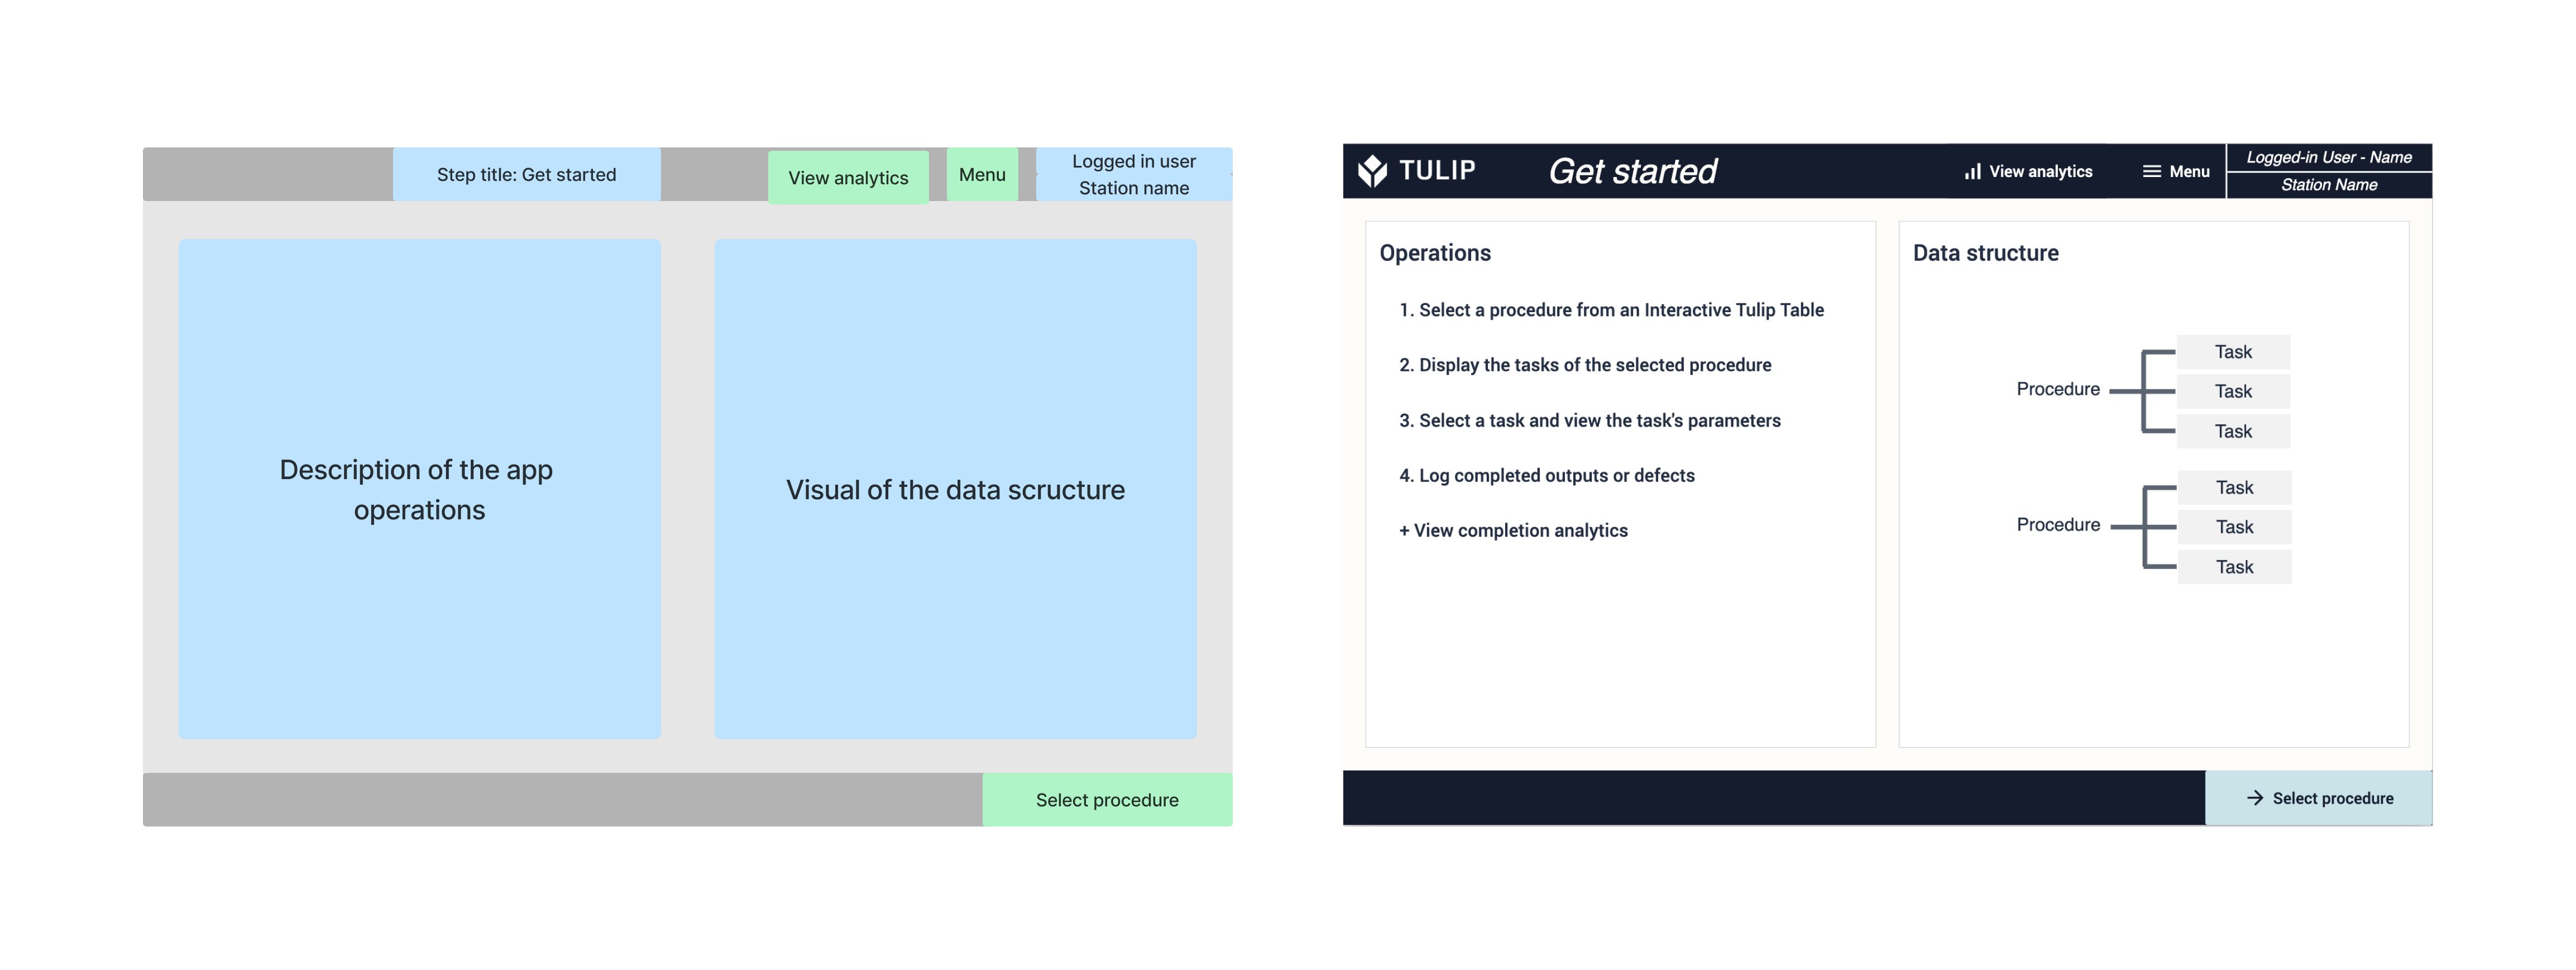
The Get started step is not a functional step, but rather an explanatory step. On the left here is a summary of the sequence of operations that can be done in the app. On the right there is a simple visual of how the data structure stored in the Tulip tables look like.
On step Select Procedure, the user can select procedures from an interactive table and display its details.
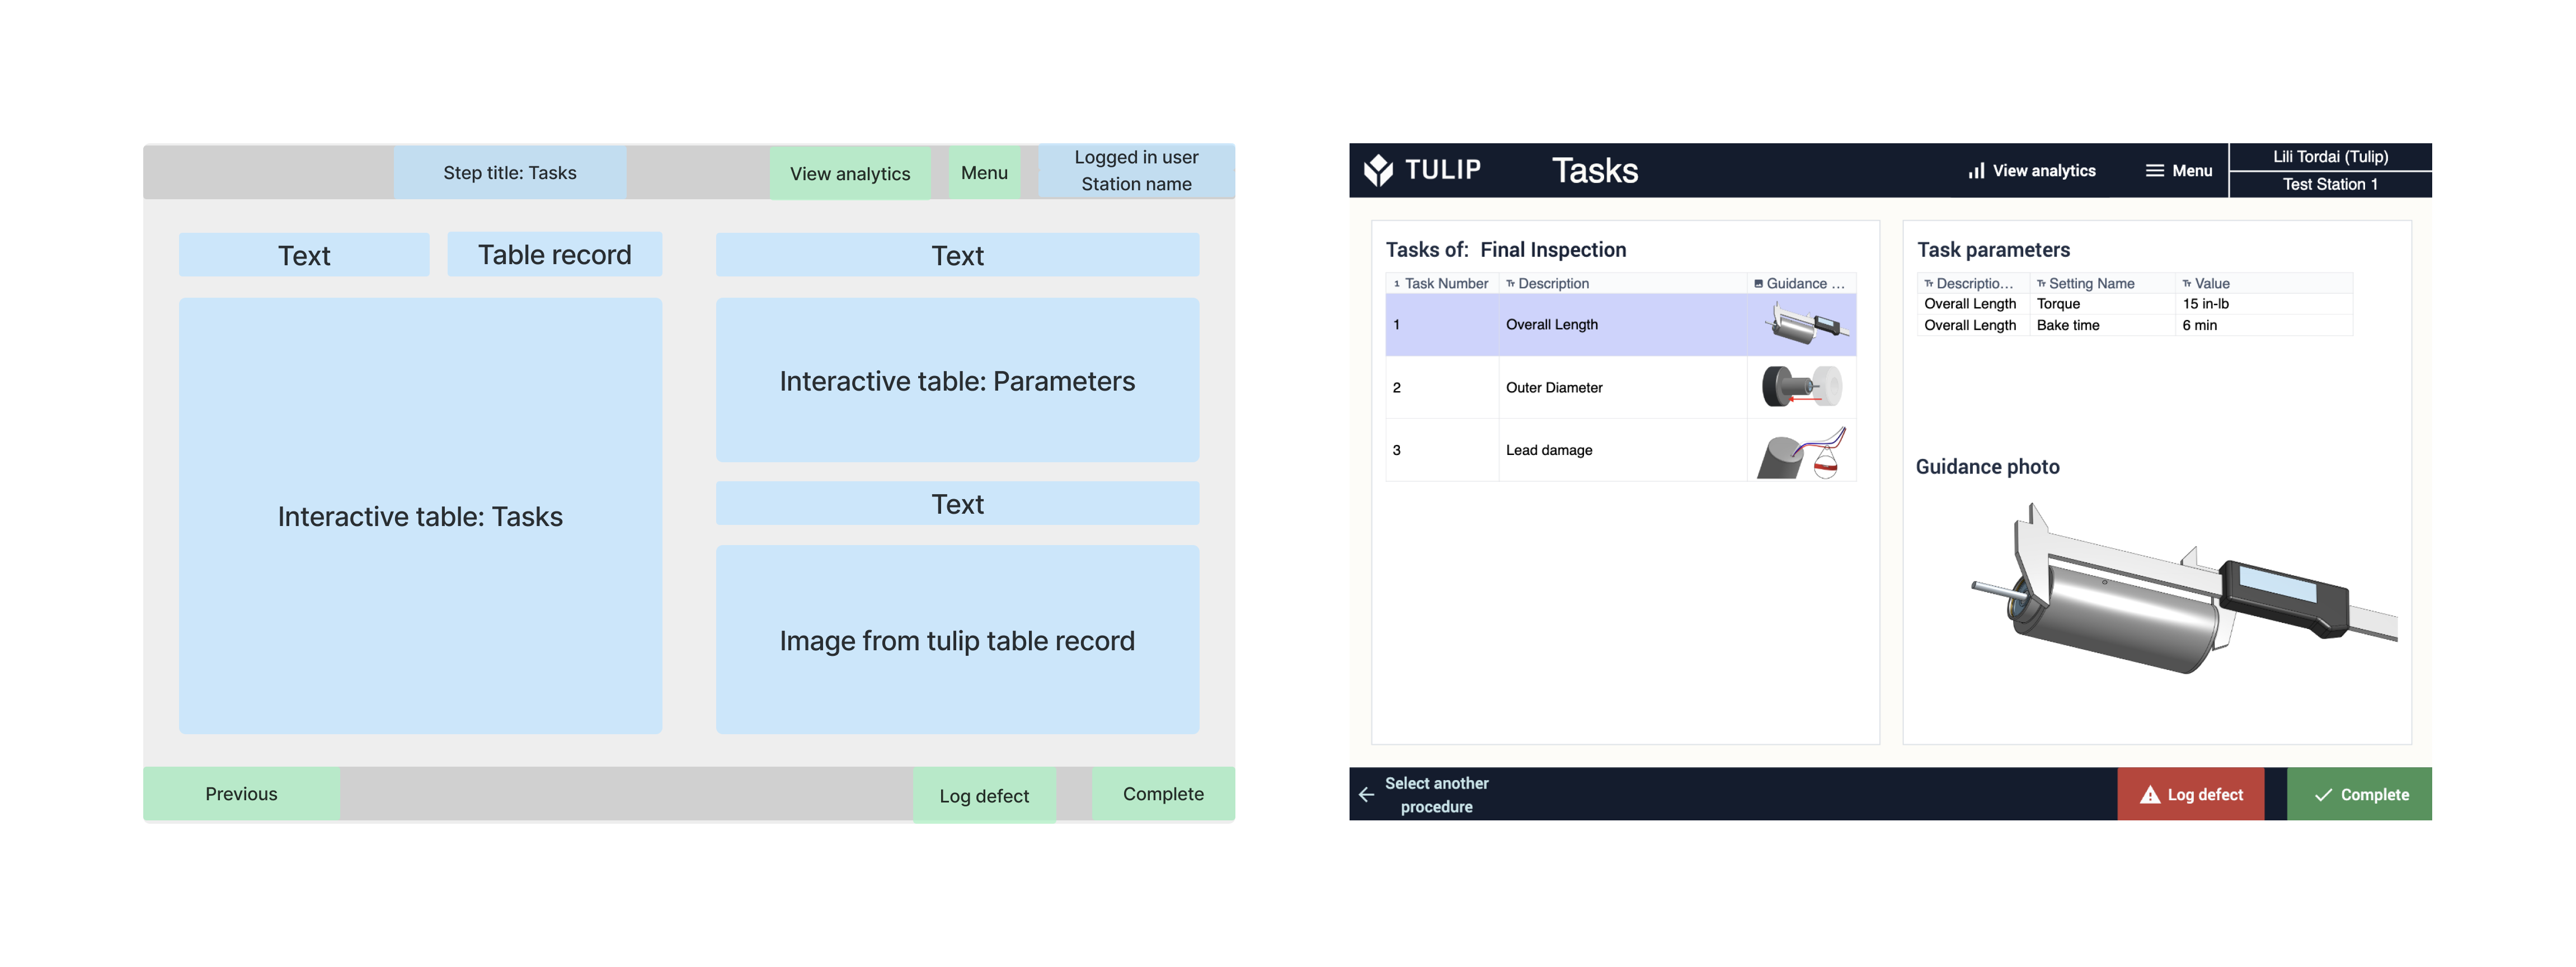
On step Task, the user can select a task form an interactive table and display its details. It is also possible to navigate to the Log Defect step or to complete the procedure.
Unlike the One-task-per-step solution, here, the user does not have to click through all the steps in a procedure in order to complete it.
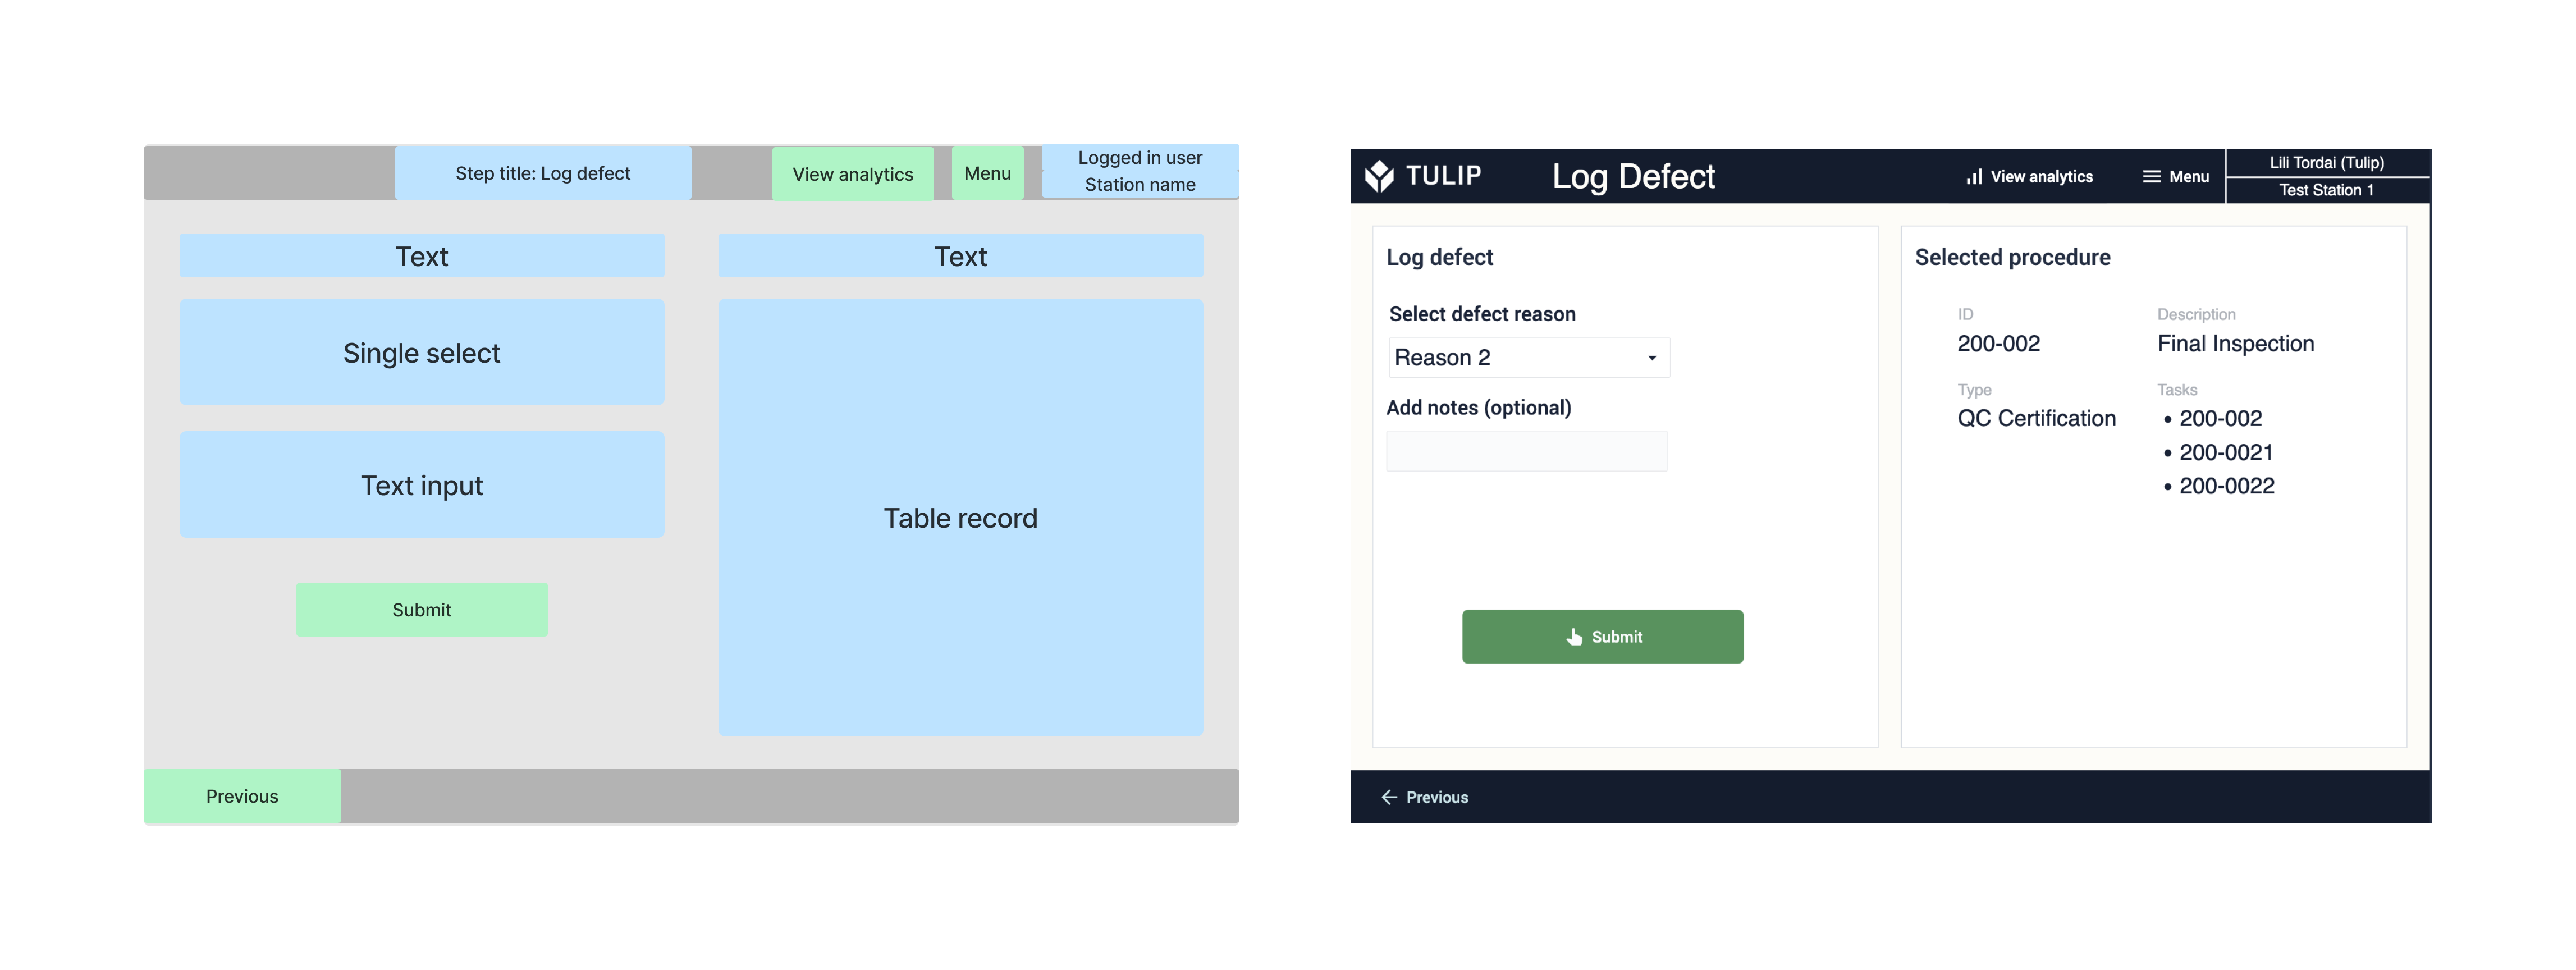
On the Log defect step the user must select the reason of the defect. In addition, there is a possibility to write down any notes about the defect. On the right the details of the selected procedure are displayed.
The user can navigate to the Analytics Dashboard step from all the other steps of the app. The analytics graphs can be customized and filtered. The time filtes can be selected by using buttons.