
To download the app, visit: Library
This article is a guide for app configuration that includes a functional breakdown of steps and ideas for connecting to other apps.
The Performance Visibility Terminal is part of Tulip’s composable MES Production Management app suite. You can use it individually or in combination with other applications.
The Performance Visibility Terminal application is a simple solution for logging running and downtime events during production. The operator-friendly user interface is designed to be easy to understand and use. The application logs events (running, downtime), downtime reasons, and the number of good parts and defects.
Usage and Value Creation
This app is useful for manual, low-volume assembly environments where tracking each unit is not a necessity.
While the app monitors the fundamental metrics of OEE, which includes Availability, Performance, and Quality, its functionality transcends simple machine surveillance. It adopts a more comprehensive approach to assess operational efficiencies.
Tulip Tables in the app
All the applications in the Composable MES app suite use common tables.
The application utilizes the Work Order, Stations, Station Activity History, and Material Definition tables. It uses the Work Order table to select a work order, changes its status to In Progress, and then to Completed, while also incrementing the completed quantity of the work order. The Material Definition table stores the Target Cycle Time, which aids in calculating targets for different machine statuses.
The Station Activity History and Stations tables are also used for performance visibility. They automatically record the length of production events, the number of items produced, and the statuses of stations.
(Operational Artifact) Work Orders
- ID: Work Order unique identifier
- Operator: Operator who completed the work order
- Parent Order ID: Reference to a parent work order (for example, if a work order needs to be split into more work orders)
- Material Definition ID: The part number of the work order
- Status: CREATED, RELEASED, KITTED, IN PROGRESS, COMPLETED, CONSUMED, DELIVERED
- Location: This is the physical place where the Work Order exists. It could be a station ID, a location ID, or any arbitrary indication of a location
- QTY Required: Quantity of parts that need to be produced
- QTY Complete: Actual quantity produced
- QTY Scrap: The number of units that were scrapped associated with this work order
- Due Date: The date when the WO is due
- Start Date: Actual start date timestamp for the WO
- Complete Date: The actual complete date/time of the Work Order.
- Customer ID: The identity of the company or entity the current production demand is being fulfilled for.
(Log) Station Activity History
- ID: Unique identifier of the historical activity record
- Station ID: ID of the station related to the historical record.
- Status: Status of the station at the time the record was created (RUNNING, DOWN, IDLE, etc)
- Start Date/Time
- End Date/Time
- Duration: Duration of the record
- Material Definition ID: Material produced during the activity.
- Target Quantity: Quantity of material expected to be produced for the duration of the record (based on target or planned cycle time).
- Actual Quantity: Quantity of material produced for the duration of the record.
- Defects: Quantity of defective material captured for the duration of the record.
- Downtime reason: Downtime collected during the historical record.
- Comments: Field tracking the user's note or comment.
- Work Order ID
- Unit ID
(Physical Artifact) Stations
- ID: Unique identifier of the historical activity record
- Status: Running, Down, Idle, Paused, etc.
- Status Color: Color of the current station status
- Status Detail: This can be used to track extra status details, like the reason for downtime
- Process Cell: The process cell of which the station is part
- Operator: The operator currently working at the station
- Work Order ID: The work order currently in progress at the station
- Material Definition ID: The part of the work order in progress
(Reference) Material Definitions
- ID: The unique identifier of a Material Definition
- Name: The name of the material definition
- Type: Field used to categorize materials. For example: Raw vs Intermediate vs Final or Make vs Buy
- Description: Material Description
- Image: Image of the material
- Status: as a material evolves, it can progress through various statuses (for example: NEW, READY, BLOCKED, OBSOLETE)
- Unit of Measure
- Version/Revision: The number or letter representing the individual revision of the part
- Vendor ID: Reference to the Supplier of the material
- Target Cycle Time: The amount of time it should take to complete 1 unit, this can be used to set target production rates and establish target cycle times.
Configuration and customization
In-app help
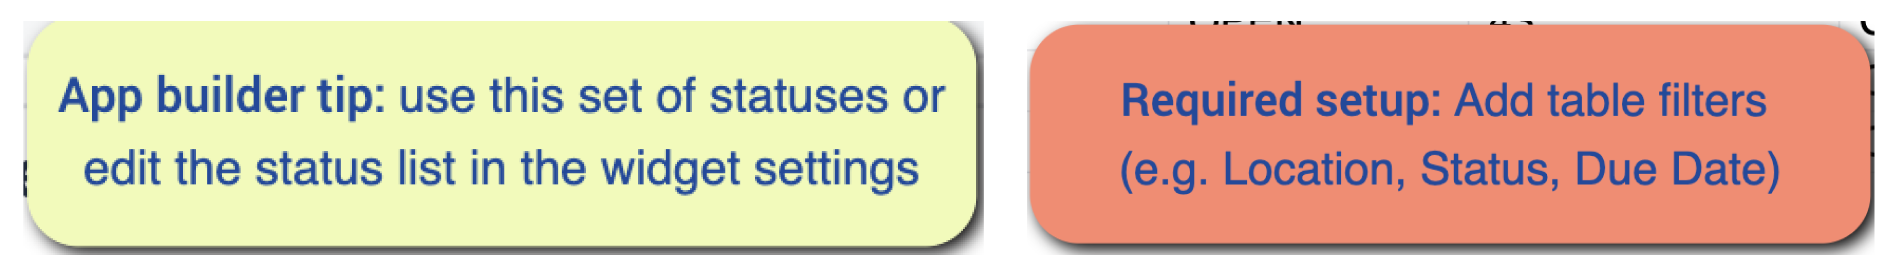
As with all applications in the Composable MES app suite, the Performance Visibility Terminal app includes in-app help as well. These are short descriptions of the Required setup steps and App builder tips to support further customization. After downloading the app make sure to read these instructions and then delete them before running the application.
Tables that provide data input
To utilize the application, you need to populate certain tables. Specifically, the Work Orders, Stations and the Material Definition tables should be populated, with the latter including the Target Cycle Time field. There are several ways to populate the tables. You can manually input the data in the Tulip Table, import a CSV file to the table, automate the process. In case of the Work Order table you can use another Tulip app such as the Order Manager application from the Composable MES app suite.
Other configuration needs
- At the Select Order step, consider adding table filters (e.g., Status, Location, Due Date). These filters help users focus on work orders that require their attention. Ensure the filters align with the order statuses used throughout your process.
- Also at the Select Order step, the Start Production button loads the Material Definition table. This table contains the Target Cycle Time field. The app calculates the target using this cycle time, so update the Material Definition table with accurate durations before using the app.
- During a Machine Status Change, the app references a variable called No Target Statuses. Users can set the default value for this variable in the Variables - Default Value section of the app's side menu.
The importance of this variable lies in its function: if a status is included in this variable, the app will not log a target for the duration of that status period.
Currently, we have set it up so that the variable only contains the OFF status. This means that if we change the status of the machine to OFF and later we change it to a different status, the app will not calculate a target number for that period.
Customization options
- On the Finish Production button, we have included a condition to verify if the produced quantity matches the required quantity. If you prefer not to use this feature, you can remove the Quantity Check trigger as well as the Actual reached Required condition from the remaining triggers.
App Structure
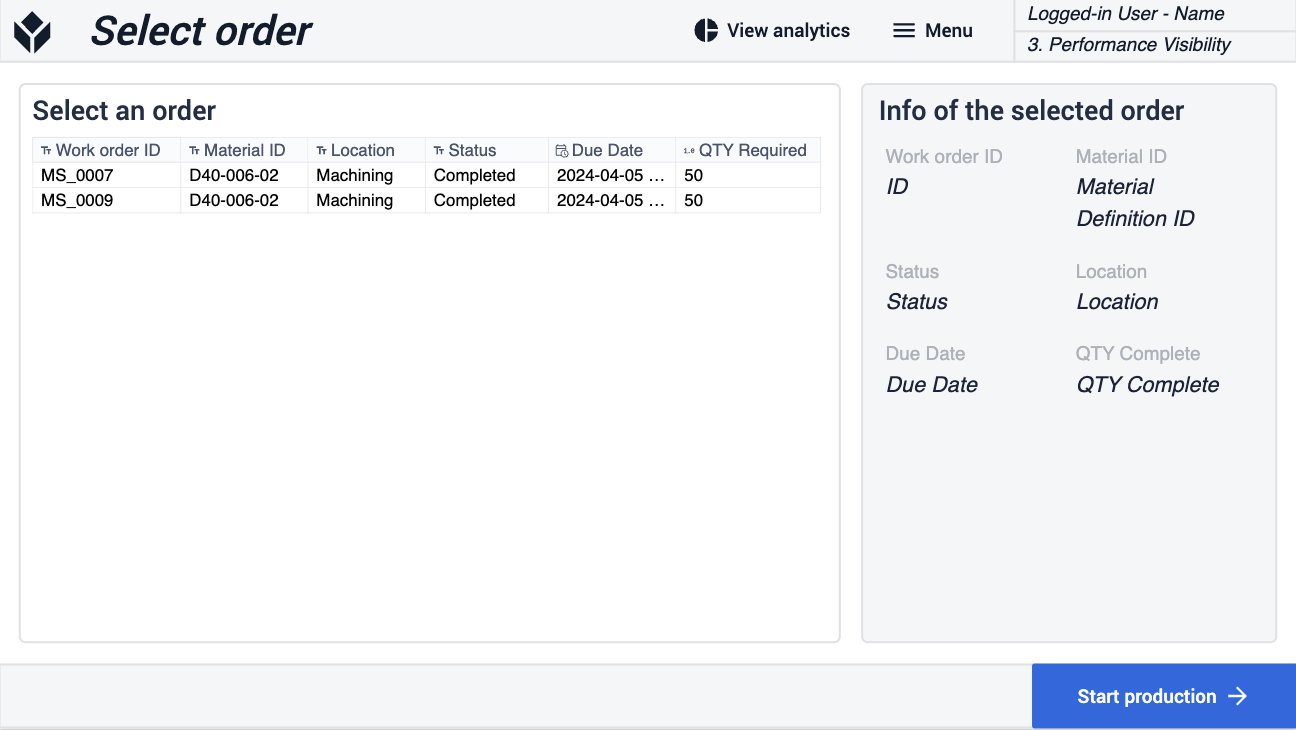
On the Select Order step, the user has to select a work order to be able to start the production.
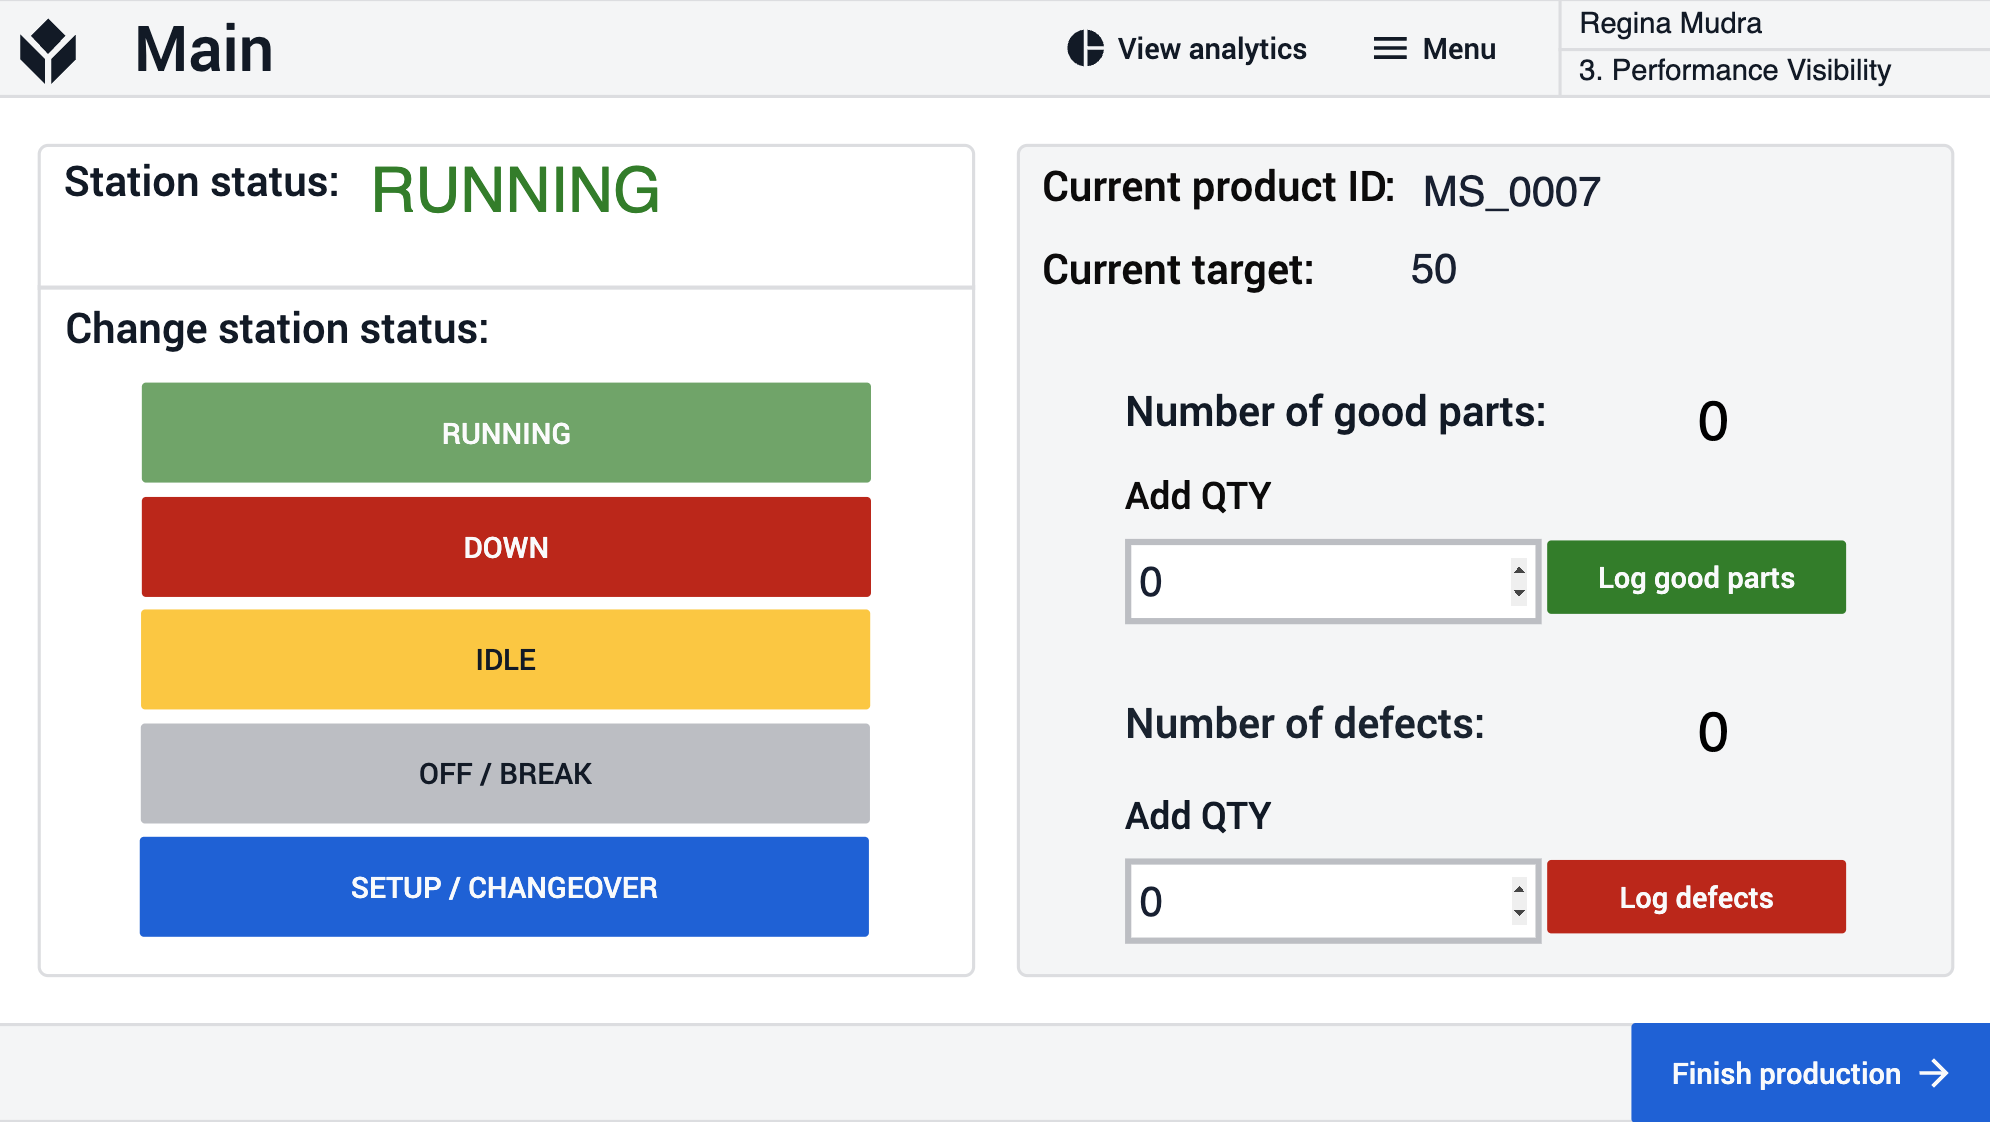
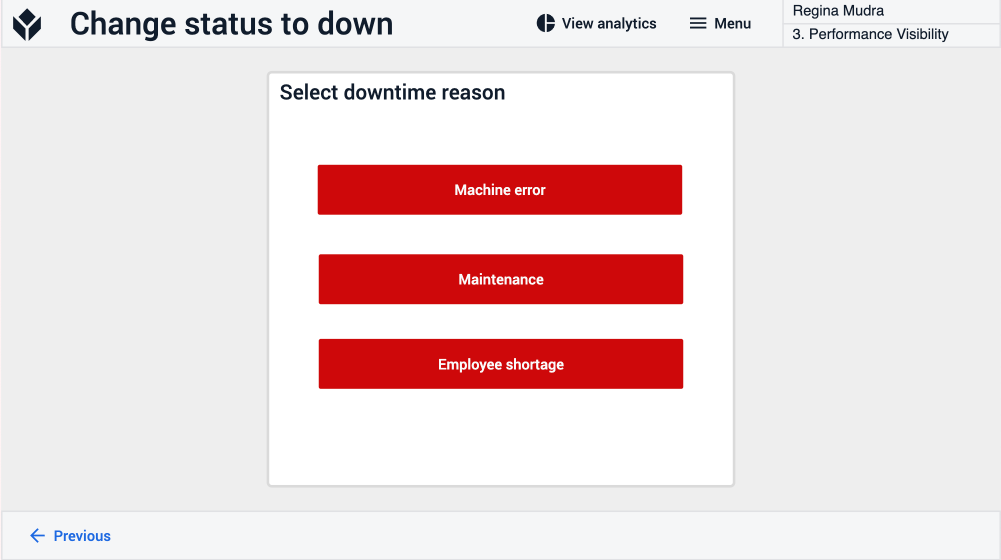
On the Main step, the user switch between production statuses and they can also log good parts and defects. If the selected status is DOWN the app navigates the user to the Change status to down step where they must select a downtime reason to proceed.
The Analytics step can be reached from any of the other steps. The user can view analytics about the performance of the production.
Extended App Connections
Examples for connecting apps to work with each other.
Operations Management Dashboard
The Performance Visibility Terminal application logs station activity into the Station Activity History Table. The Operations Management Dashboard leverages this log in the analytics.
Performance Visibility Dashboard
The Performance Visibility Terminal application logs station activity into the Station Activity History Table. The Operations Management Dashboard leverages this log in the analytics.
Order Management
The work orders created by the Order Management application can be updated by the Performance Visibility Terminal application where the order is fulfilled. The logged units and station activity in the Performance Visibility Terminal application can later be viewed by the Order Management app.
When setting up these applications make sure that you use the same set of station and order statuses, and adjust table filters respectively.