


Learn how to use the control chart layer in Tulip Analytics
Overview
Control charts are a widely used tool of statistical process control (SPC). They allow monitoring of and identification of "out of control" states for values in repetitive processes that follow a known mathematical distribution (e.g. are normally distributed).
From a mathematical perspective, identifying an "out of control" process means identifying that the values occurring (e.g. the data being measured on the shopfloor) do not fit the expectations based on the statistical distribution previously collected data.
Some common use cases for control charts are monitoring the following:
- A measured dimension of individual parts or the mean value of measuring a sample of identical parts
- The duration of a repeated process
- The number of defective items in each batch
Control Chart Rules
In the control chart layer one or multiple rules are evaluated for the data. There are different rule sets used around industry (e.g. Nelson and Western Electric). Tulip currently supports the two rules that are statistically most effective in detecting out of control states without leading to a high number of false detection ("false positives"). These are:
| Rule name | Rule Logic | Corresponding standard | Implication |
| Single Outlier | Any single data point above the Upper Control Limit (UCL) or below the Lower Control Limit (LCL). | Nelson Rule 1, Western Electric Rule 1 | Single value is significantly out of control |
| Prominent Shift | 9 or more consecutive data points either entirely above or entirely below the center line. | Nelson Rule 2, Western Electric Rule 4 | Prolonged offset in on direction hinting at potential shift of process mean |
Configuration
Prerequisites
As described in the article on Introduction to Chart Layers, layers are available for specific chart configurations. In the case of the Control Chart Layer these are the following:
- Date Source: Tulip Table
- Template: One Operation
- View: Line Chart
- x-Axis: any
- y-Axis: Numeric value (Number, Integer, Interval)
Once a chart configuration is fulfilling these requirements, the Control Chart Layer will be available in the Chart Layers panel. This can be opened by clicking on the Chart Layers button in the top right corner of the Analytics Editor.
Setup
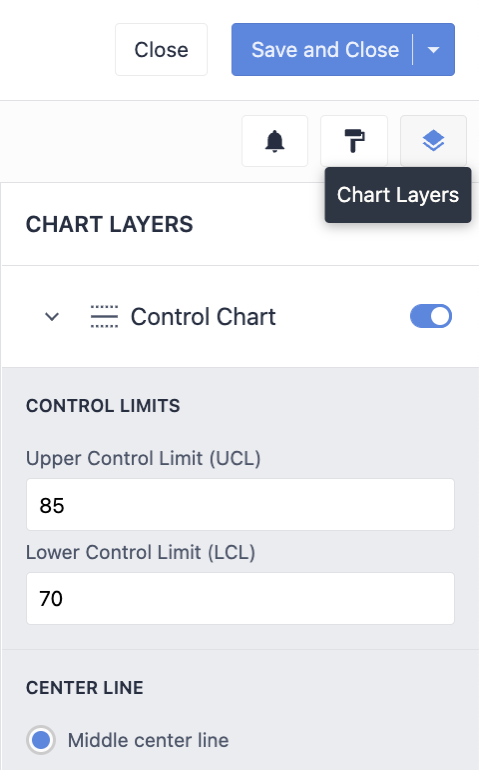
To enable the control chart Layer, click on the toggle next to "Control Chart" in the Layers side panel. This will open up the layer settings in which the following can be set:
-
Upper control limit (UCL) and lower control limit (LCL) - mandatory
-
Custom center line value - optional
- As default, the center line will be calculated as the average of UCL and LCL [(UCL + LCL)/2]
-
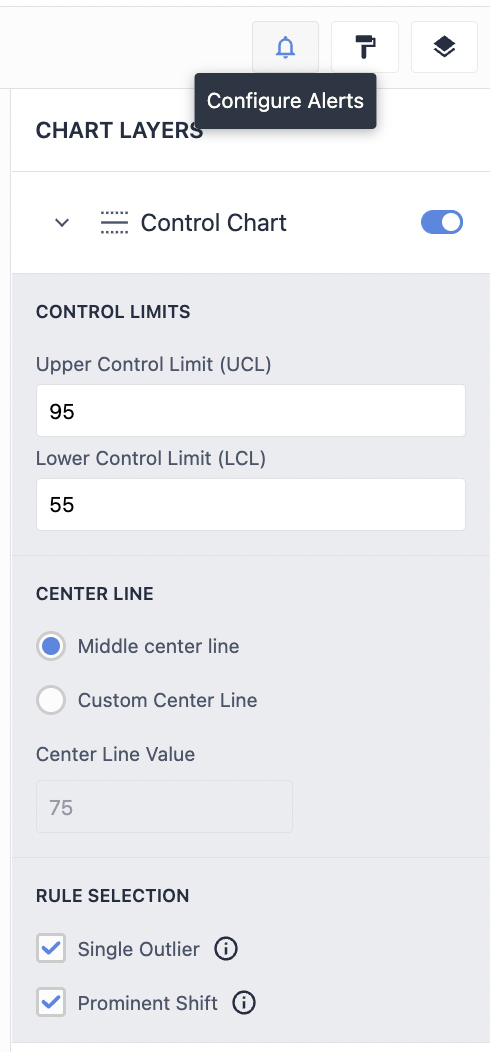
Active rules - at least one
- Single Outlier
- Prominent Shift
Tulip control charts are implemented as "manual limit" control charts at the moment. This means that the control limits are input manually by the user upon initial chart configuration. (Note: This is a one-time action for a chart, as control limits should not be changed while using the chart to monitor a process). In combination with the Analytics Editor settings, this allows to implement the following standard control chart types:
- X chart
- Xbar chart
- R chart
- S chart
- c chart
- NP chart
There are different ways to identify the control limits for each of the chart types for entering them in the configuration:
- If you used another tool for SPC before switching to Tulip and your process has not changed, you can enter the same boundaries as before
- If you have already collected data within Tulip you can calculate the statistically correct limits using the equations relevant for the desired chart type based on that data.
- If you want to use the control chart more freely you can set any limits you like and use the rules with those limits of your choice to detect outliers and shifts
A custom center line value can optionally be configured to accommodate for skewed distributions.
Usage
Once the control chart layer is successfully configured, you can save the analysis and use it the same way you use any other analysis. You can:
- Add it to a dashboard
- Embed it into a Tulip App
- Make it available via a sharing link
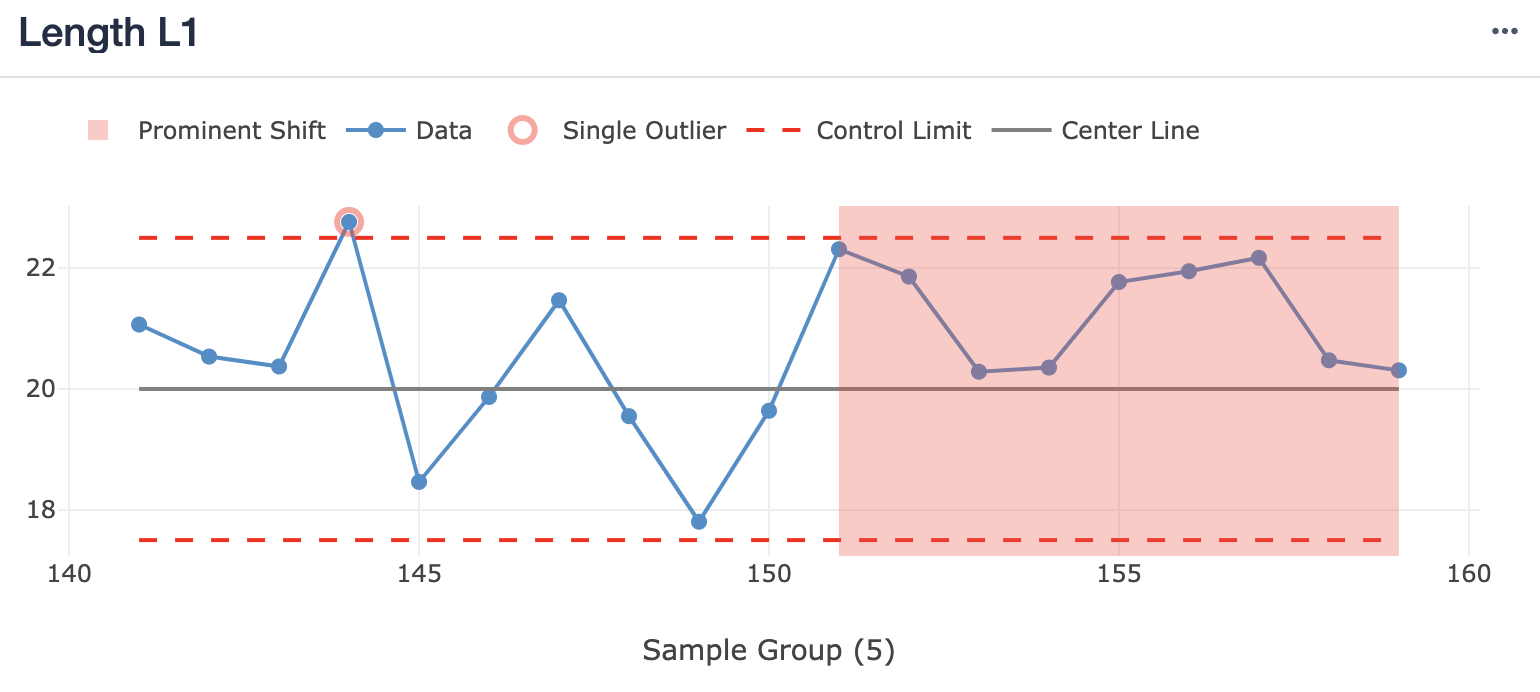
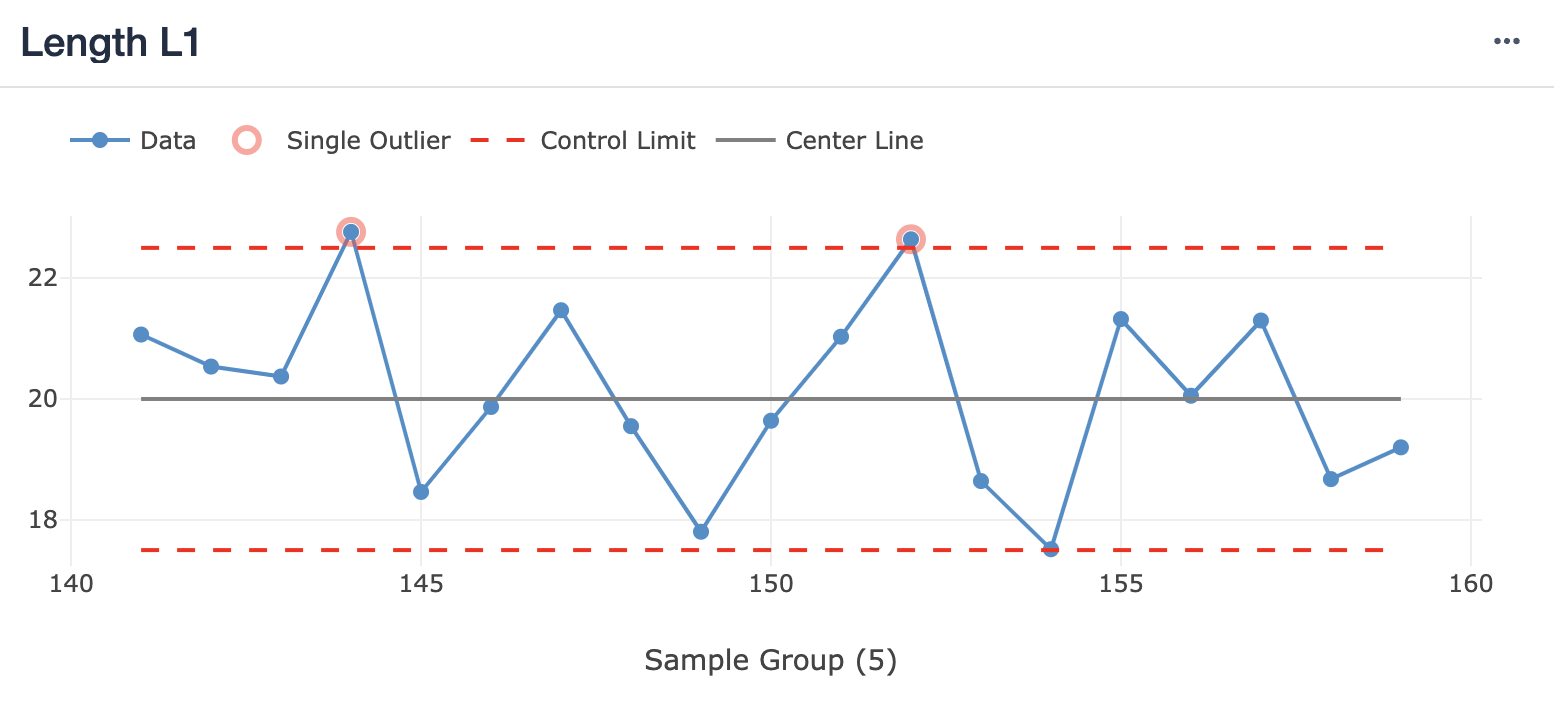
If data in the chart triggers any of the rules selected in the configuration, the relevant data points will be highlighted in the graph as depicted below.
Alerts
Set up alerting for analyses with Layers and control charts.
Prerequisites
You can configure analyses with control charts and layers enabled to allow alerting.
Setup
-
In the layers side panel, enable Control charts.
-
Enable layers (single outlier & prominent shift).
-
Alerting Configuration (Check Interval & Recipient Email List)
-
Ensure Proper Setup
-
Email Alerts Send Conditions for Analyses
-
Enable control charts on the analysis, clicking on the Layers tab for the analysis. Make sure that ‘Control Chart’ is enabled.
You must enable one of following layers in order to configure alerting settings:
- Single Outlier
- Prominent Shift
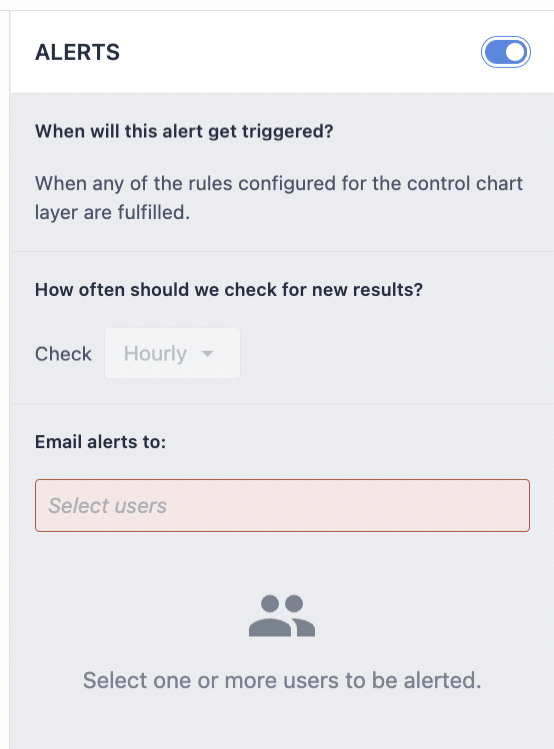
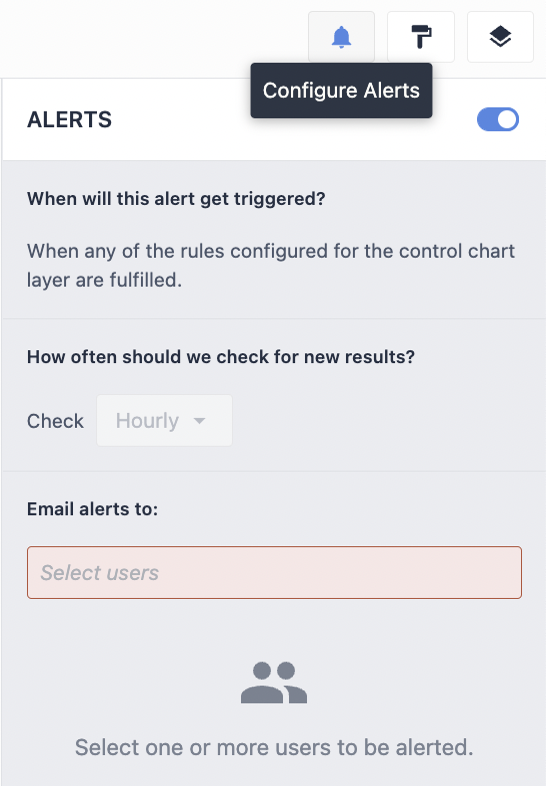
- Click on the Alerts tab (bell icon) to set alerting configuration parameters.
- Check interval: The interval between two checks for Insights
- Recipient list: A list of Tulip users whom email alerts will be sent to
- Once the alert is configured, the bell within the button turns solid blue to indicate it has been configured properly
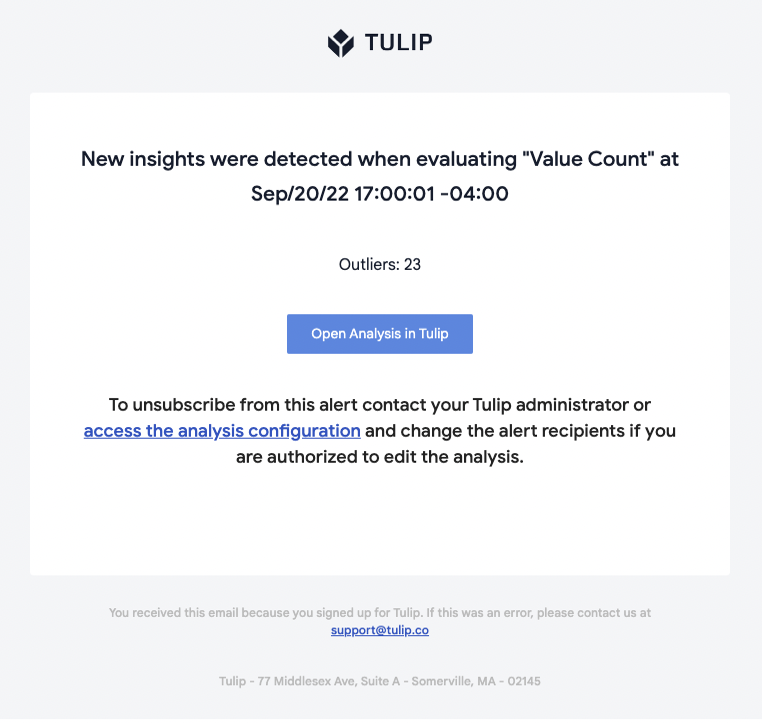
For alerting-enabled charts, Tulip checks for new Insights according to the check interval value, independent of the analysis being shown in an App or on a dashboard. If new Insights are found, an email will be sent out to the Tulip users specified in the recipient list.
The email contains:
- The name of the analysis
- A list of the new Insights identified
- The time they were identified (i.e. the hour)
- A link to the analysis
- Instructions on how to unsubscribe from the alert
.gif)