
To download the app, visit: Library
This article is a guide for app configuration that includes a functional breakdown of steps and ideas for connecting to other apps.
The Operations Management Dashboard is a part of Tulip’s composable MES Production Management app suite. You can use it individually or in combination with other applications.
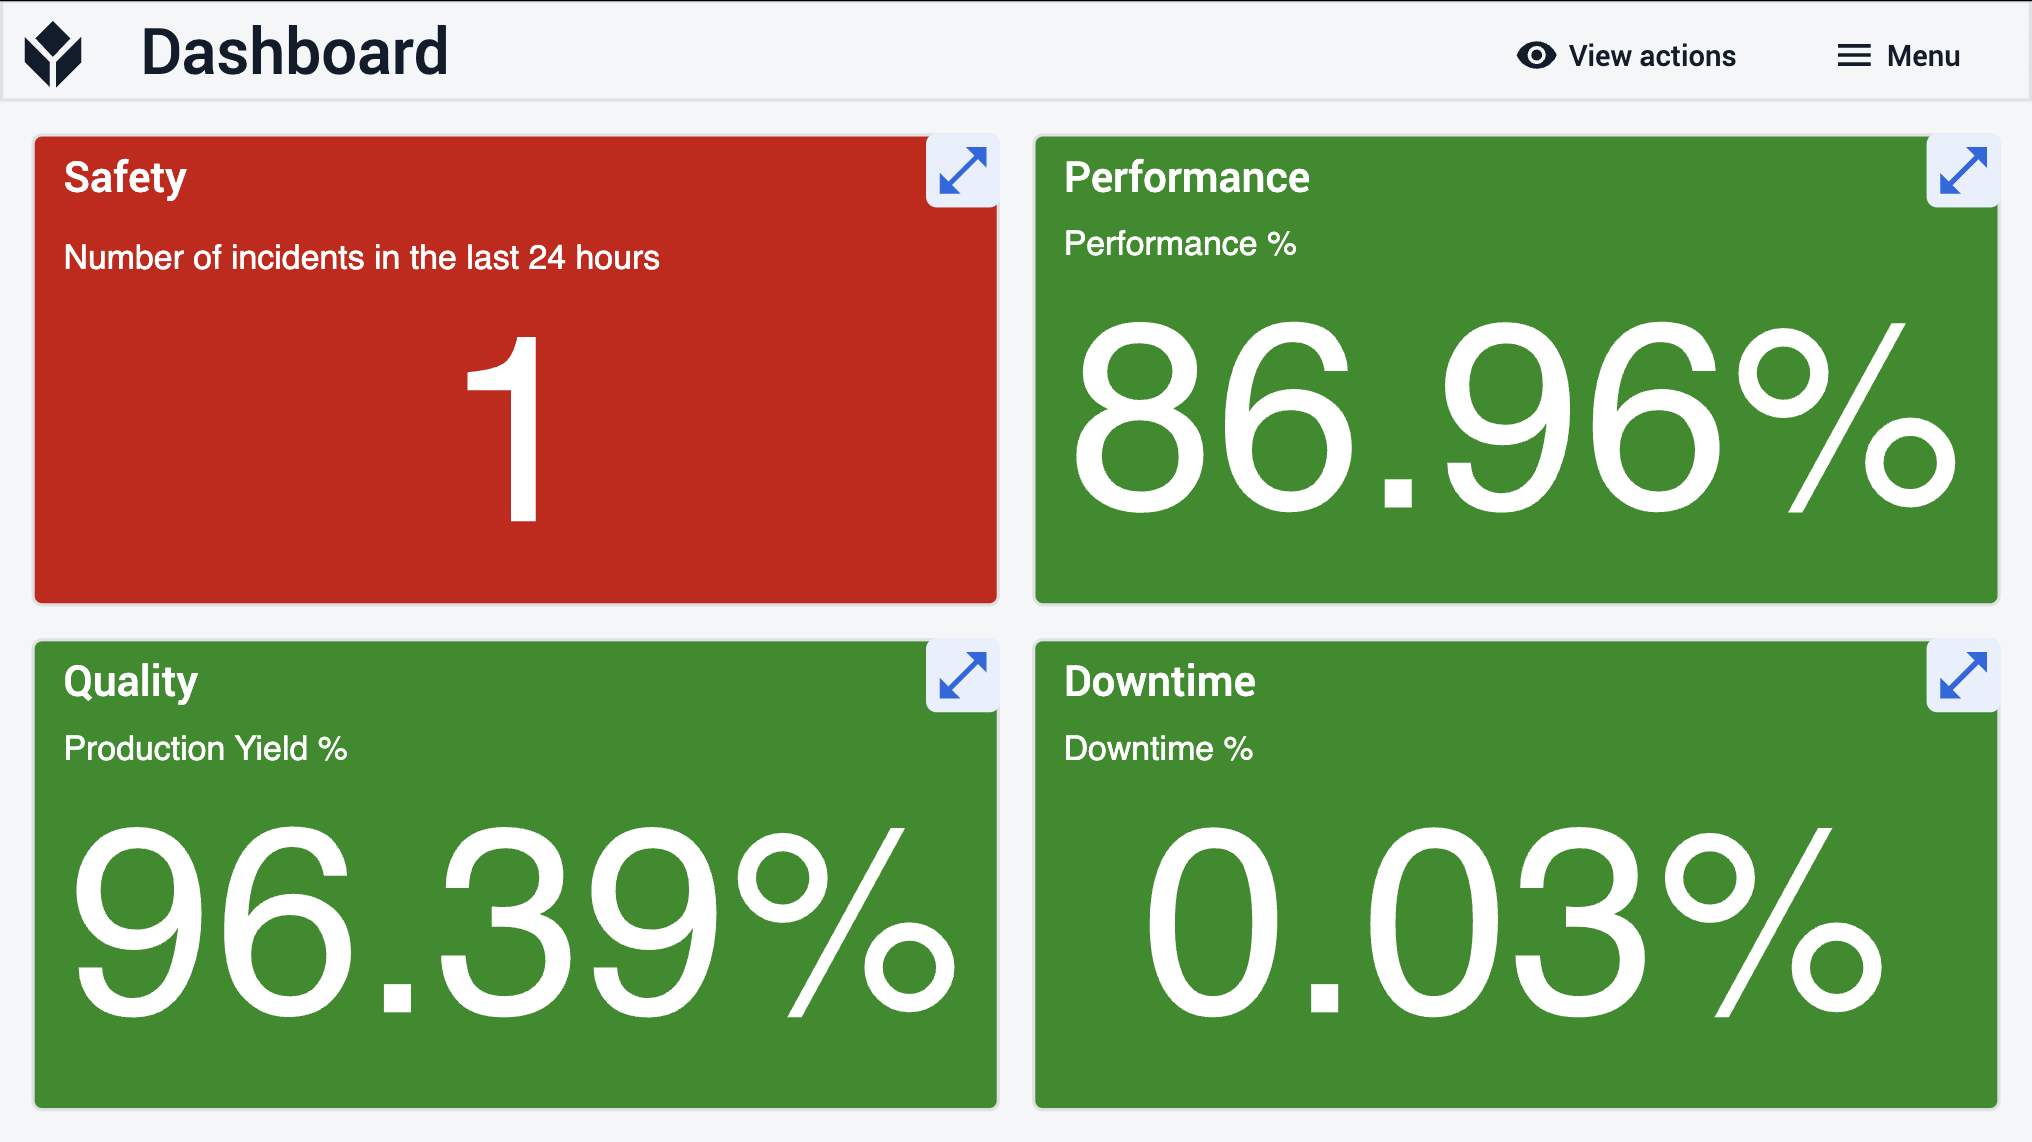
The Operations Management Dashboard application’s main step is a simple dashboard showing the most important metrics for Safety, Quality, Performance, and Downtime. Whether these metrics stand up to company standards is indicated by red and green colors.
If the user would like to see detailed information about any of the four aspects, they can open dedicated steps containing multiple charts visualizing data.
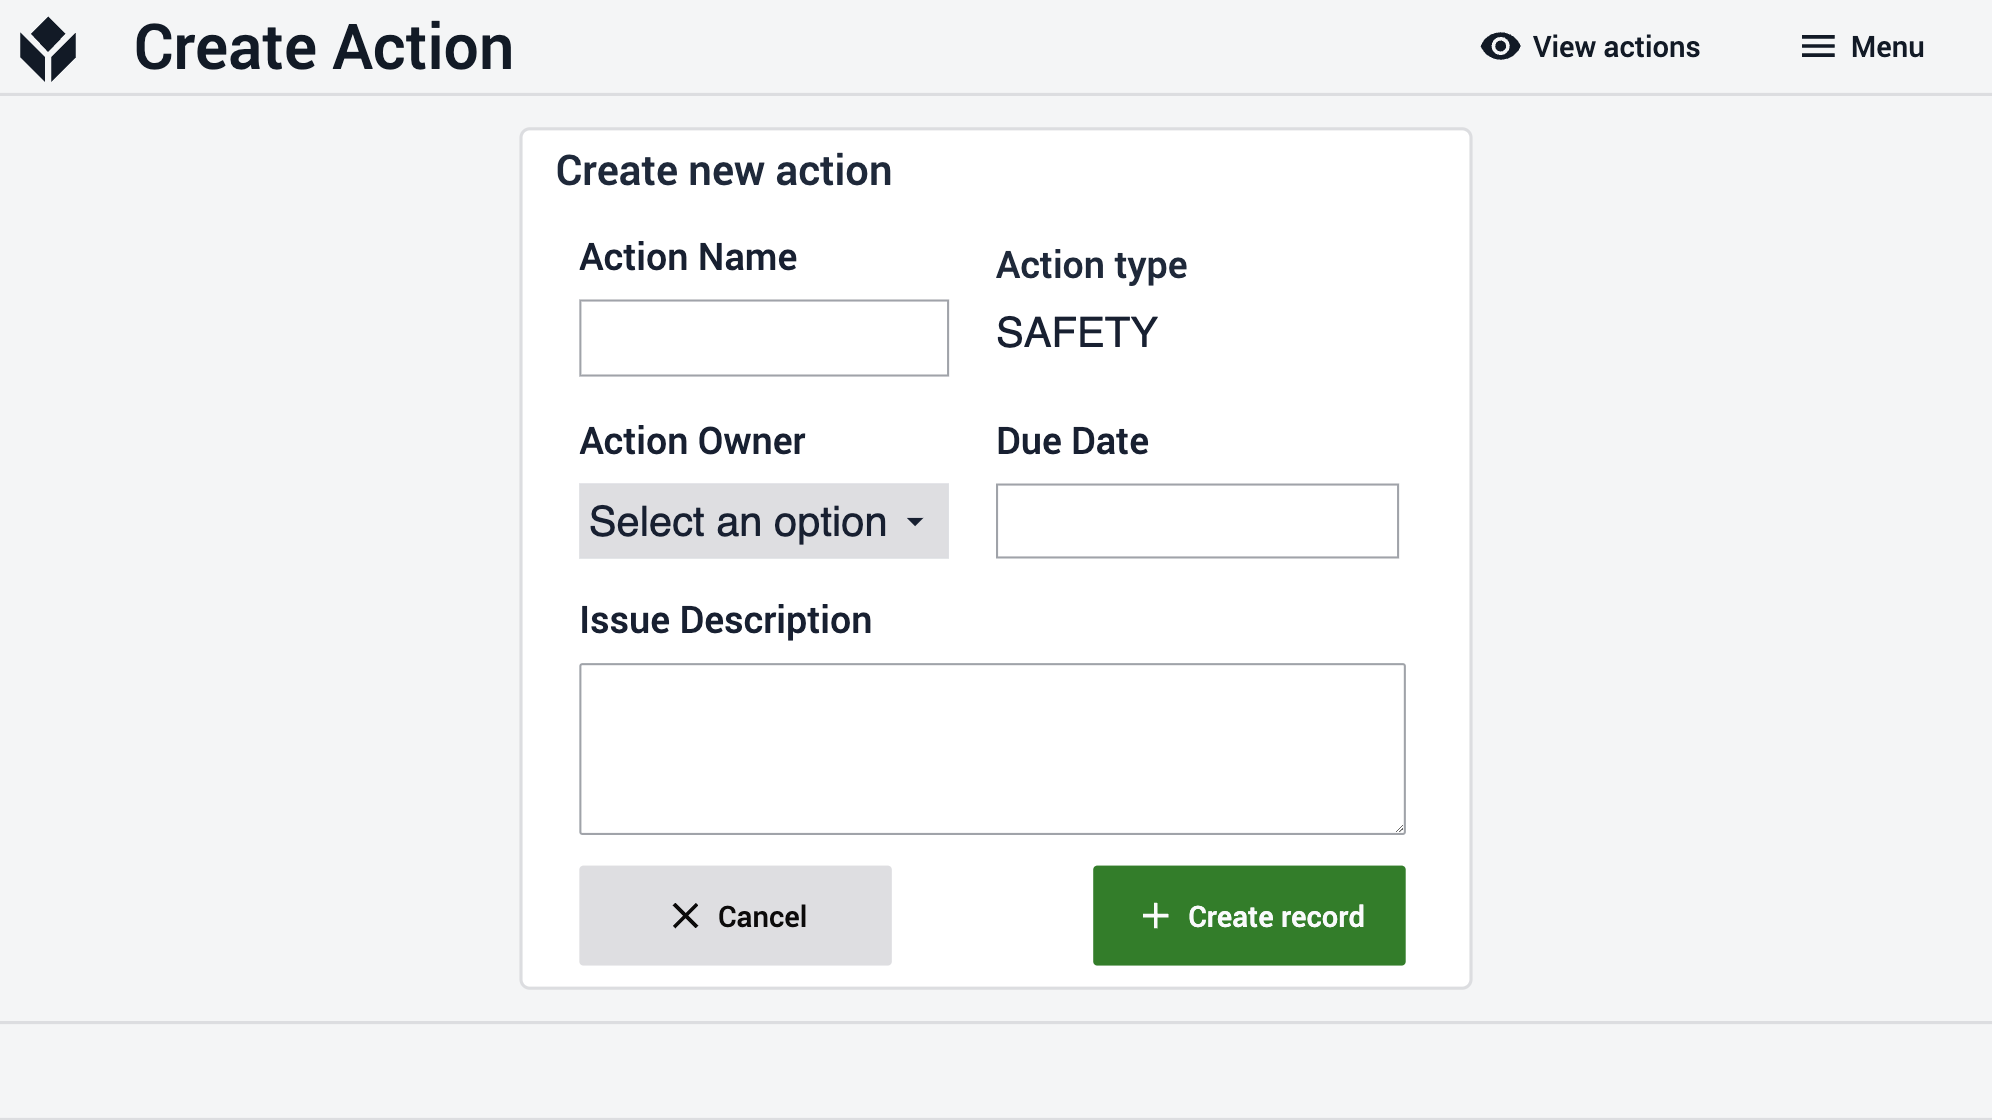
Additionally, users can escalate issues related to the metrics via an Create Action step. They can also manage these created actions directly through the application.
Usage and Value Creation
The operations management dashboard is a great way to get started for daily standups to discuss metrics (Safety, Performance, Downtime, Quality).
This can be vital for understanding issues across multiple production lines and creating clear actions based on outcomes.
Tulip Tables in the app
All the applications in the Composable MES app suite use common tables.
The Operations Management Dashboard application displays analytics that are based on data stored in Tulip Tables. The two Tulip Tables used in this application are the Actions and the Station Activity History table.
(Log) Station Activity History
- ID: Unique identifier of the historical activity record
- Station ID: ID of the station related to the historical record.
- Status: Status of the station at the time the record was created (RUNNING, DOWN, IDLE, etc)
- Start Date/Time
- End Date/Time
- Duration: Duration of the record
- Material Definition ID: Material produced during the activity.
- Target Quantity: Quantity of material expected to be produced for the duration of the record (based on target or planned cycle time).
- Actual Quantity: Quantity of material produced for the duration of the record.
- Defects: Quantity of defective material captured for the duration of the record.
- Downtime reason: Downtime collected during the historical record.
- Comments: Field tracking the user's note or comment.
- Work Order ID
- Unit ID
(Operational Artifact) Actions
- ID: Unique identifier of the historical activity record
- Material Definition ID: Material produced during the activity.
- Title: Short description to identify the nature of the action
- Location: Physical place that this action is in reference to or must be acted upon
- Severity
- Status: Current status of the action. 'New', 'In progress', 'Closed'
- Work Order ID: If applicable, the Work Order Id the action ius related to
- Unit ID: If applicable, the ID of the related material unit
- Comments: Free text to capture comments and notes related to this action, further description of the action or notes
- Photo: If applicable, related image
- Reported by: Who created the issue, useful for following up on detail by the action owner.
- Owner: Who is responsible for closing the action
- Type: Categorization of actions for filtering or analysis
- Actions Taken: If closed, what actions were taken
- Due date: When should the action be completed
Configuration and customization
In-app help
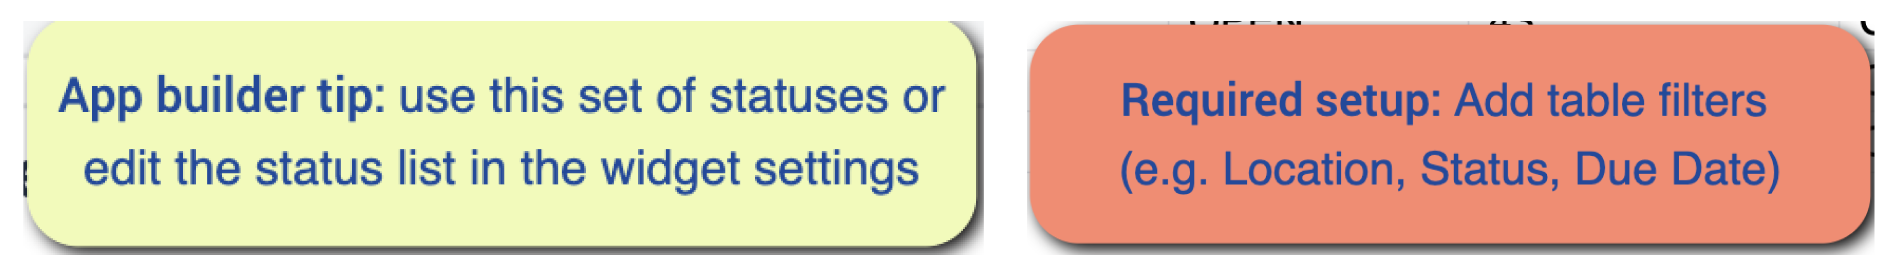
As with all applications in the Composable MES app suite, the Operations Management Dashboard app includes in-app help as well. These are short descriptions of the Required setup steps and App builder tips to support further customization. After downloading the app make sure to read these instructions and then delete them before running the application.
Tables that provide data input
To be able to use the application some tables need to be populated. Specifically, the user needs to populate the Station Activity History table to enable the analytics. This can be achieved using another Tulip app, such as the Order Execution, Andon Terminal, Machine Monitoring Terminal, or Performance Visibility Terminal applications from the Composable MES app suite. Alternatively, it can be done manually in the Tulip Table, or by importing a CSV file into the table.
Other configuration needs
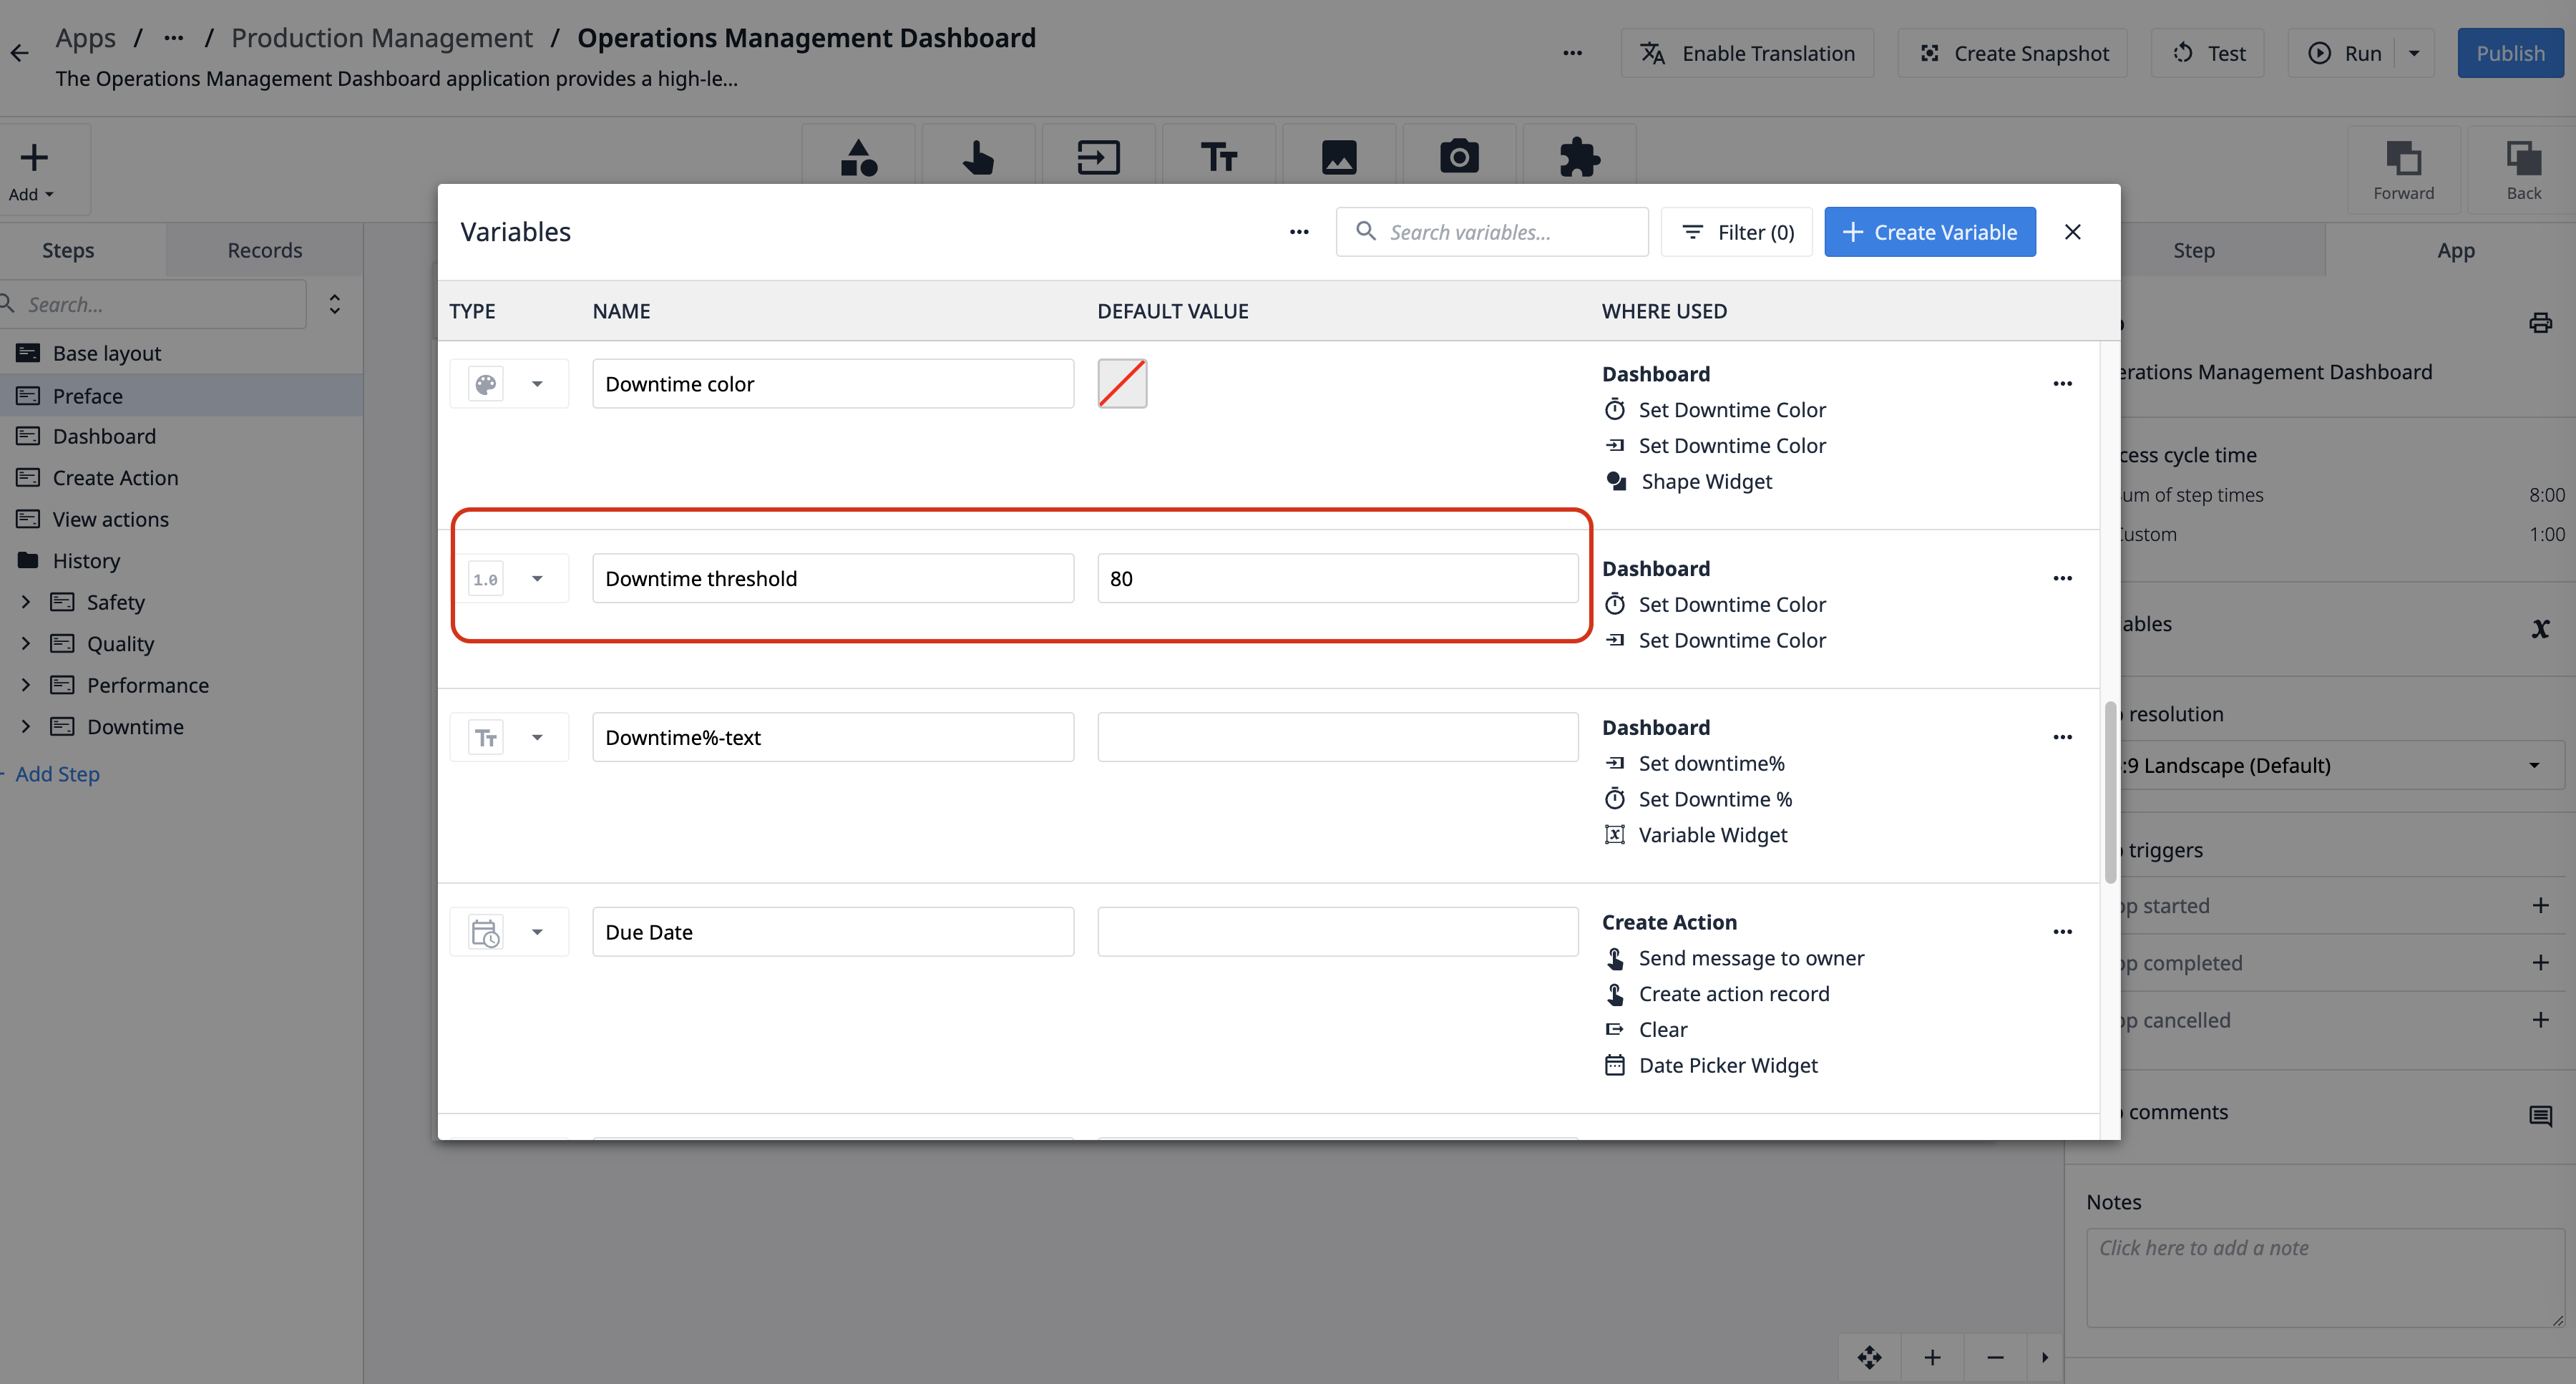
The main step of the application features a dashboard indicating whether the production's main metrics are within acceptable ranges or not. These intervals can be adjusted to match your operation's thresholds by modifying the values of assigned app variables.
If the calculated value for the Tulip Table records falls within the acceptable interval, the chart lights up in green; otherwise, it is marked in red. All analytics in this dashboard provide information about the last 24 hours. Users can view detailed metrics or historical data by clicking the buttons with little blue arrows.
Customization options
- Currently, the Action Type variable on the Create Action step is predefined by the Create Action navigation button. If you wish to modify this and include additional action types, it is recommended to replace the predefined variables with a Single Select widget. In this case, it would also be advisable to remove the trigger logic that saves the action type from the Create Action buttons.
Extended App Connections
Examples for connecting apps to work with each other
Order Execution
The Order Execution application logs station activity into the Station Activity History Table. The Operations Management Dashboard leverages this log in the analytics.
Andon Terminal
The Andon Terminal application logs station activity into the Station Activity History Table. The Operations Management Dashboard leverages this log in the analytics.
Performance Visibility Terminal
The Performance Visibility Terminal application logs station activity into the Station Activity History Table. The Operations Management Dashboard leverages this log in the analytics.
Machine Monitoring Terminal
The Machine Monitoring Terminal application logs station activity into the Station Activity History Table. The Operations Management Dashboard leverages this log in the analytics.