To download the app, visit: Library
Using the Common Data Model, calculate availability, performance, and quality of a given set of stations
Purpose
Using (log) station activity table, this dashboard step provides a clean and simple way to understand operational metrics
Setup
For setup, this dashboard assumes that you are already populating the (log) station activity table. Several library apps make use of this standard table. They are listed below:
- Performance Visibility Scorecard
- Centralized Performance Visibility Scorecard
- Hourly Production Scorecard
- and others
Calculations and Assumptions
Availability
Availability is defined as the % of time the station is running compared to the total time the station is scheduled or on.
High-level expression used in the dashboard below:
In the dashboard, the following expression is used:
round(
(link(
sumfiltered(
interval_to_seconds(@(Log) Station Activity History Duration ), @(Log) Station Activity History Status  = 'RUNNING'), 0) / (sum(interval_to_seconds(@(Log) Station Activity History Duration ))

- link(
sumfiltered(
interval_to_seconds(@(Log) Station Activity History Duration ), @(Log) Station Activity History Status  = 'OFF'), 0))) * 100, 1)
Performance
Performance is defined as the % of products made as compared to the goal number of products made in a given time interval
High-level expression used in the dashboard below:
In the dashboard, we use the following expression:
round(
((link(
sum(
@(Log) Station Activity History Actual ), 0) + link(sum(@(Log) Station Activity History Defects ), 0))

/ link(sum(@(Log) Station Activity History Target ), 0)) * 100, 1)
Quality
Quality is defined as the % of products that pass quality check as compared to all products made.
High-level expression used in the dashboard below:
In the dashboard, we use the following expression:
round((sum(@(Log) Station Activity History Actual ) / (sum(@(Log) Station Activity History Defects ) + sum(@(Log) Station Activity History Actual ))) * 100, 1)
"OEE"
Typically, OEE (Overall Equipment Effectiveness) is a very machine-centric view. In this, we are using similar metrics but are thinking about OEE more holistically across the operator and station.
OEE is Availability * Performance * Quality
In the dashboard, we combine all three expressions into a single expression
App Structure and Assumptions
The analytics include the following assumptions:
Datetime Filtering
The analytics are filtered for "All Time" this can be easily changed with the screenshot below:
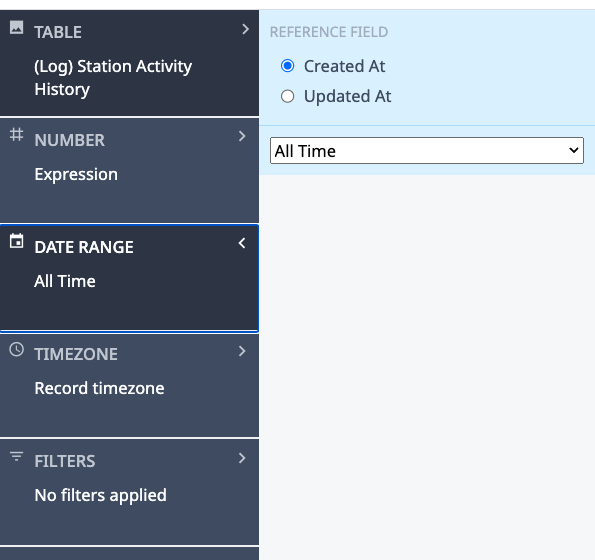
Additional filtering can also be applied at the analytic level
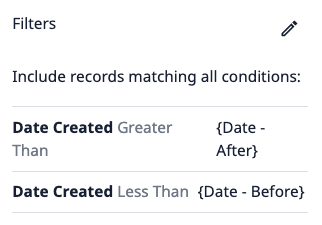
Filters
On the other hand, you may not want to filter analytics at the analytic level but may want to filter differently app by app. You can add filters to each step here. We have included an example step filtering analytics as well:
Computation
For Availability, run time is calculated as duration when status is RUNNING and does not include any time status if OFF. This may need to be changed based upon specific implementation
Table Usage
The table (Log) Station Activity History is used for all analytics. The unique identifier is: aKzvoscgHCyd2CRu3_DEFAULT
This table is available on several library apps relating to production management solution