To download the app, visit: Library
This Article summarizes how the Hourly Production Scorecard application is structured and built.
In the application, the user can log production events to a Tulip Table and view the hourly scorecard of the station.
Tables Used
The table used in the application is called Station Activity History. Each record in the table is a station activity event that has a status. When using the application, data is logged in this table. The user can view the analysis of the table’s data on the Analytics step.
Fields of Station Activity History:
ID: the unique identifier of each event
Hour Block: the hour where the event occurred, can be used to create hourly scorecards
Status: the status of the event e.g.: RUNNING, DOWN, OFF
Downtime reason: if the status of the event is DOWN, the user can select the reason for the downtime which will be stored in the downtime reason field of the record
Duration: the time interval of the event
Station: the station on the shop floor where the event occurred
Actual: number of good parts produced during the event
Target: a target number of products that is calculated automatically from the duration and the event and the manually predefined production rate
Defects: number of bad parts produced during the event
Product ID: the unique identifier for the product type produced during the event
App Structure
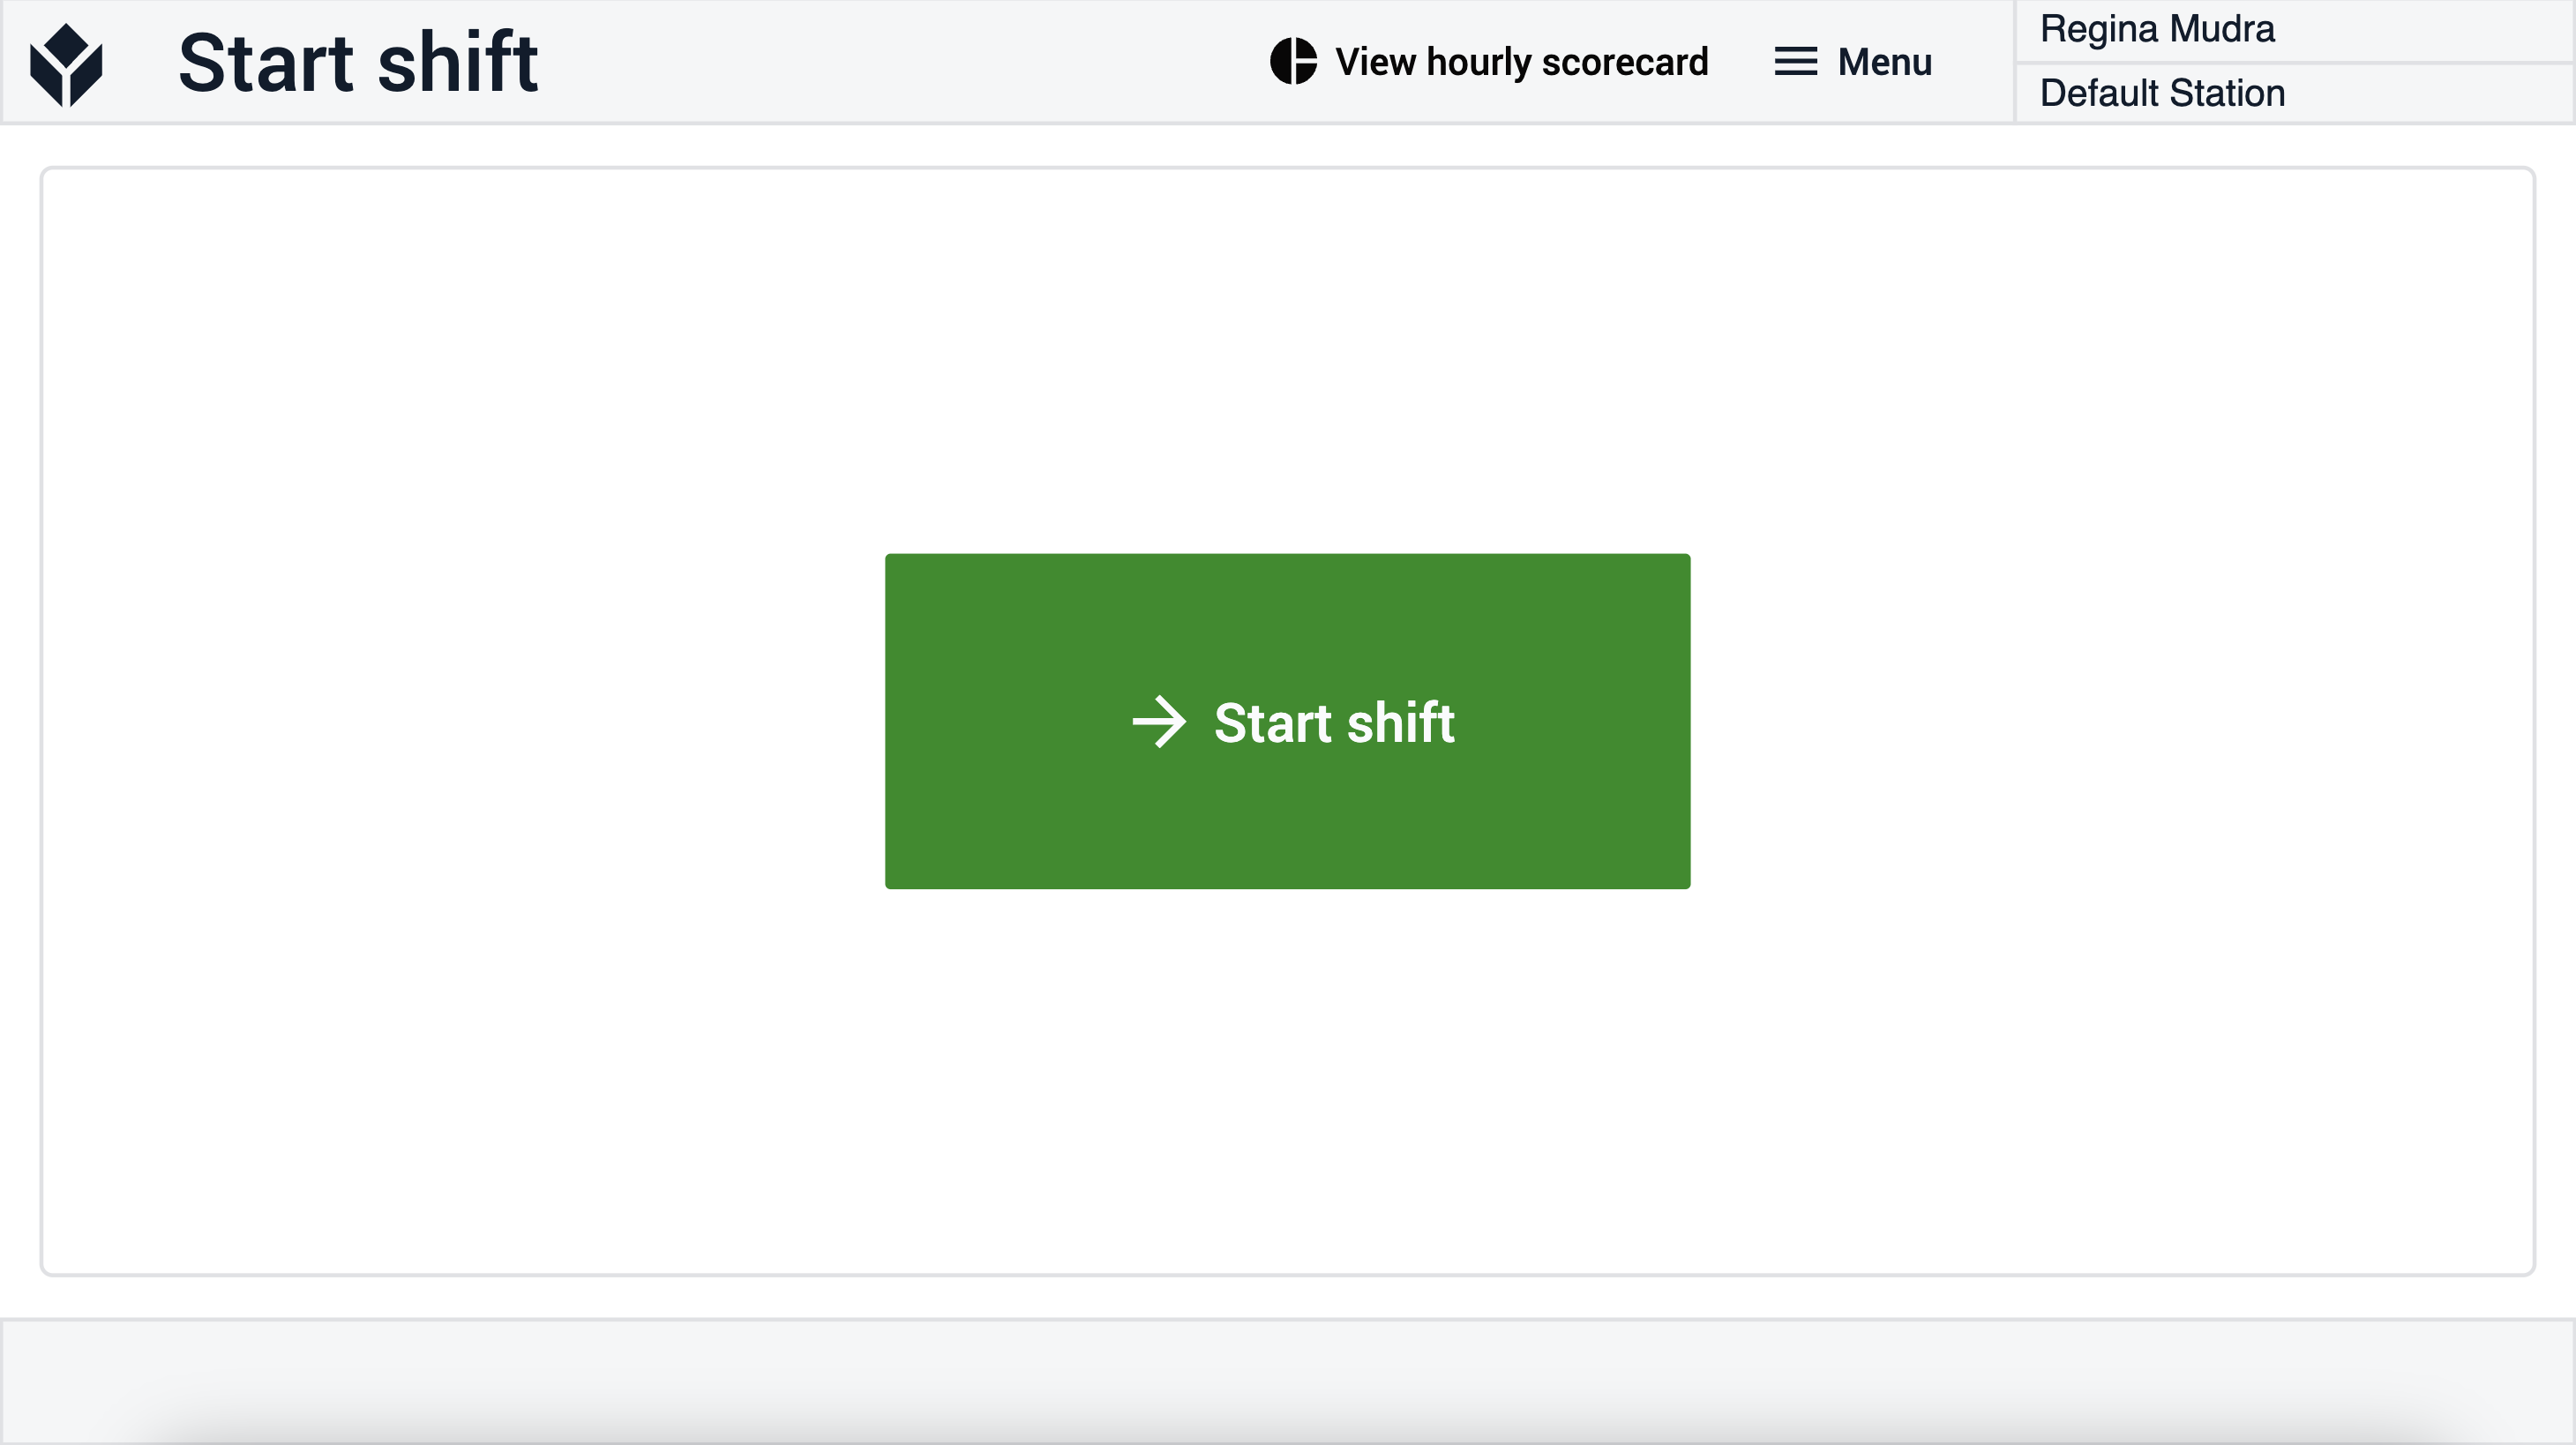
The Start Shift step is the first step of the application where you can start your shift.
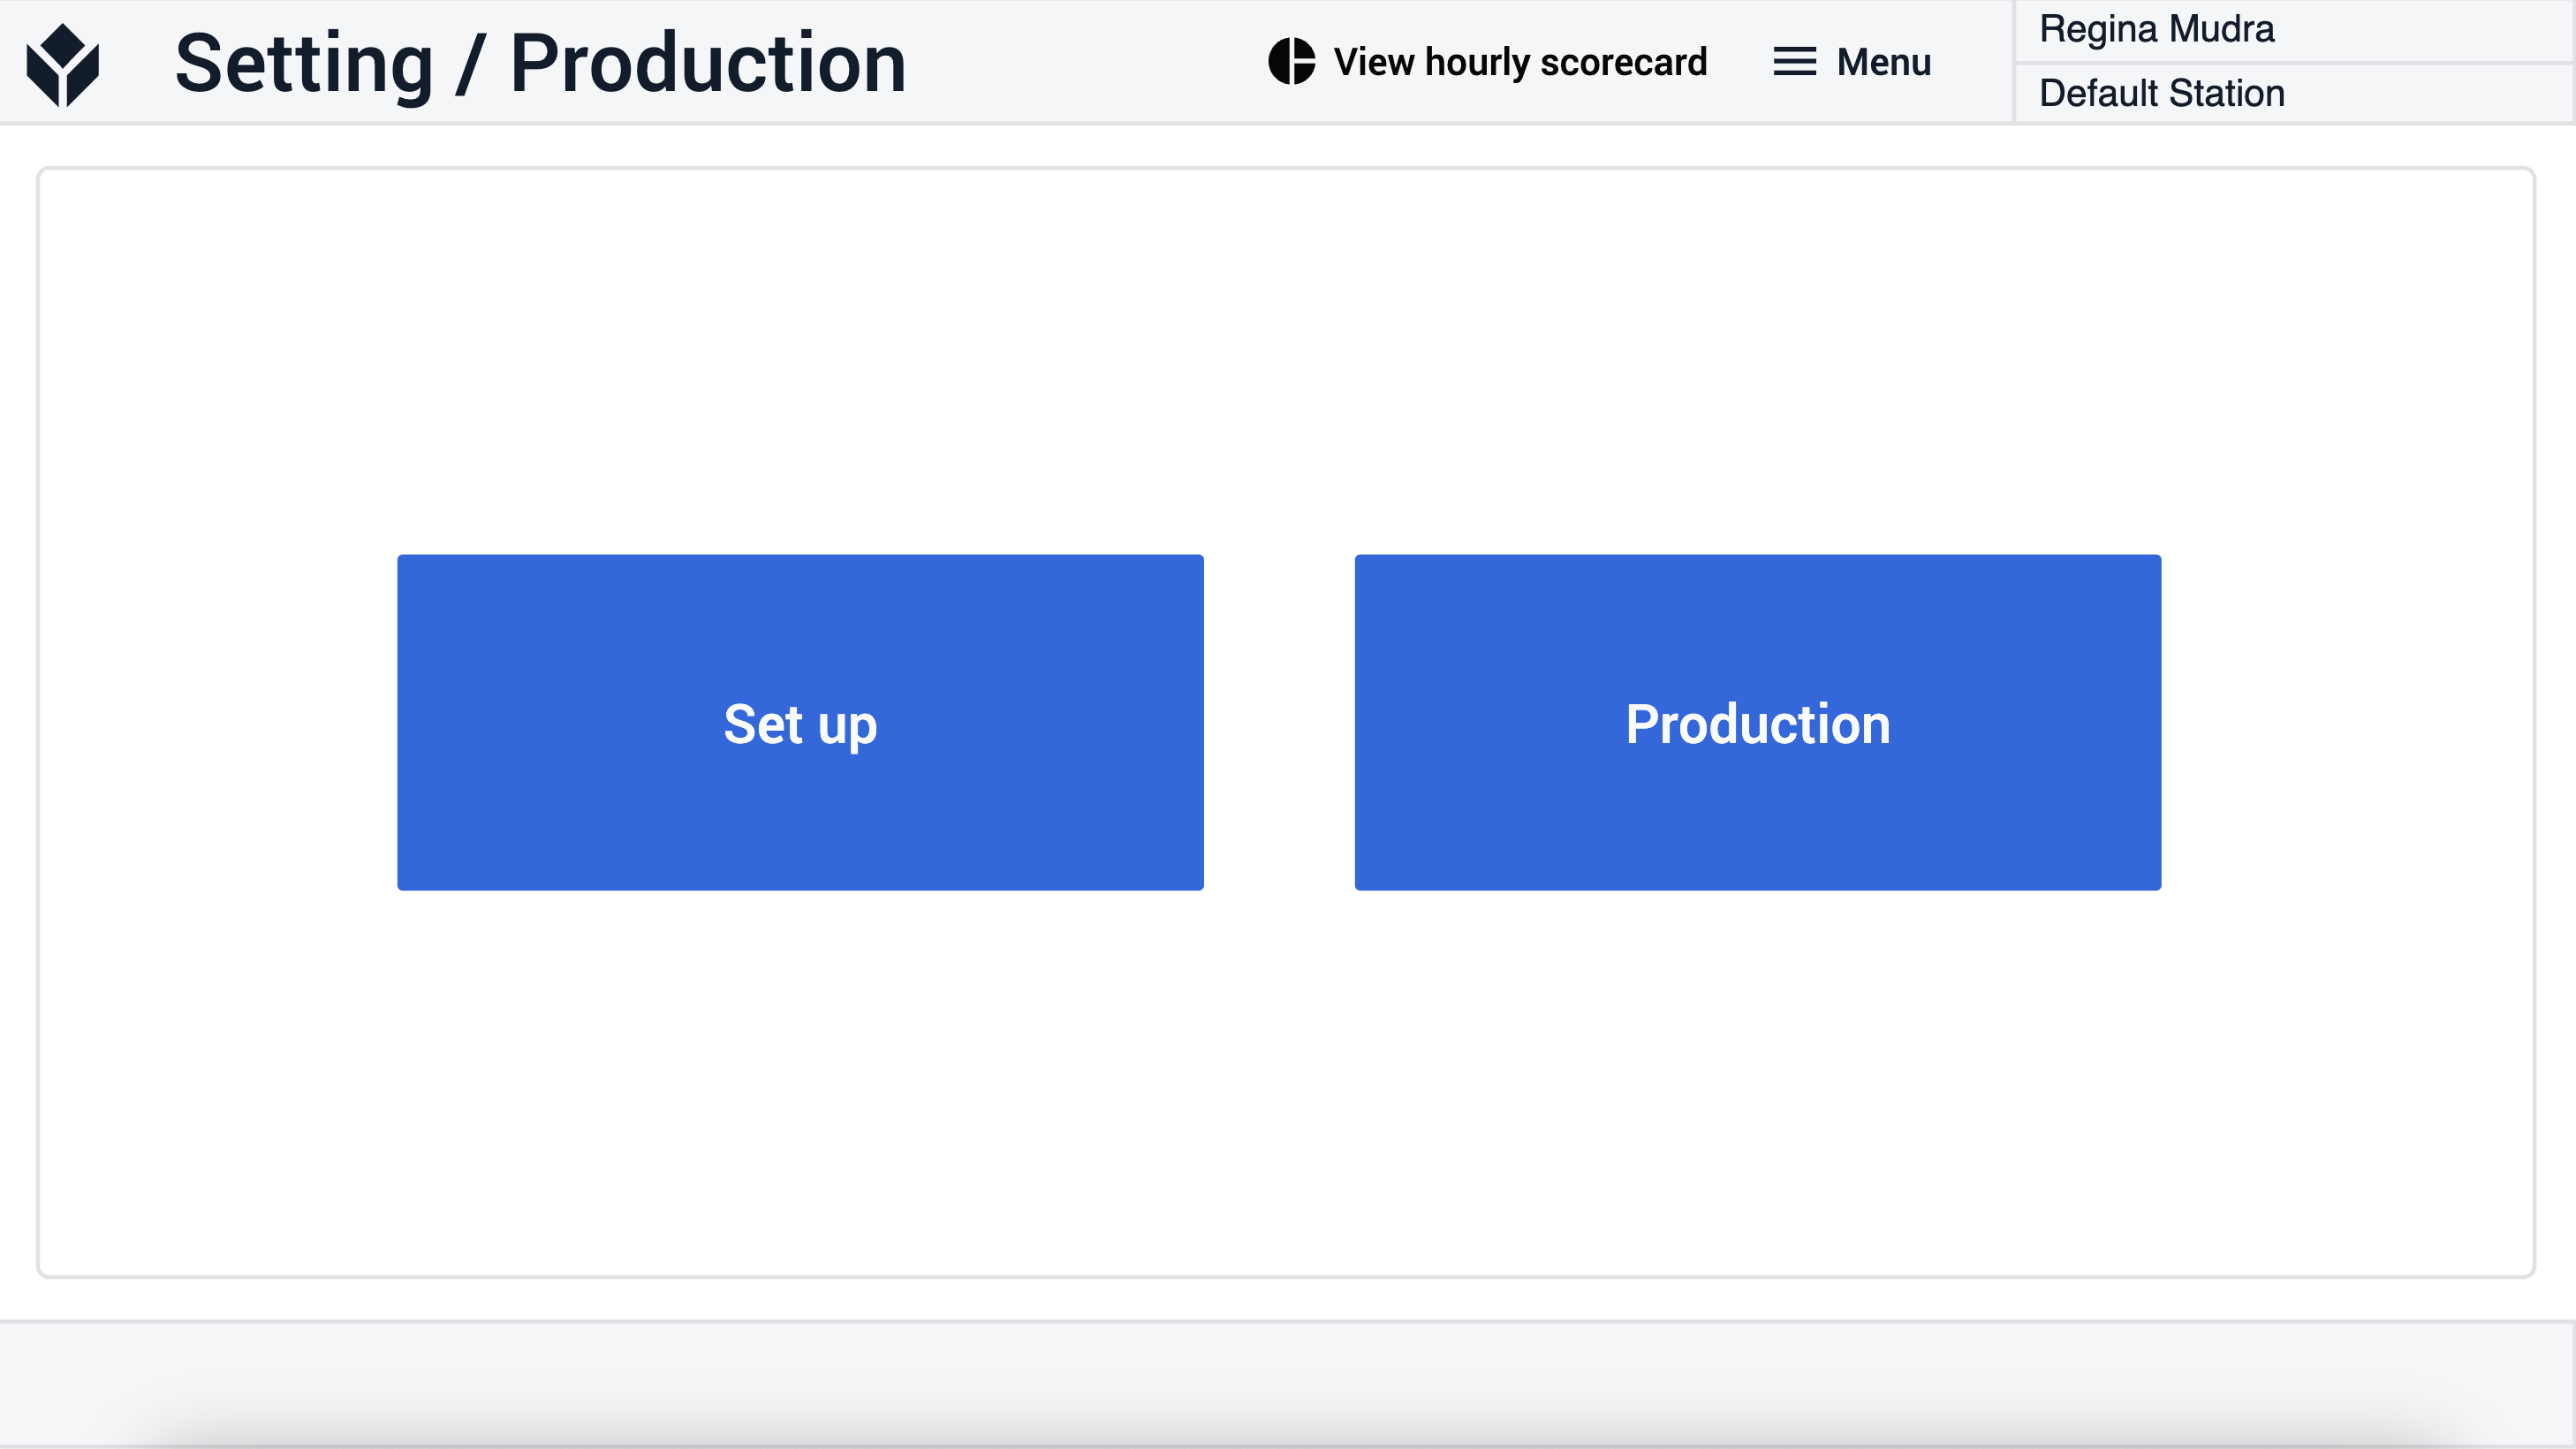
On the Setting/Production step, the user can decide to set up the machine or start production immediately. The Set up button will navigate you to the Setting in Progress step, whereas the Production button would navigate you to the Select Product step.
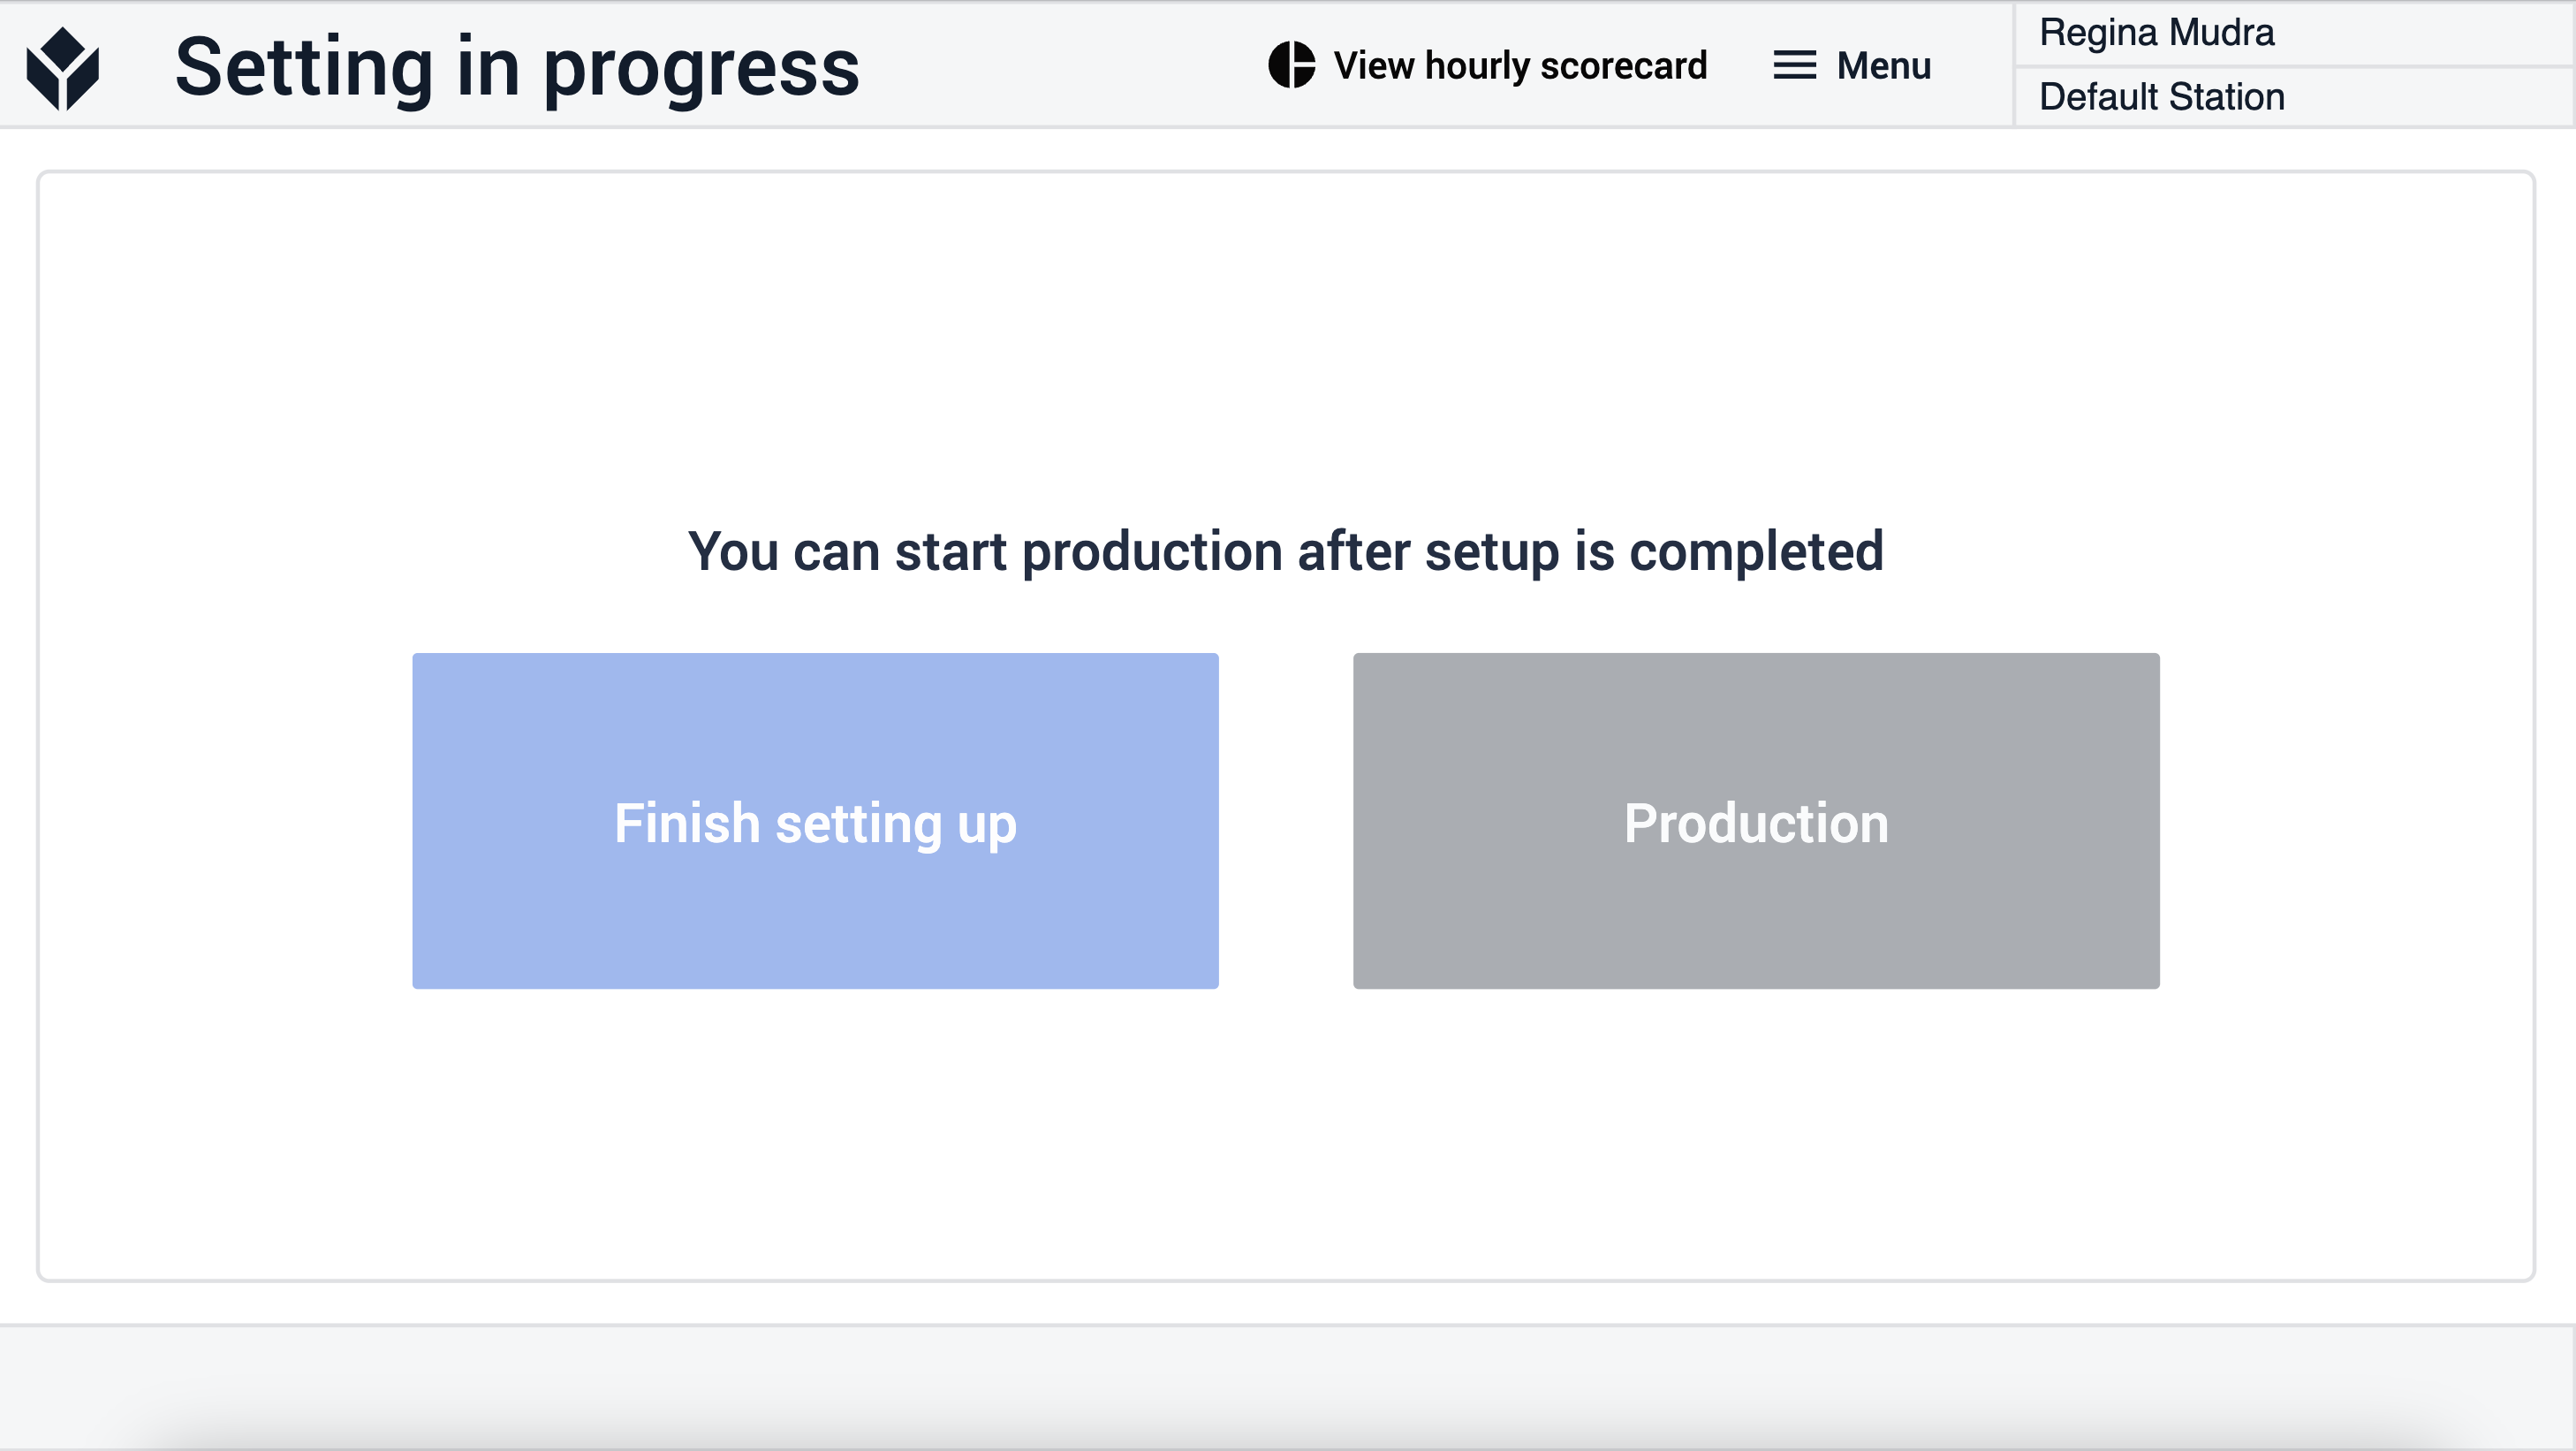
On the Setting in progress step the user has to select the Finish setting up button to log that the setup is done. The application will navigate to user back to the Setting/Production step so that they can choose to start Production.
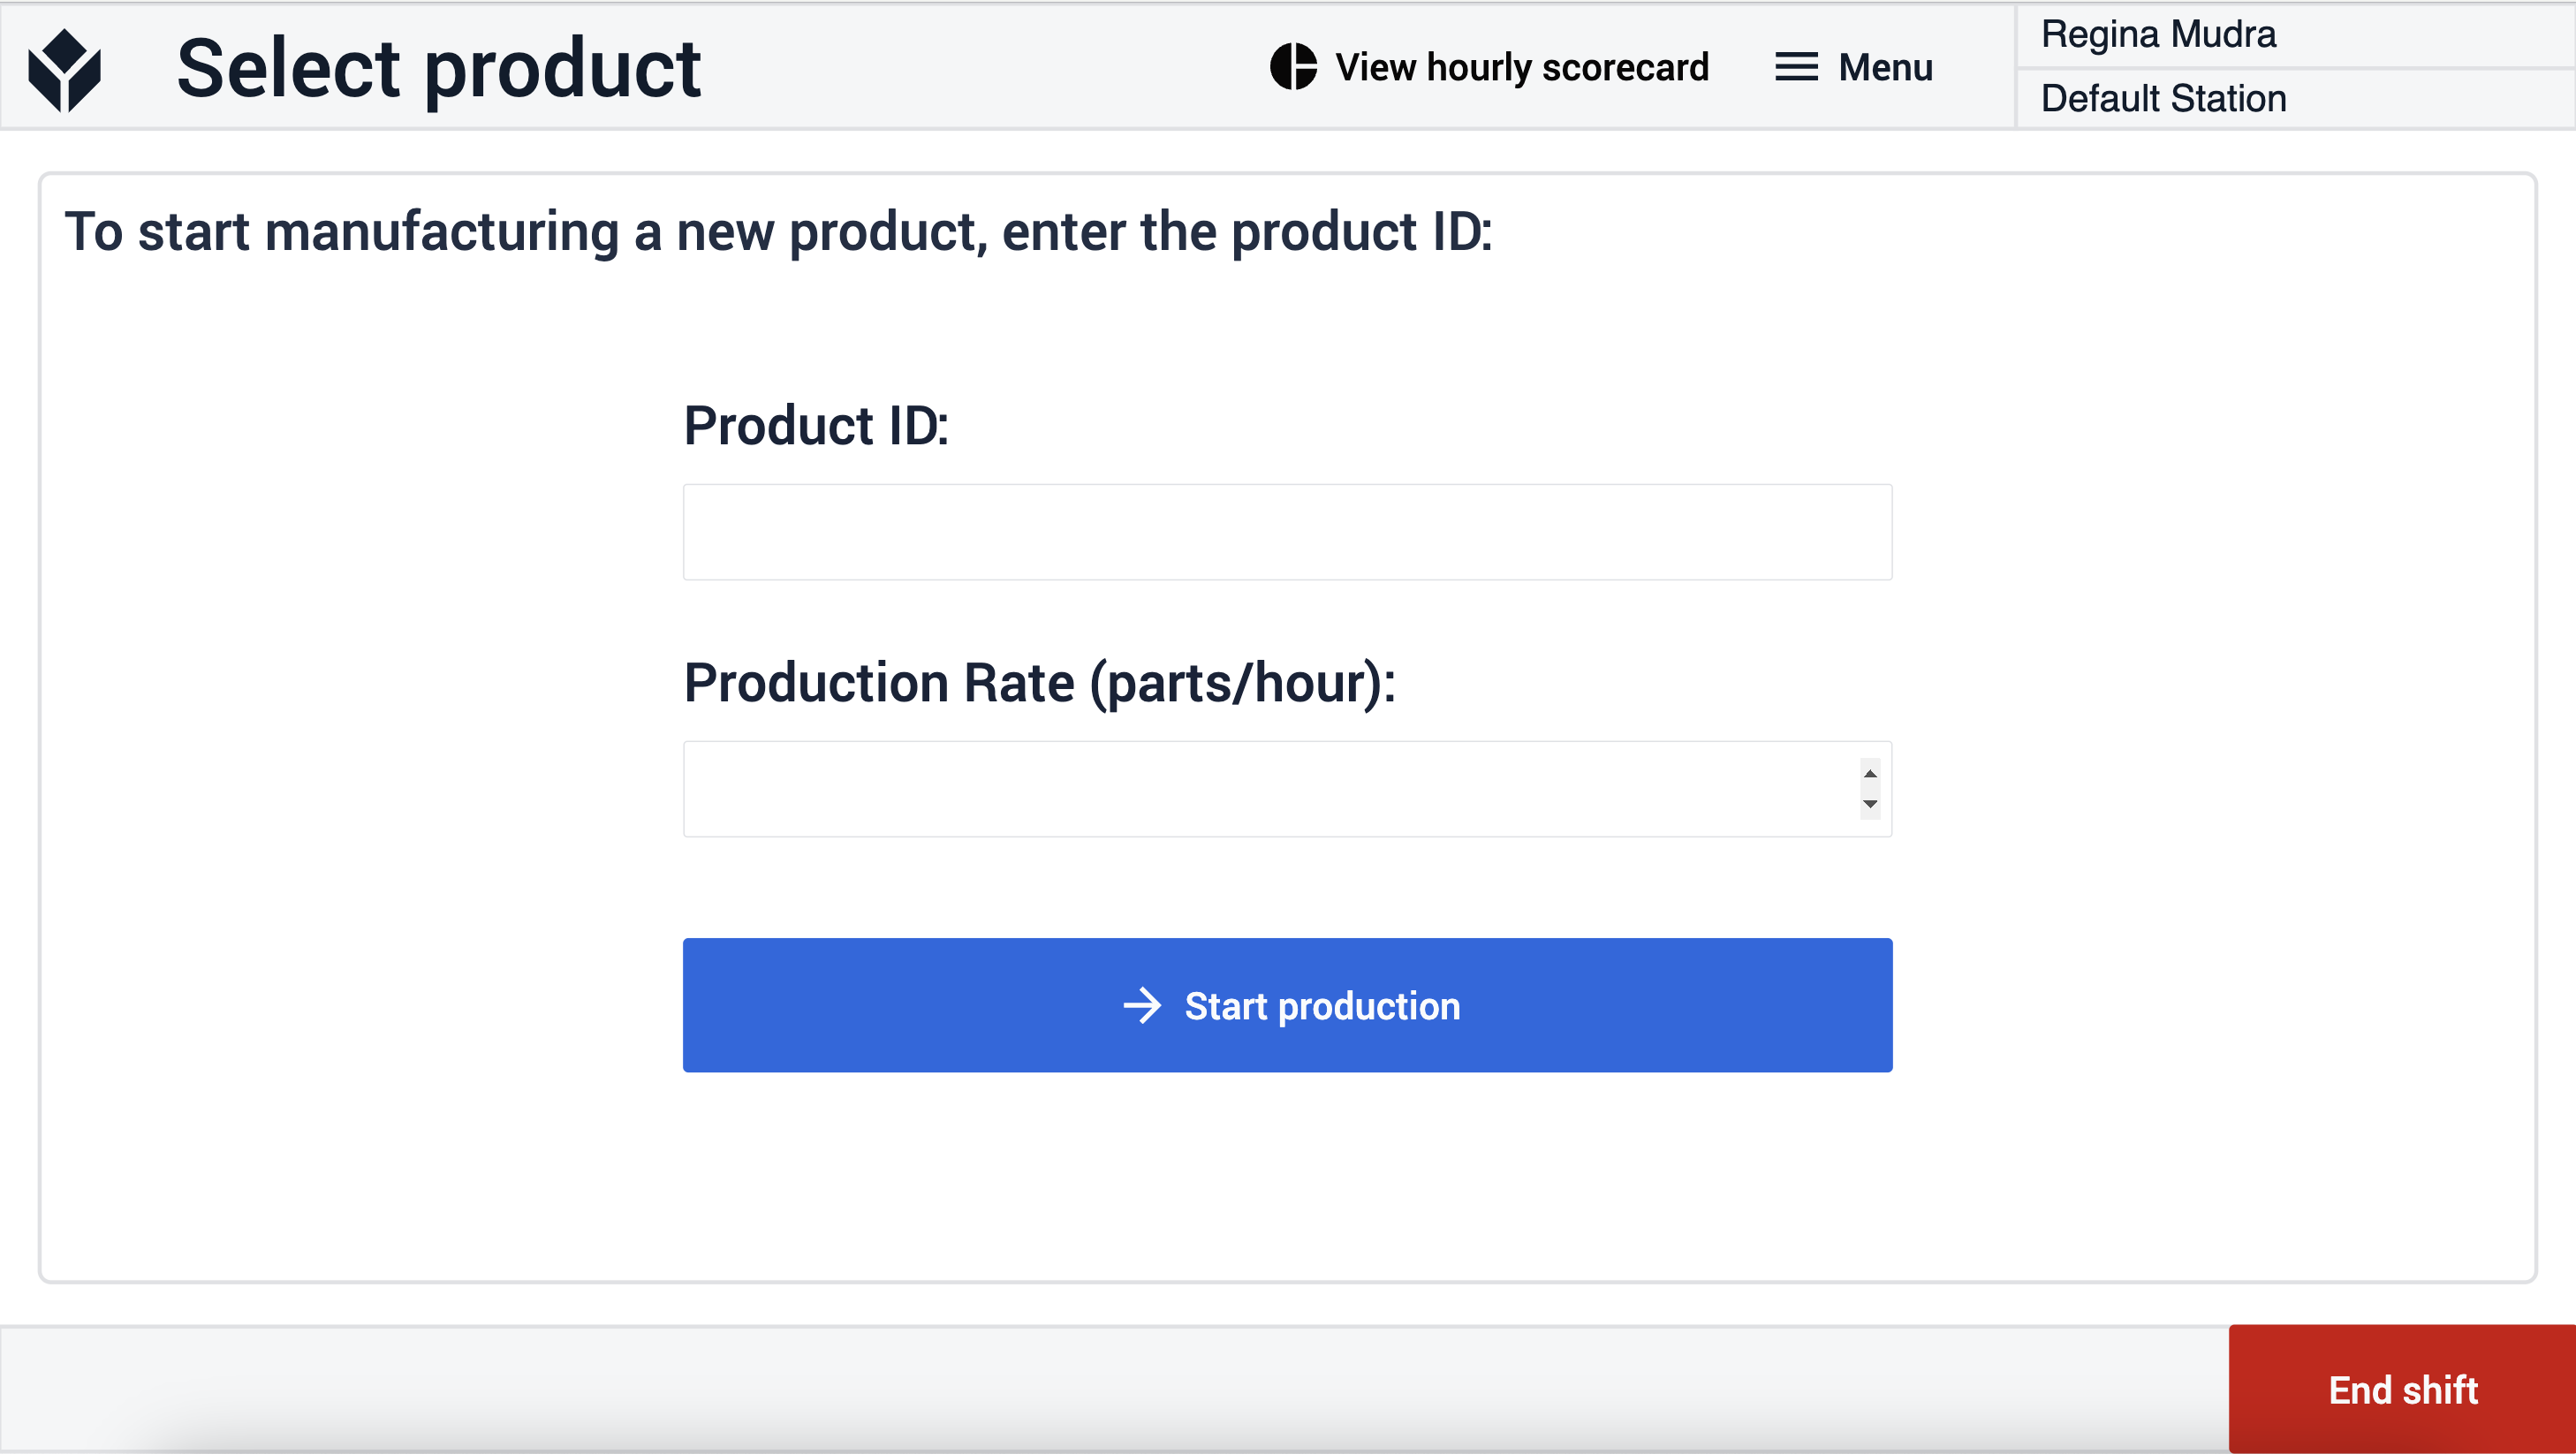
On the Select Product step, the user has to enter the product ID and the production rate. If the values are entered it is possible to start production.
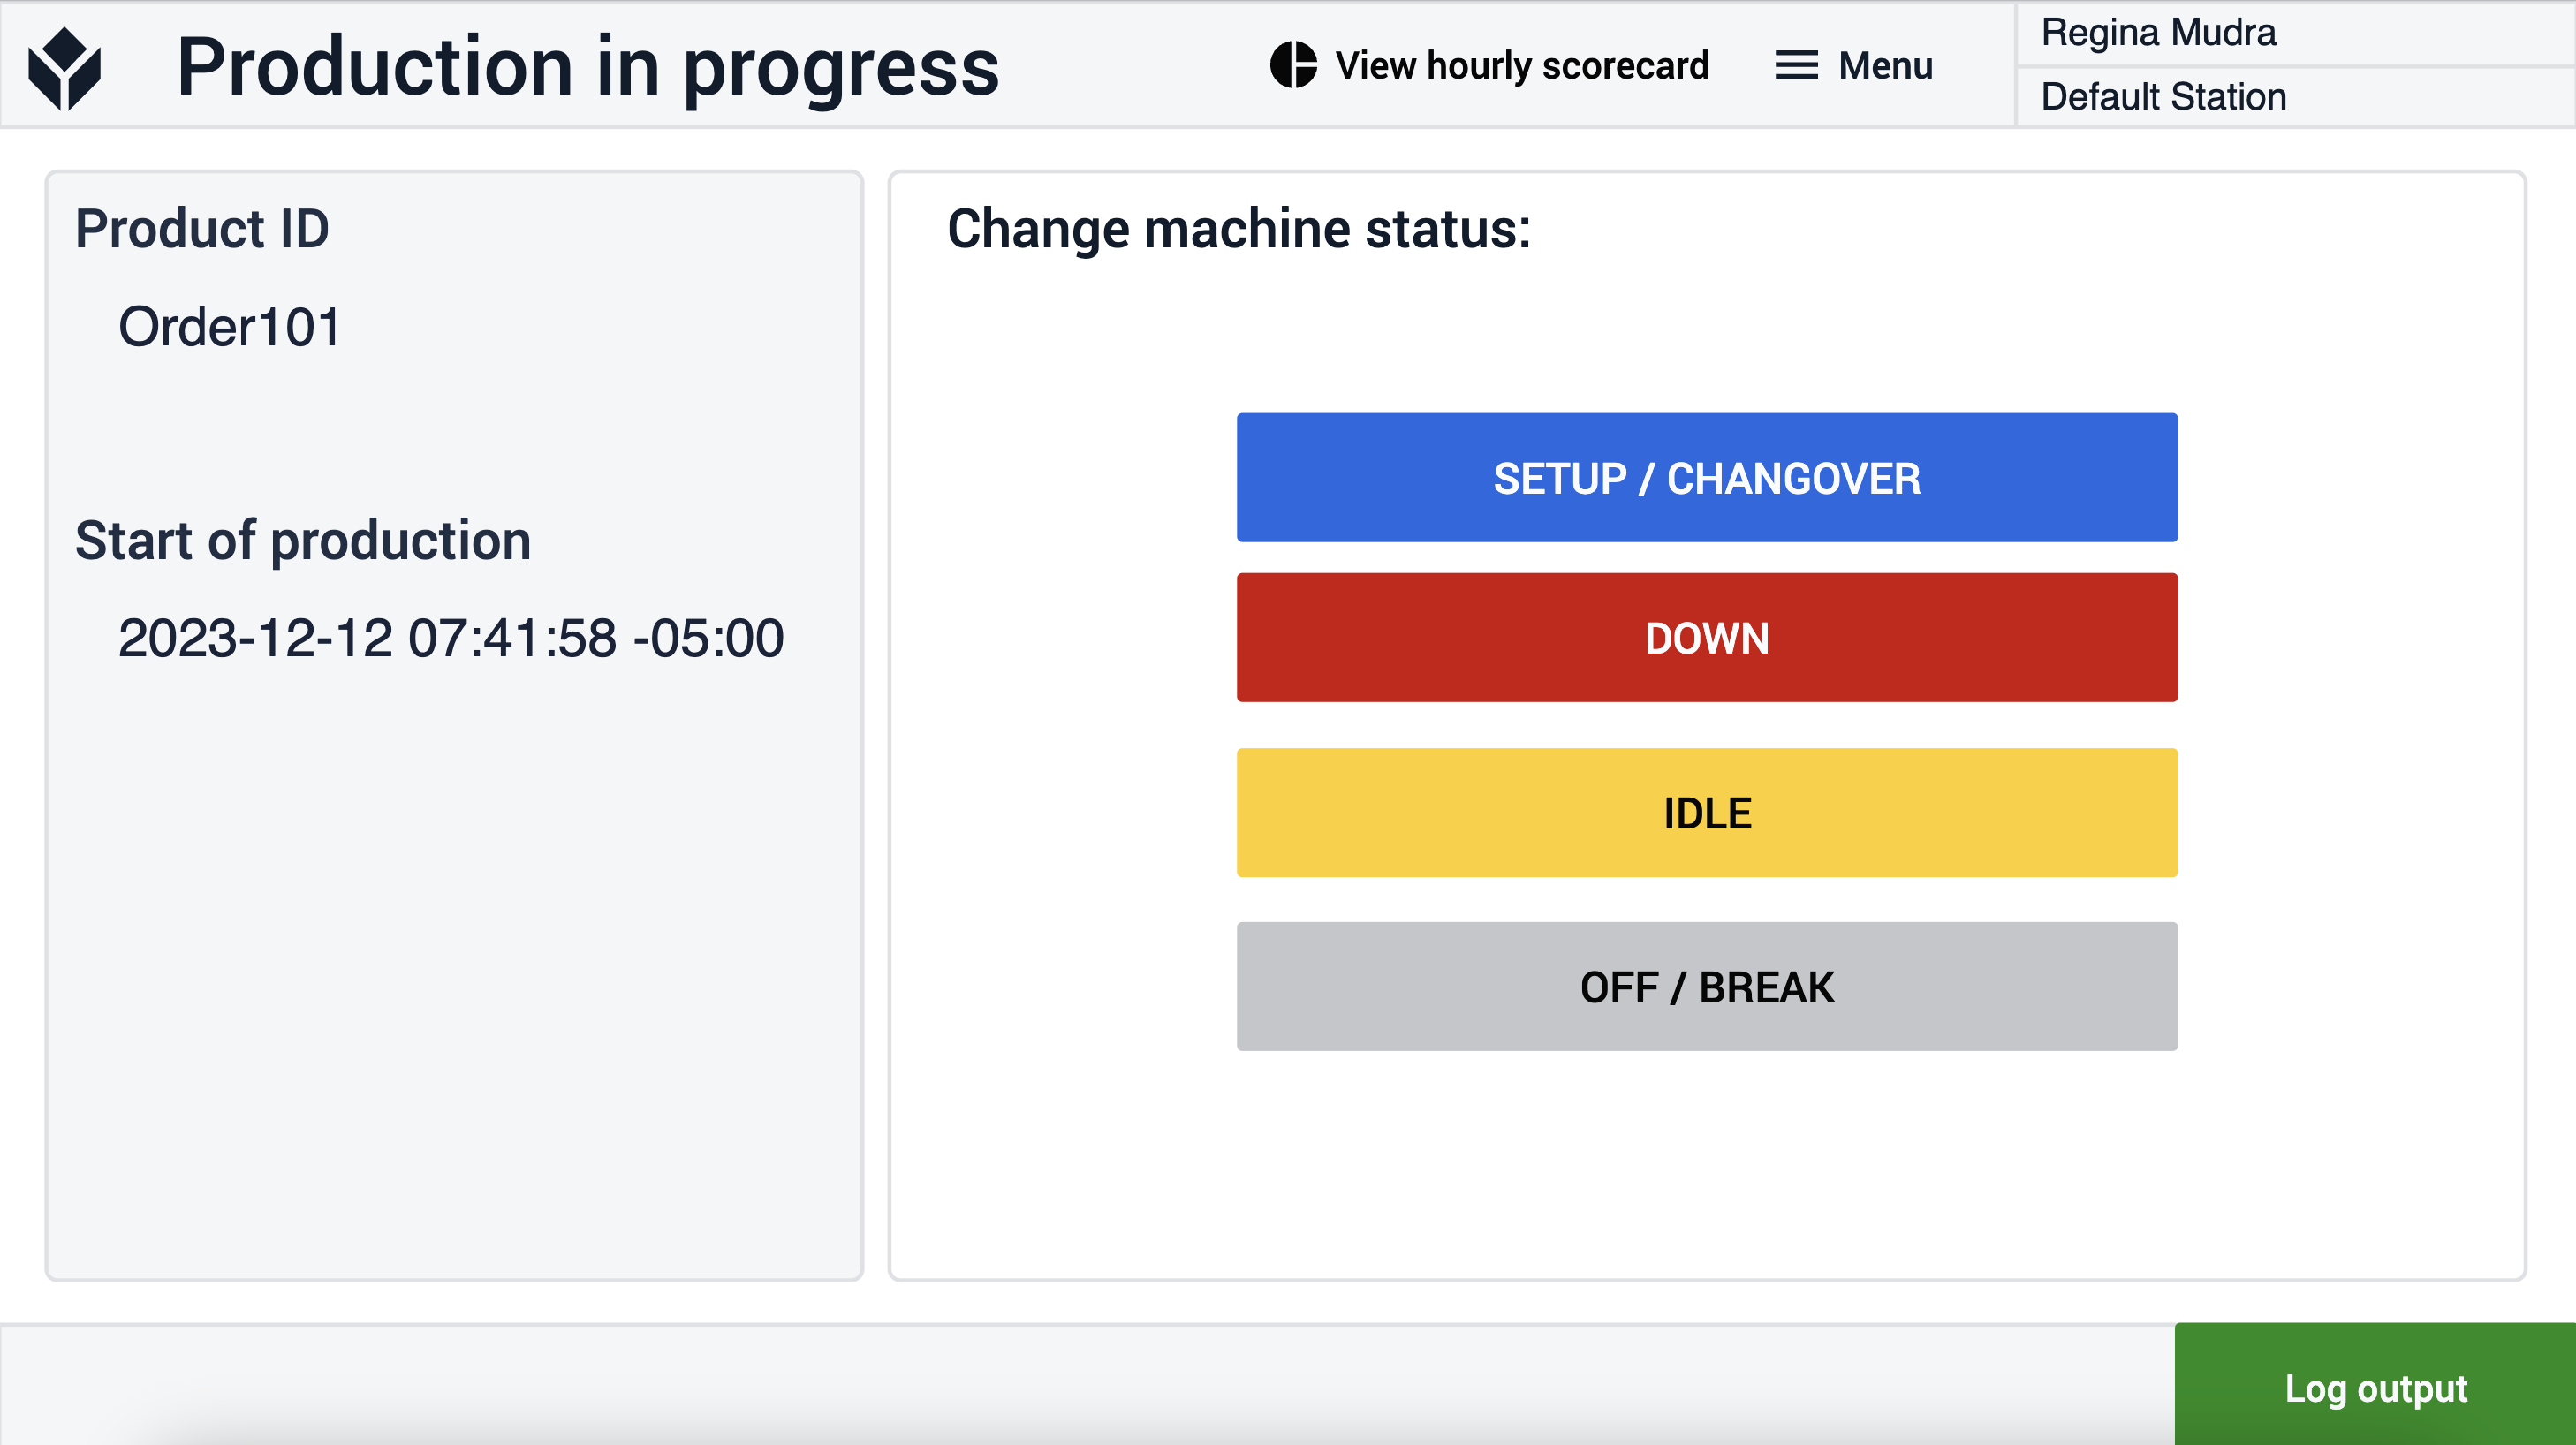
On the Production in progress step, the Product ID and the time of production start are displayed for the operator. When production has to be interrupted the user needs to select the reason for the interruption. That means to end of the production event and the start of a downtime event. If the operator would like to log good and bad products they need to click on the green Log output button.
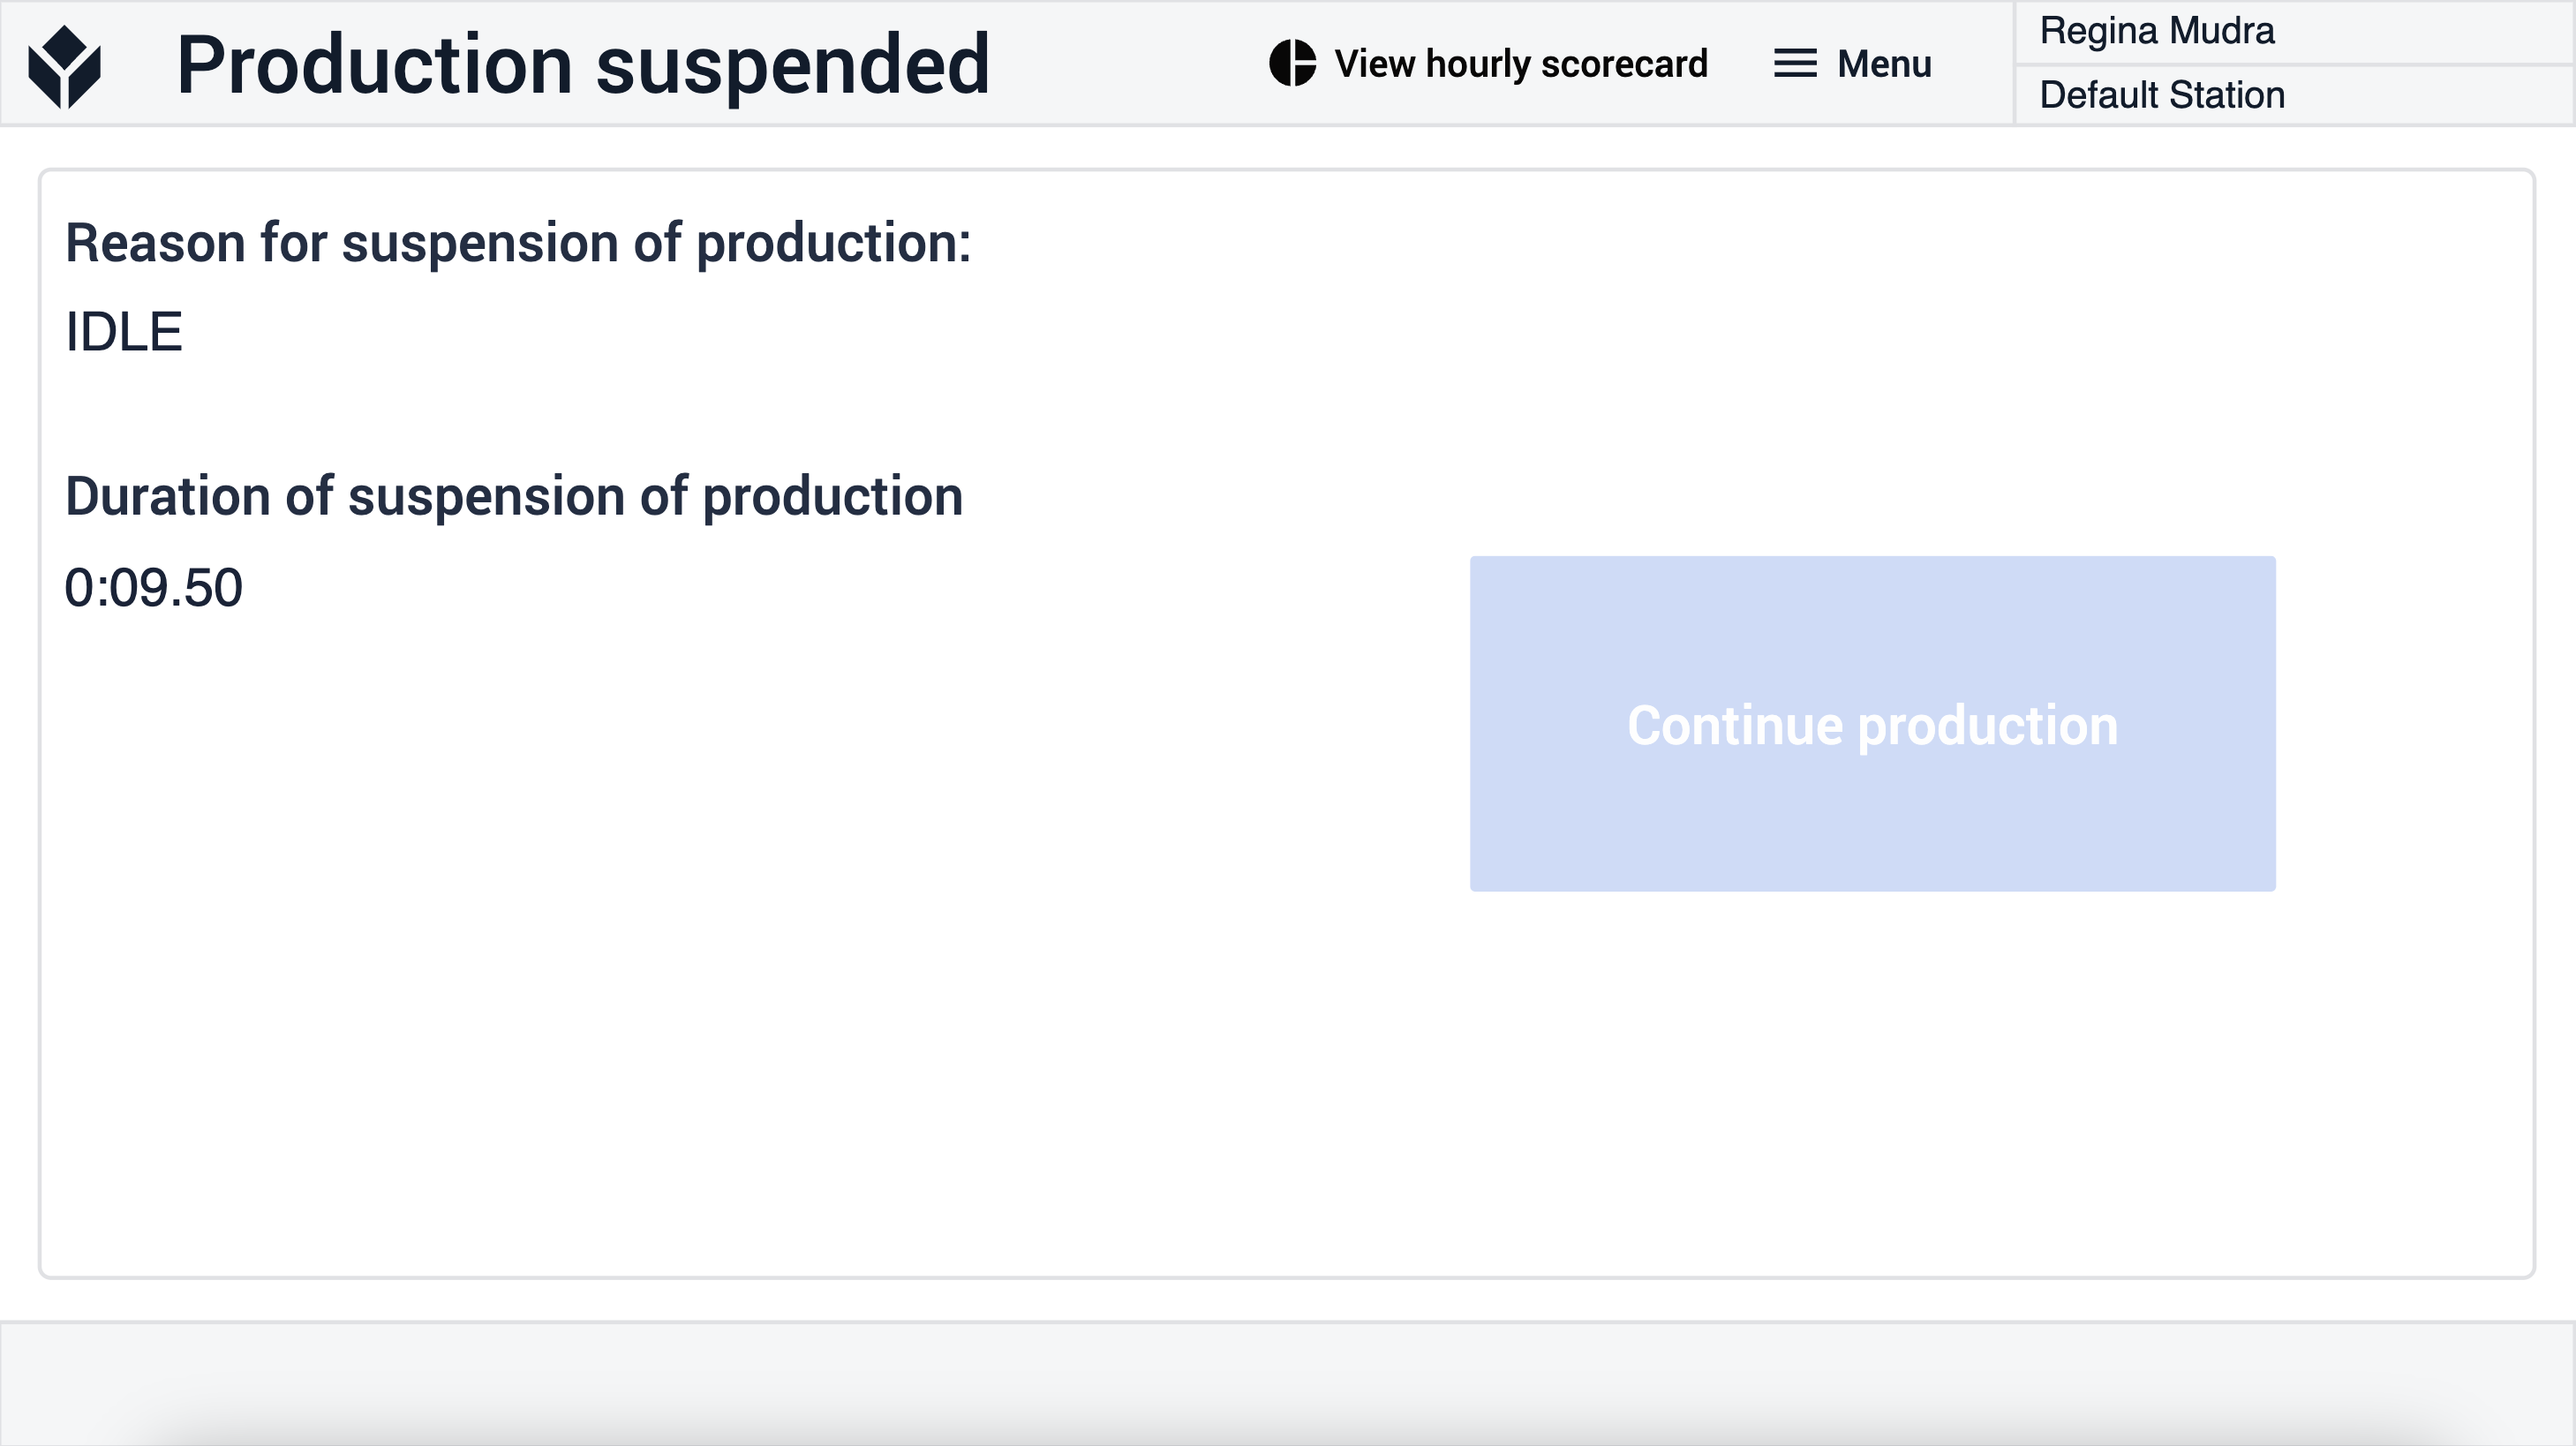
If the user selects any downtime reasons on the Production in Progress step, the application navigates to the Production Suspended step. To end the downtime event the user has to click on the Continue production button.
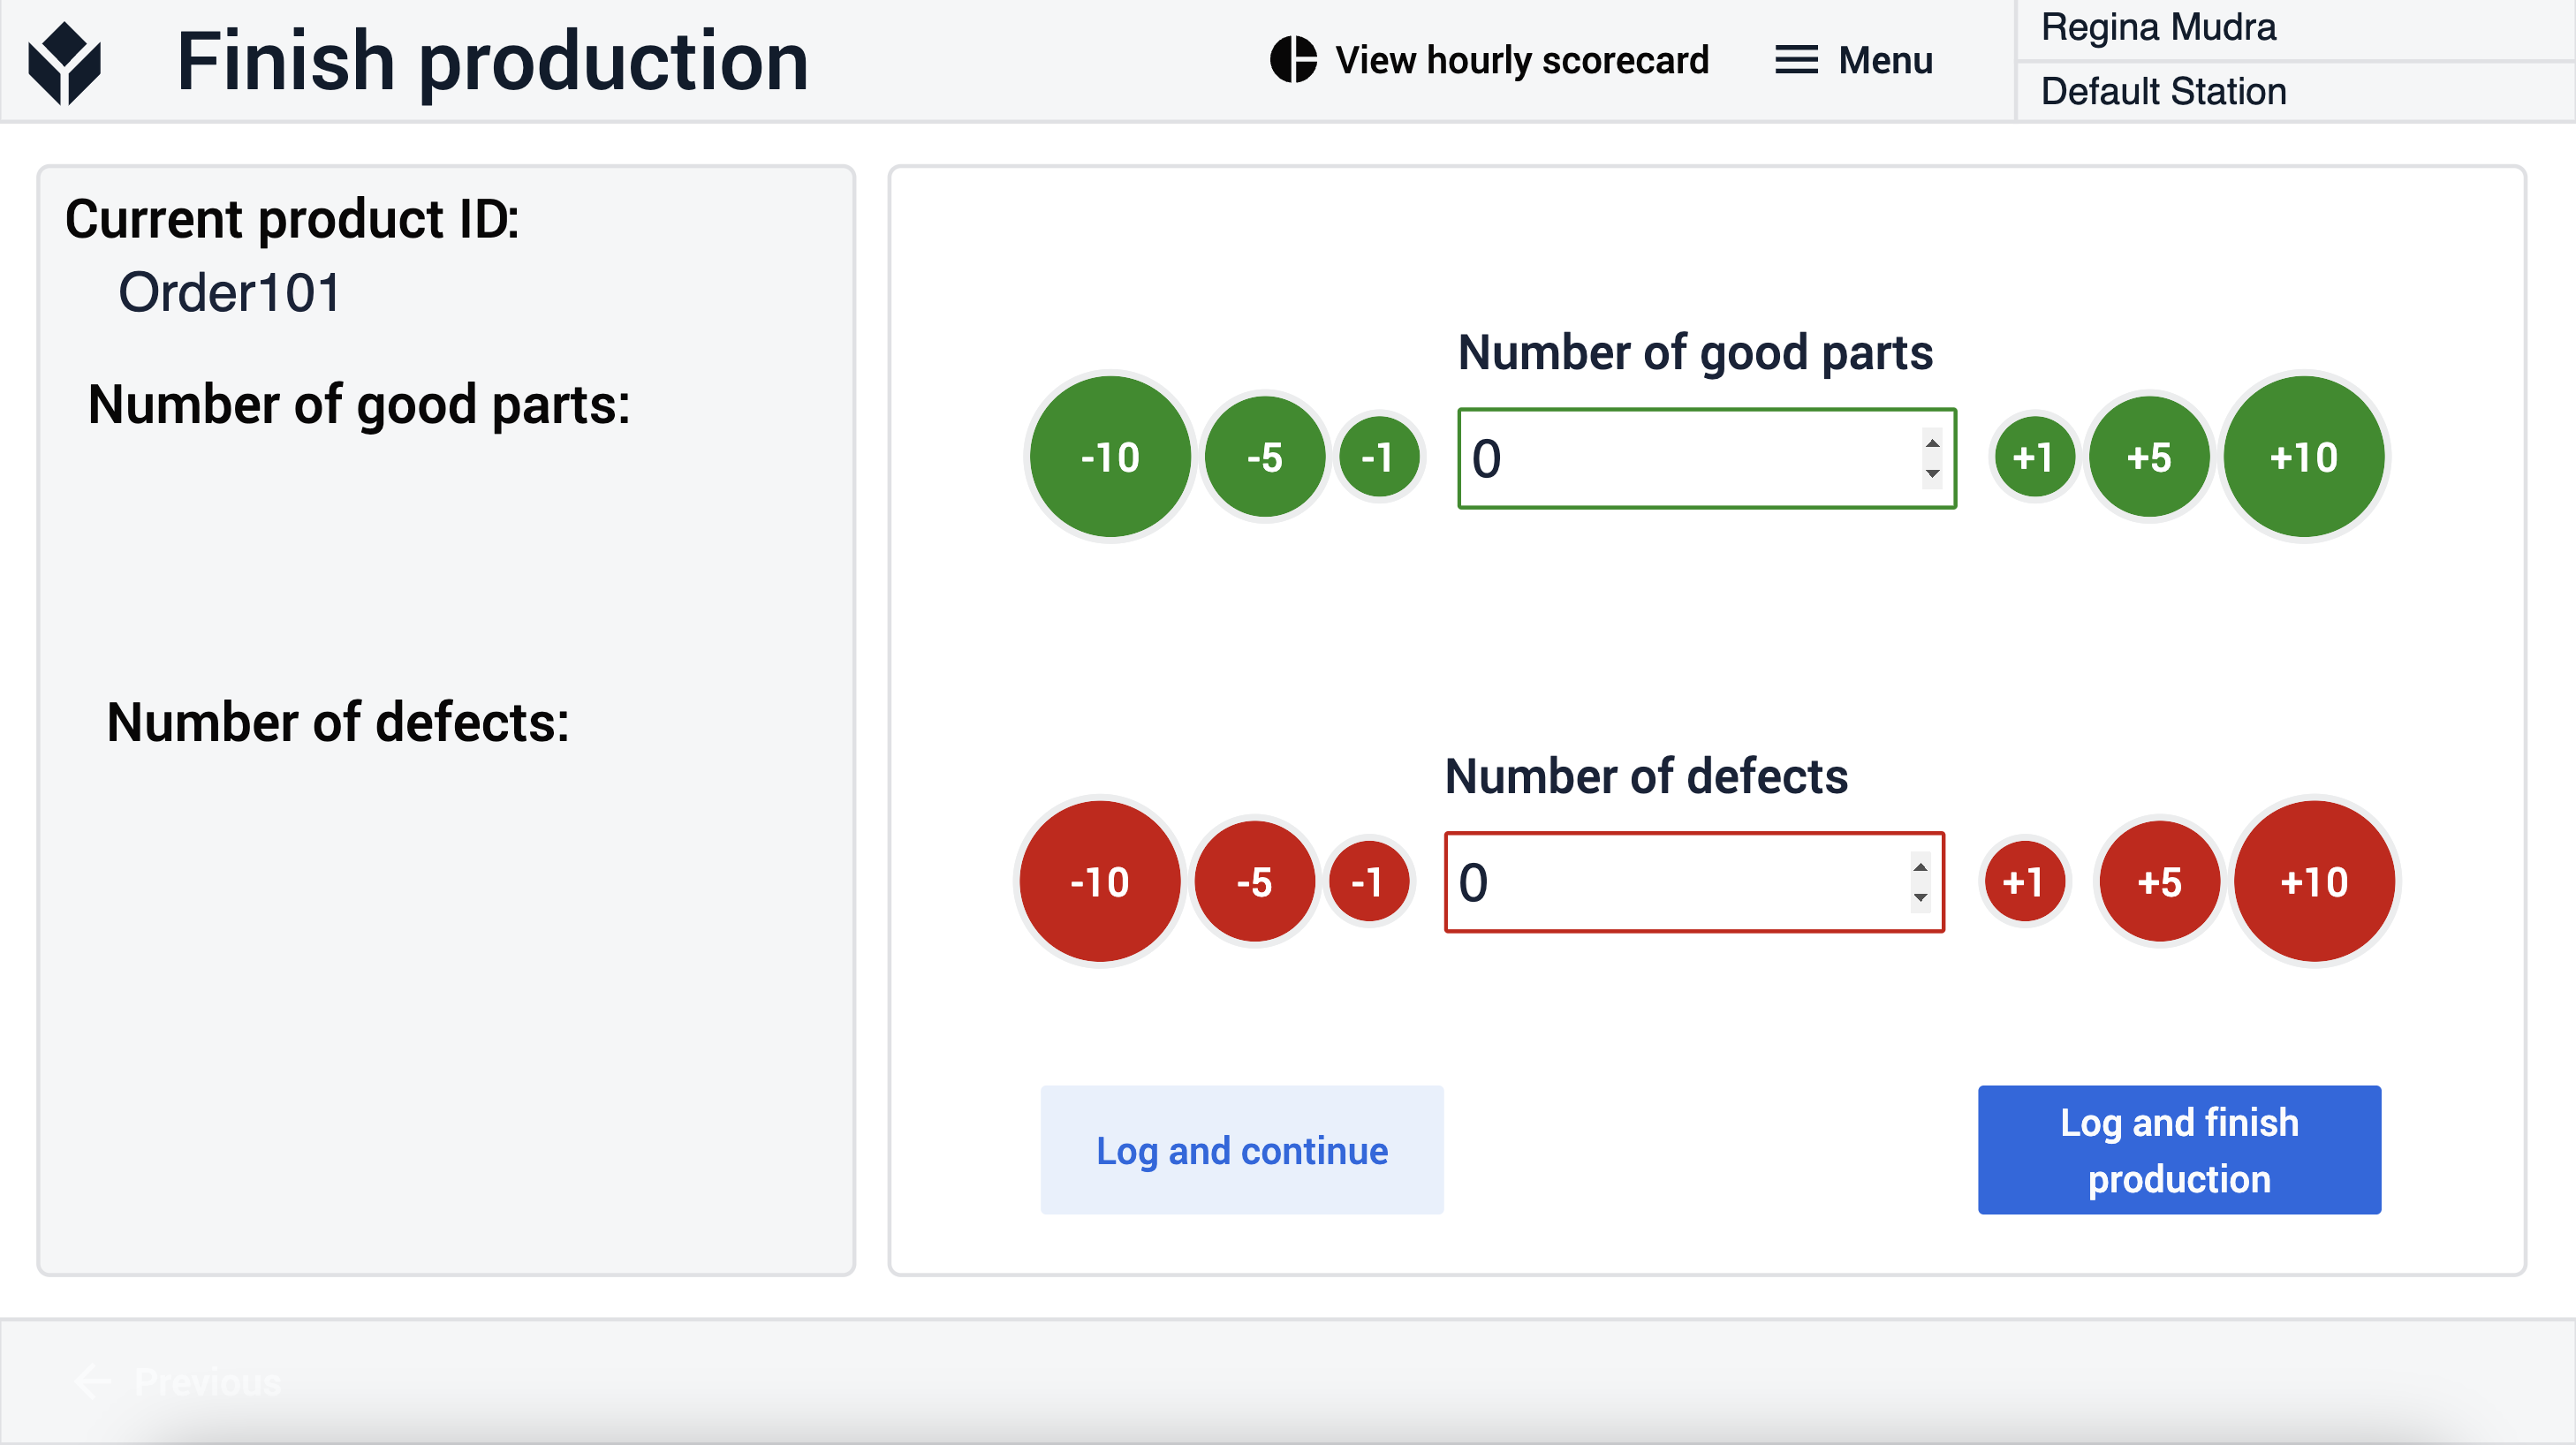
If the user selects the Log output button on the Production in Progress step, the application navigates to the Finish Production step. The user can type in the number of good parts and the number of defects manually, or they can use the buttons that will increment or decrement the values by the numbers displayed on them. As soon as the two values are set, they can be logged into the table and the user can decide to continue the production of the same type of product as before or to go back to the Select Product page and choose another product to produce.
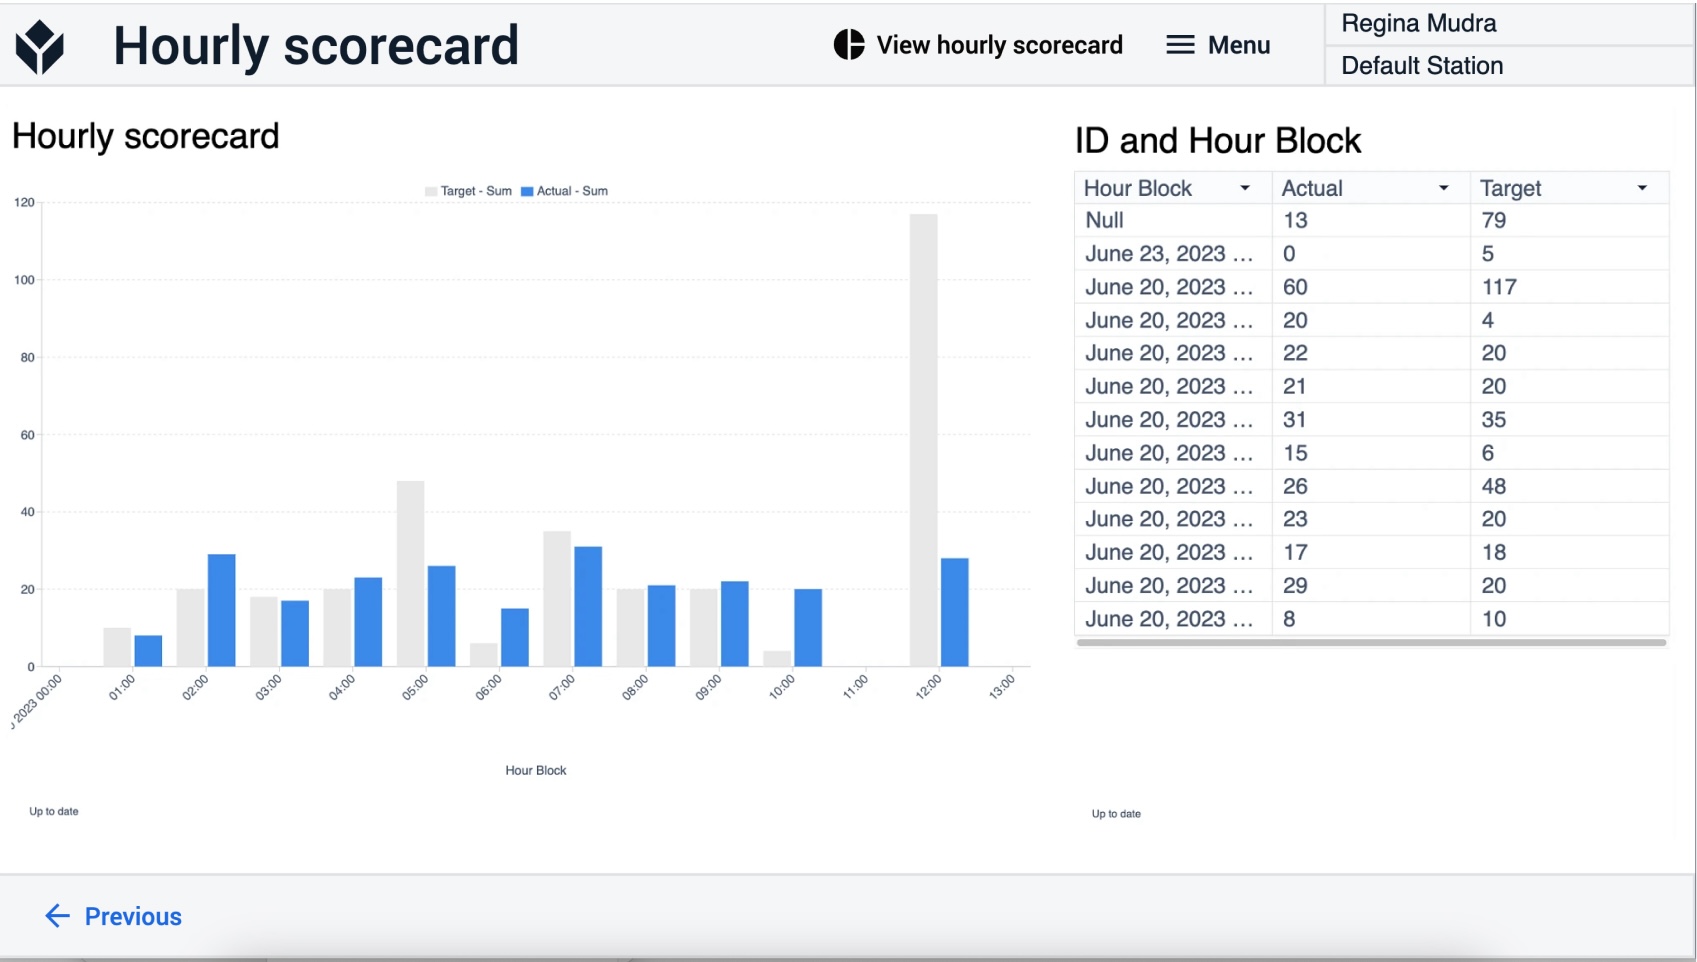
The Hourly scorecard step can be reached from all the other steps. Here, the user can view analytics describing how many products were made in each of the hours. They can also compare it to the calculated Target value.