
To download the app, visit: Library
This article is a guide for app configuration that includes a functional breakdown of steps and ideas for connecting to other apps.
The Machine Monitoring Terminal is a part of Tulip’s composable MES Production Management app suite. You can use it individually or in combination with other applications.
The Machine Monitoring Terminal app is designed for operators and supervisors to track machine utilization and performance. Operators can add notes and context to downtime reports, and log production rates and parts produced per hour. This app can be used with any machine in Tulip, and also ships with Tulip’s Machine Kit.
Learn more about Machine Kits.
Usage and Value Creation
This machine monitoring terminal sets itself apart from conventional platforms by capturing operator input, thus achieving a deeper understanding of performance.
By bolstering machine uptime and performance, this terminal aids in optimizing asset utilization and generating higher return on net assets.
Tulip Tables in the app
All the applications in the Composable MES app suite use common tables.
The application utilizes the Work Order and the Notes & Comments tables. It uses the Work Order table to select a work order, changes its status to In Progress, and then to Completed, while also incrementing the completed quantity of the work order. The Notes & Comments table is used to log station informations.
(Operational Artifact) Work Orders
- ID: Work Order unique identifier
- Operator: Operator who completed the work order
- Parent Order ID: Reference to a parent work order (for example, if a work order needs to be split into more work orders)
- Material Definition ID: The part number of the work order
- Status: CREATED, RELEASED, KITTED, IN PROGRESS, COMPLETED, CONSUMED, DELIVERED
- Location: This is the physical place where the Work Order exists. It could be a station ID, a location ID, or any arbitrary indication of a location
- QTY Required: Quantity of parts that need to be produced
- QTY Complete: Actual quantity produced
- QTY Scrap: The number of units that were scrapped associated with this work order
- Due Date: The date when the WO is due
- Start Date: Actual start date timestamp for the WO
- Complete Date: The actual complete date/time of the Work Order.
- Customer ID: The identity of the company or entity the current production demand is being fulfilled for.
(Log) Notes & Comments
- ID
- Reference ID: ID of the work order, shift, or other process artefact this record is referencing.
- Location: The location where the note was taken. It could be a station ID, a location ID, or any arbitrary indication of a location (area, cell, unit, etc).
- Notes: Field tracking the user's note or comment
- Sender: The person who sent the note
- Updated by: User who wrote the comment
- Recipient: The person who received the notes
- Notes Photo: Photos of notes
Configuration and customization
In-app help
As with all applications in the Composable MES app suite, the Machine Monitoring Terminal app includes in-app help as well. These are short descriptions of the Required setup steps and App builder tips to support further customization. After downloading the app make sure to read these instructions and then delete them before running the application.
Tables that provide data input
To utilize the application, you need to populate certain tables. Specifically, the Work Orders table should be populated. There are several ways to populate the table. You can manually input the data in the Tulip Table, import a CSV file to the table, automate the process. You can aslo use another Tulip app such as the Order Manager application from the Composable MES app suite.
Other configuration needs
-
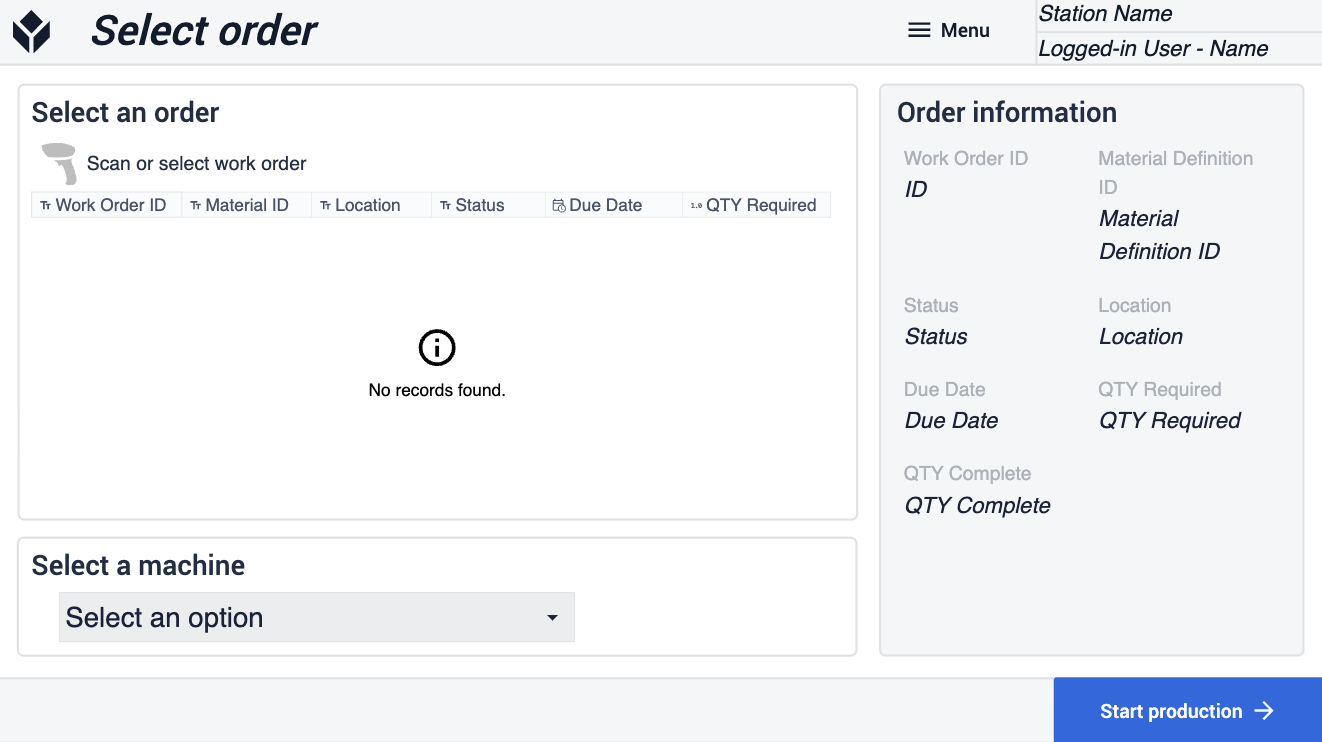
At the Select Order step, consider adding table filters (e.g., Status, Location, Due Date). These filters help users focus on work orders that require their attention. Ensure the filters align with the order statuses used throughout your process.
-
The application allows you to select any Machine that has been configured in your instance: We've included a Select Machine widget that comes with a dropdown menu. The dropdown is configured to display all the machines associated with your instance.
-
To set up the Machine Monitoring Terminal, simply choose a machine from this dropdown. Your choice will directly influence the Machine Status, Machine Timeline widgets and the analytics.
-
If you need to include other machine types, you will have to make adjustments to the analytics settings. This ensures their correct representation and integration into the system.
Customization options
Alternative Setup (Manual Configuration): If you prefer not to use the dropdown, you can remove it and manually configure the terminal. In this case, you would need to:
a) Adjust the Machine Status and Machine Timeline widget's data source on the Machine Terminal step.
b) Adjust the Machines & Devices triggers on the Machine Terminal step.
c) Adjust the Parts made Add and Defects Add triggers on the Machine Terminal step.
d) Adjust the Machine Attributes and Machine Timeline widget on the Attributes step.
Machine Type
Along with this application comes an example Machine Type. The Machine Kit type is a barebones starting point for leveraging the Tulip Machine Monitoring offering.
This machine has a Machine Current attribute that can be mapped to various different data sources. When this attribute goes above 10, the machine will be set to a running state, when it goes below 10, the machine will be set to Stopped. These thresholds can be adjusted in the Machine Type Triggers.
Machine kit configuration
Before you can use this application with the Machine Kit offering, you have to configure the analytics first.
Open every analysis for editing, and on the Machine panel make sure that the Machine Kit type is selected as well.
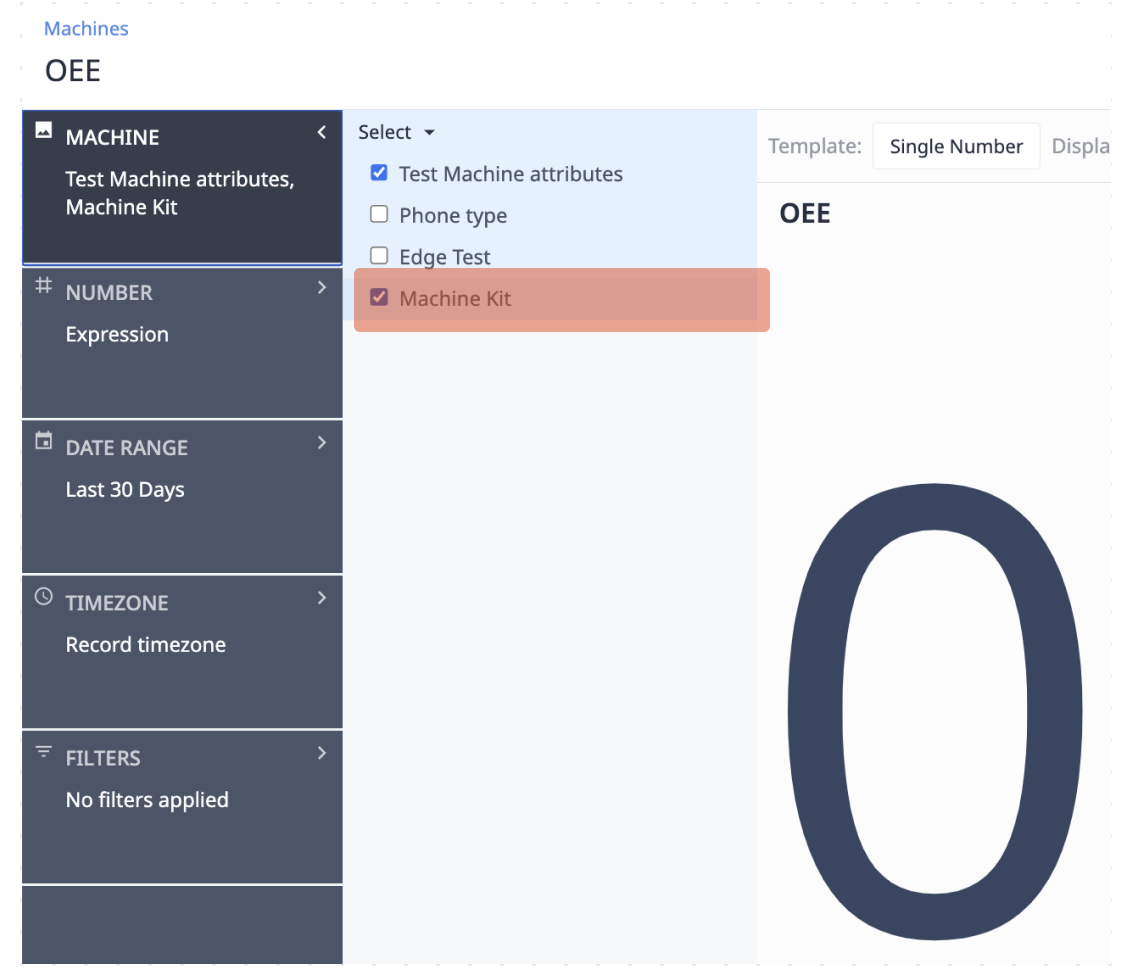
You can find more information on the Machine Kit set up in this article.
App Structure
On the Select Order step, the user has to select a work order to be able to start the production also you can select the machine you would like to work with on this step. When a machine is selected, the machine terminal will automatically update with the data for the selected machine. You can leverage the machine type that comes with this application, or leverage your own. The user can add defect and good parts.
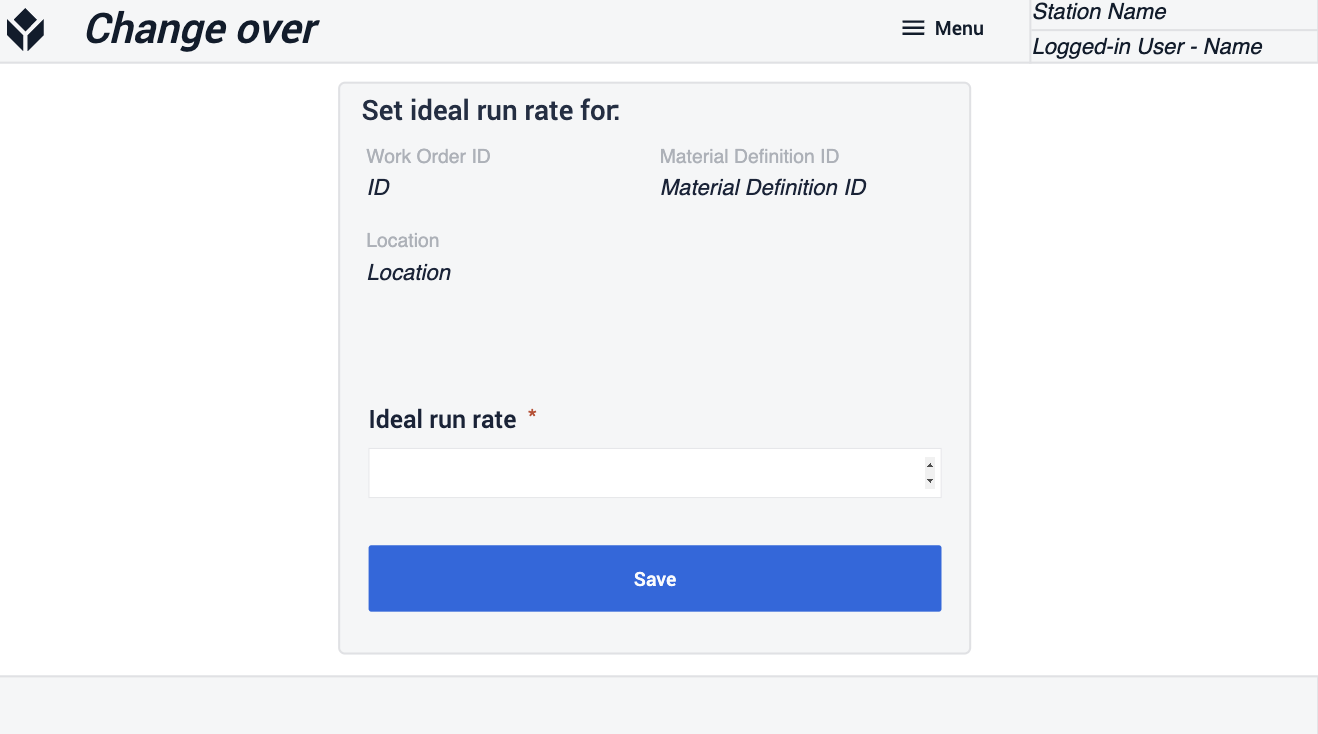
On the Change over step the the user can add an ideal run rate.
On the Machine Terminal step the user can add defect and good parts.
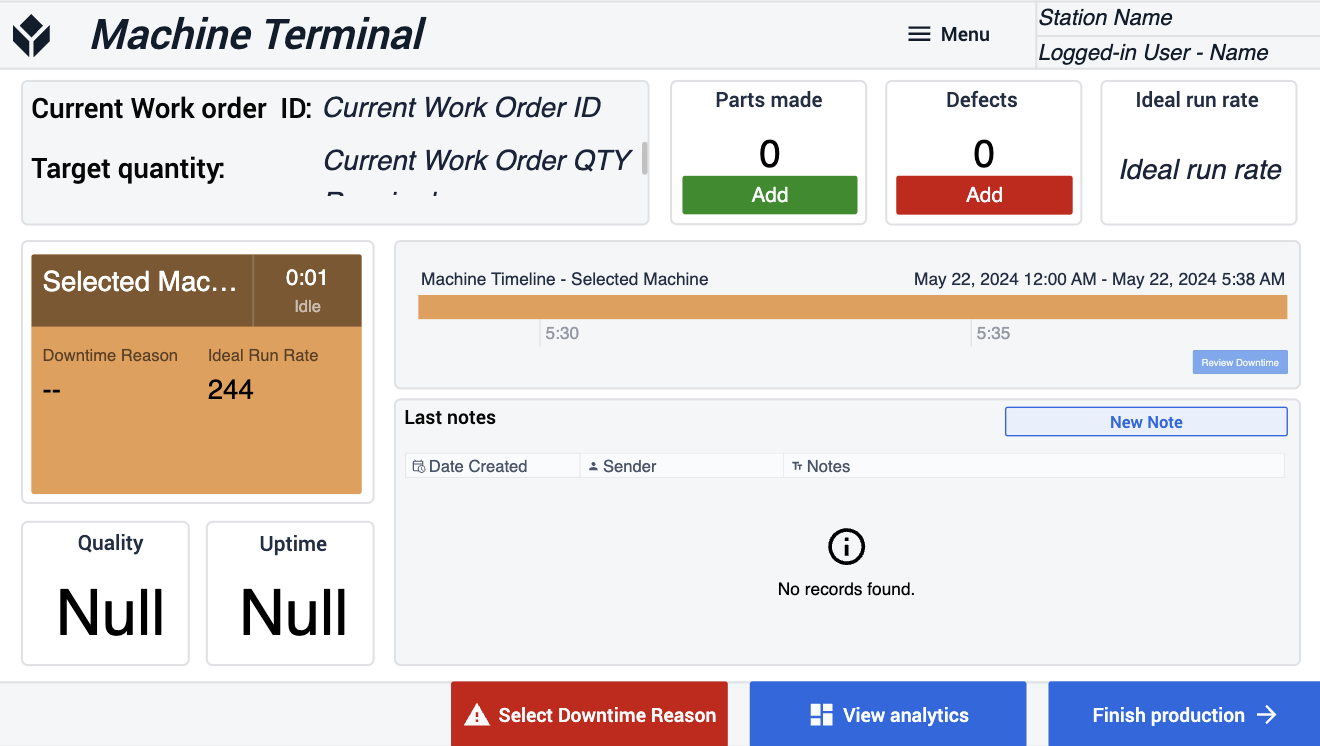
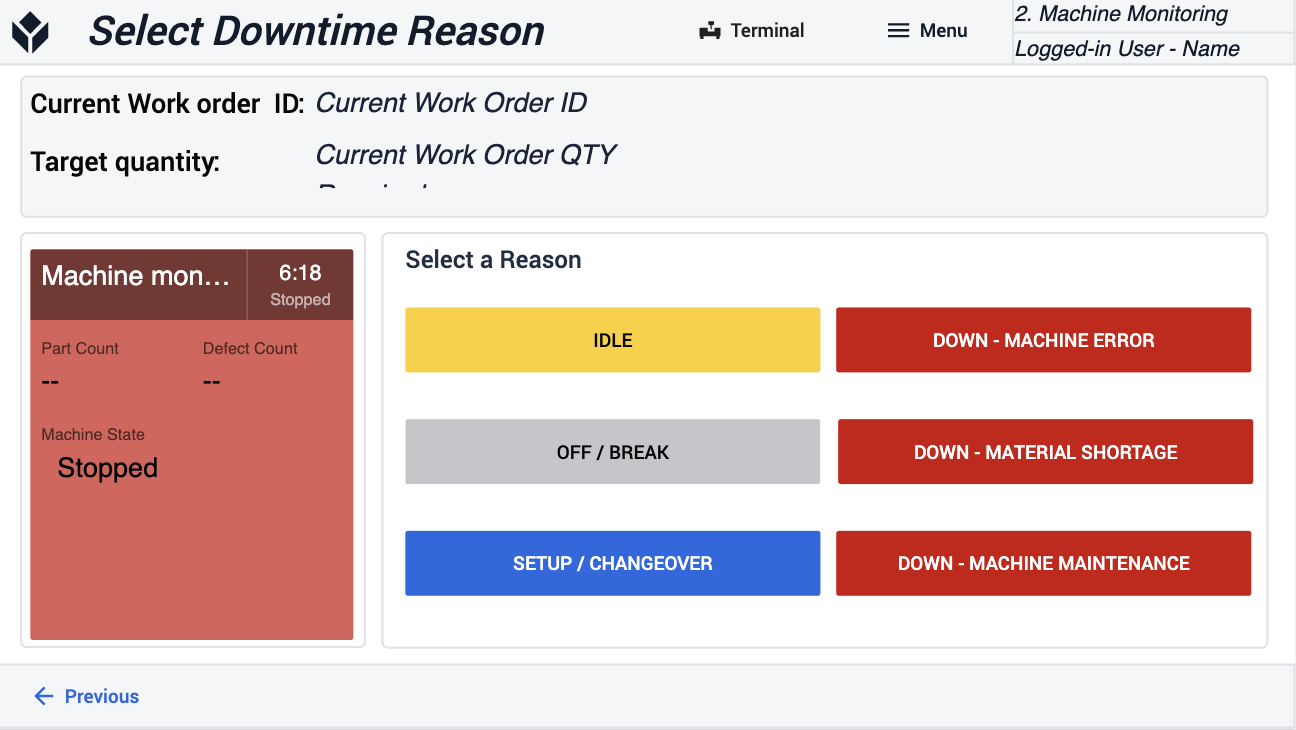
When your machine enters a downtime state, a downtime reason can be assigned to that state to drive further visibility into root cause. Selecting Select Downtime Reason to select some example downtime reasons. Picking any downtime reason will assign a reason to the current downtime state.
On the Analytics steps the app displays OEE, Performance, Availability, Quality, Downtime pareto and OEE by hour analytics.
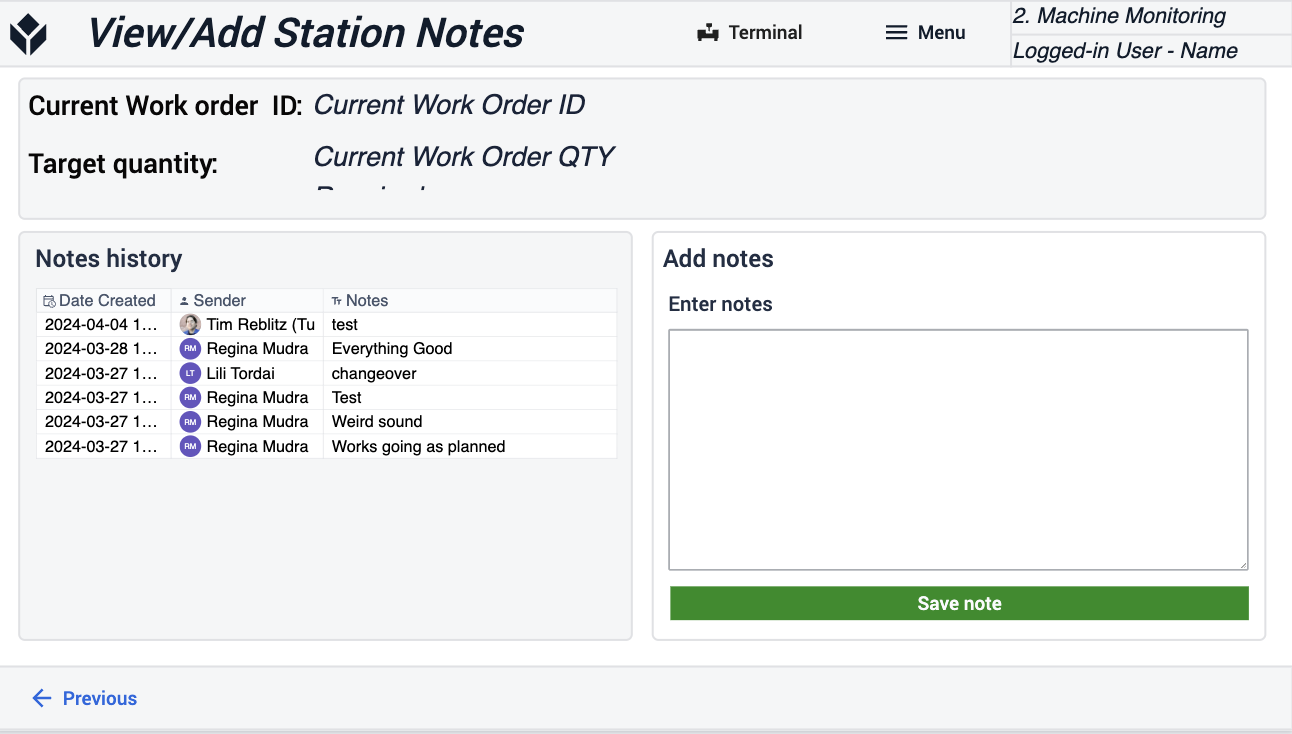
The user can also view and add station note on the View/Add Station Notes step.
Extended App Connections
Example for connecting apps to work with each other.
Order Management
The work orders created by the Order Management application can be updated by the Machine Monitoring application where the order is fulfilled. The logged units in the Machine Monitoring application can later be viewed by the Order Management app.
When setting up these applications make sure that you use the same set of station and order statuses, and adjust table filters respectively.