How to Use the Expression Editor in the Analytics Editor
Here's how to write more advanced queries in the Analytics Editor.
The Expression Editor is a powerful tool for writing mathematical expressions. The expression editor is available when adding Triggers to a Step or when creating analyses.
This tool is designed to enable mathematical calculations and is similar in functionality to expressions in Microsoft Excel. It is available in both the App Editor and Analytics Editor.
For a full list of operators and functions in the Expression Editor, see this list
Creating and Editing an Expression in Tulip Analytics
You may add an expression in any field in the Context Pane within the Analytics Editor.
It will be available either under the Aggregation Functions tab, or under the Functions tab under the Other heading. If the Aggregation Functions tab is available, you should choose the Expression Editor from there rather than from Functions.
You can use the search box to choose either one.

Once you have added an expression, if it says Valid Expression on the bottom footer, you can then save the expression by clicking on the button Save. An invalid expression will have a message in red in the footer with the save button disabled.
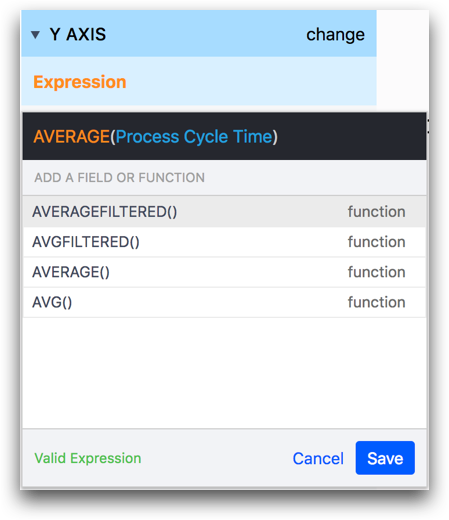
Similarly, to edit an existing expression, change the expression to be what you want, and then press Save. This will save it and run the new analysis.
If you would like to discard any changes made, press the cancel button and this will revert the changes back from before the edits.
Basic Syntax
Write expressions as you would any other mathematical formula. You may use numbers like 3, operators like + , call functions like AVERAGE() , and use ( and ) to ensure correct order of operations. To get started here are some simple expressions:
- 3 + 5 will return 8
- 3 + AVERAGE(Process Cycle Time) will return 3 added to the average of process cycle times (see the next sections for how to add fields like process cycle time).
- AVERAGE(Step A Cycle Time + Step B Cycle Time) will return the average of the sum of the Step A and Step B cycle times across all app completions in a given range.
Adding Fields and Values
The Expression Editor uses special syntax to access data about your app, like process cycle time or the results of form inputs and variables. Collectively these data points are called fields.
To add a field in your expression, type the @ symbol. This will filter the suggestion region to all fields:
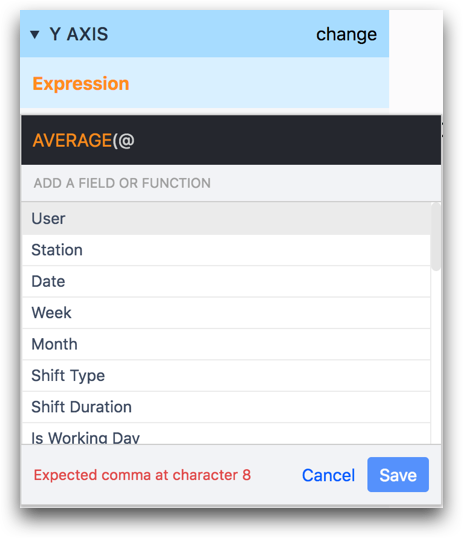
Common examples of app fields include...
- Variables from the app
- Metadata like user, station etc.
As you type, the list of fields will dynamically filter itself. You may add a field to the expression by clicking on it or by using the arrow keys to navigate to it then press enter. Fields in an expression will be colored blue.
You may also add individual values to your expression, like specific users or specific values of dropdowns. Collectively these are called values. To add a value in your expression, type the
# Symbol
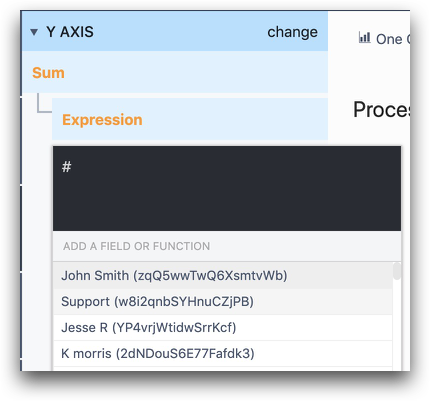
As with fields, this will pull up a list of all available values, as you type the list of the values will dynamically filter itself, and you may add a value to the expression by clicking on it or by using the arrow keys to navigate to it then press enter. Values in an expression will be colored purple.
Converting Fields to the Same Data Type
In order to successfully save an expression, every variable must be using the same data type.
For example, let say you want to divide the number of parts completed by the total amount of time spent in the app to determine how many parts are being completed by hour.
The total parts completed would likely be stored in a variable with type "number".
But, total time spent in the app is automatically stored in the "Process Cycle Time" field, which is an "interval" data type.
To convert this to a "number" data type, you should use the PARSEFLOAT() expression like this:
PARSEFLOAT(Process Cycle Time)
After that, the number of seconds spent in the app will be stored in a number variable.
To sum this value across multiple app completions, use the SUM() expression on the outside:
SUM(PARSEFLOAT(Process Cycle Time))
Next, you will want to divide this value by 3600 to find the number of hours spent in the app. There are 3600 seconds in an hour.
SUM(PARSEFLOAT(Process Cycle Time)/3600)
Finally, you will want to divide the total number of parts completed by this value to find the total parts per hour. Like this:
SUM(total\_parts\_completed) / SUM(PARSEFLOAT(Process Cycle Time)/3600)
Examples
Example 1 - AVERAGEFILTERED()
It is often useful to use an = with a field and value to create a filter. For instance, the following expression uses the AVERAGEFILTERED() function to find the average of user Alice’s process cycle times:
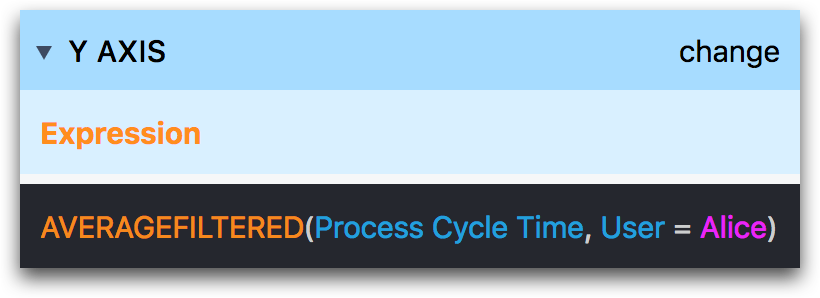
AVERAGEFILTERED(Process Cycle Time, User = Alice)
Example 2 - IF()
You can use IF() statements just like Excel. In the example below, we evaluate the temperature value stored in a variable in every app completion.
If the value is greater than 0 degrees celsius, we will display it as "1" in the analysis.
If it is less than 0 degrees celsius, we store it as 0.
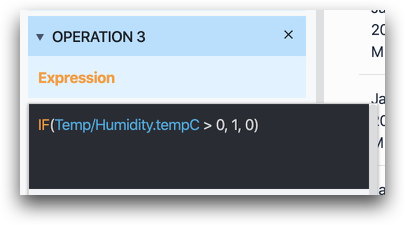
IF(@Temp/Humidity.tempC > 0, 1, 0)
Example 3- Date_Trunc()
You can use DATE_TRUNC() to truncate dates to a given time frame. This is useful for creating a time-based X-axis in a more clean view.
This expression takes in two arguments. The first is a datetime or date variable, and the second is the truncation period desired. The truncation will push all the datetime values to the selected range (day, week, month, year, etc.)
The example below displays a Last Inspected datetime to verify how many tools/machines were inspected each week.
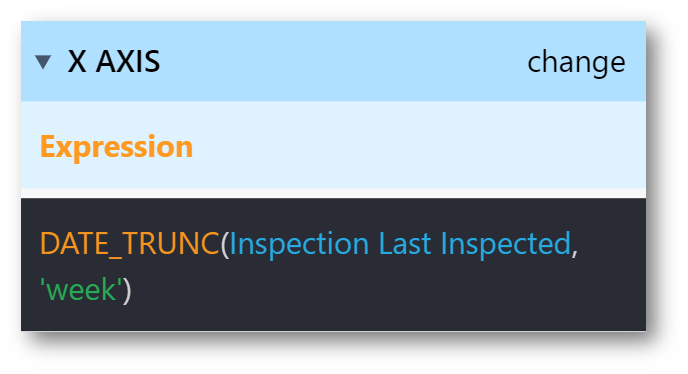
DATE\_TRUNC(@Inspection Last Inspected, 'week')
Further Reading
Did you find what you were looking for?
You can also head to community.tulip.co to post your question or see if others have faced a similar question!
