

Here's how to include an analysis in an App.
Overview
One of the best ways to engage users with the Tulip platform is to provide them with data driven information about what's happening on the shopfloor.
One great way to achieve this is to embed analyses into apps, which allows the user to see and interact with them without turning their head to a dashboard.
Alternatively, you can create an interactive shop floor dashboard app that can be used on a shop floor or a mobile phone
Embed an analysis in a step
In order to embed an analysis within a step of your app, follow these steps:
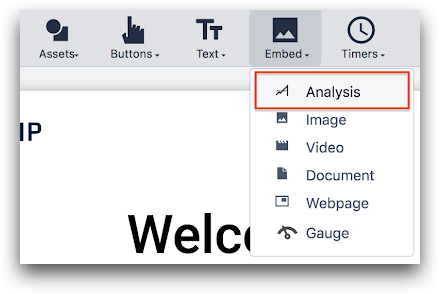
- Click Embed and select Analysis. This will add an empty embedded analysis Widget.
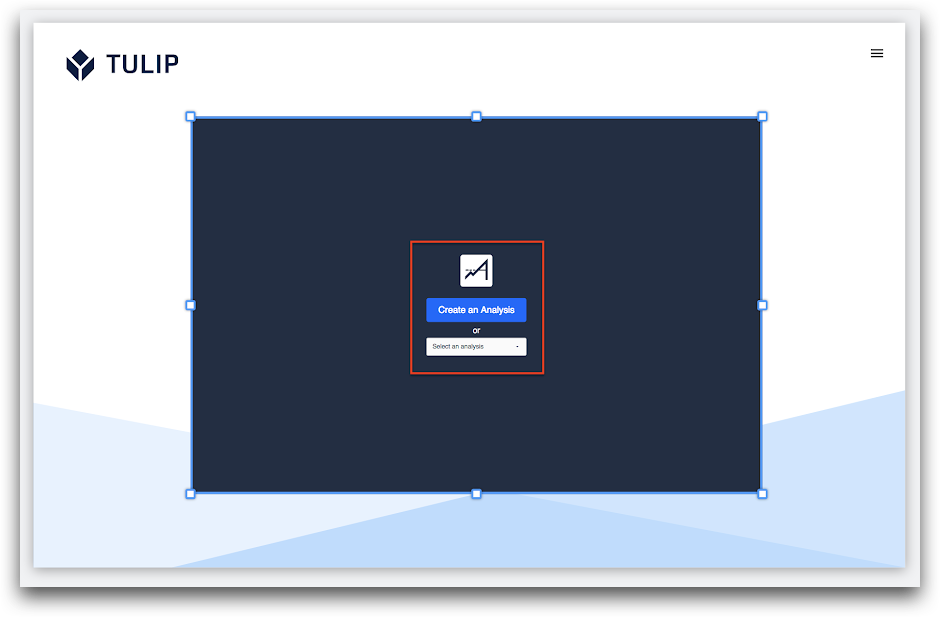
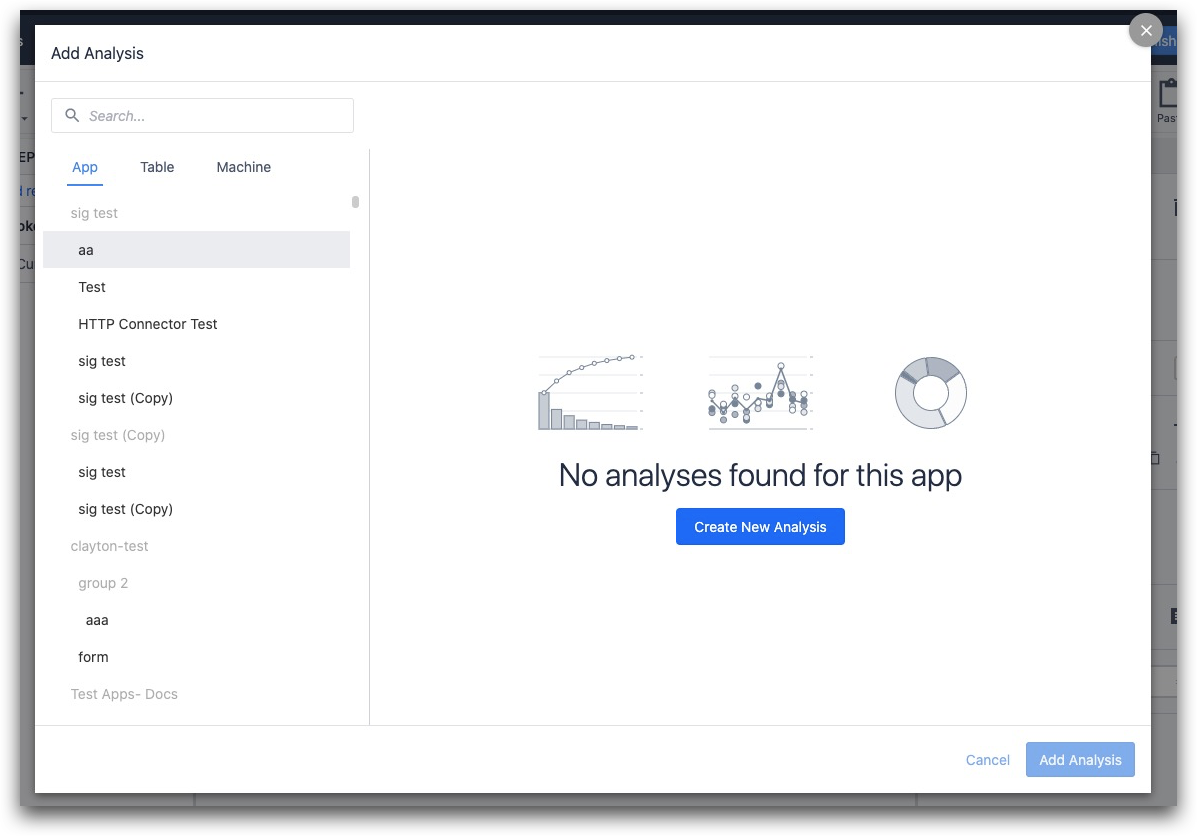
- Select the analysis widget to choose the analysis to embed. You can either create a new analysis or select an existing analysis.
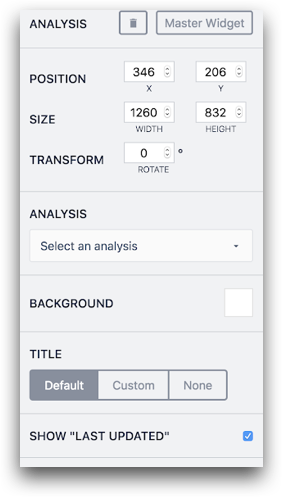
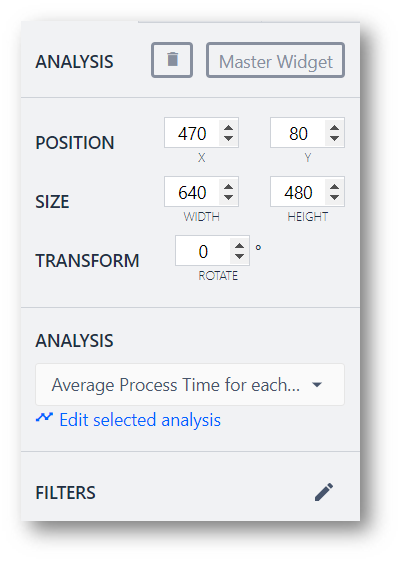
In the Side Pane of the analysis widget, you can change the size and background color of the analysis just like any other widget. Additionally, you can customize the title of the analysis and toggle the display of the Last Updated time for each chart.
Dynamic filters
Once you select an analysis, you can add dynamic filters.
This means that you can change the data being shown in the analysis based on a Variable, Table Record, machine output, and more.
Dynamic analyses support the following data types:
- Text
- Number
- Integer
- Boolean
- Interval
- Datetime
- User
- Station
- Machine
These will manipulate the Filters section from the bottom of the Side Pane in the analytics editor.
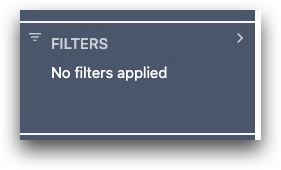
Setup
In the Side Pane, select the pencil next to the Filters option.
Then, begin adding filters. These will change the data shown in the analysis every time the app is run.
Example: Current operator data
Operators may only need to see their own performance. In this case, the analysis can be set to filter to only the logged in user.
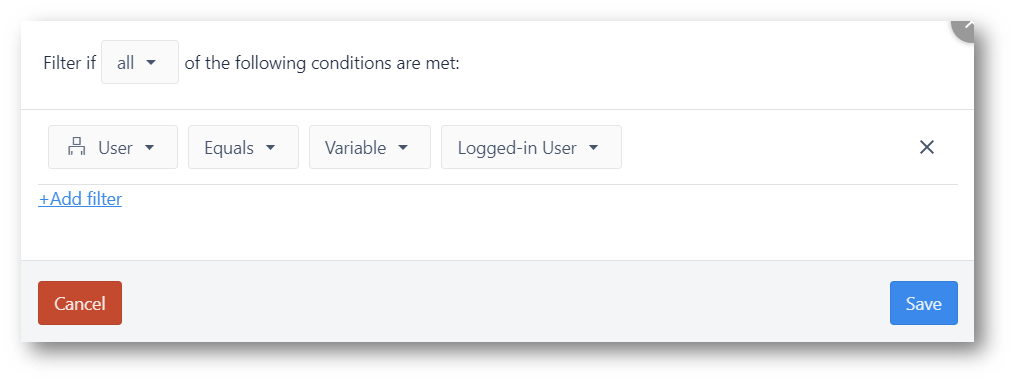
- "User" "Equals" "Variable" "Logged In User"
App analysis filters
- User
- Station
- Start Time
- Date
- Date and Time
- Shift Duration
- Hour of Day
- Process Cycle Time
- All form inputs in that app
- All variables in that app
Table analysis filters
- All Fields for that Table
Machine analysis filters
- Machine
- Start Time
- End Time
- Duration
- Program
- Part Count
- Defect Count
- Parts Per Hour
- Uptime Duration
- Downtime Duration
Technical details
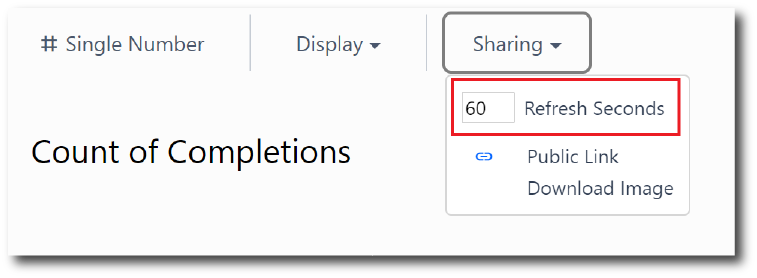
Analyses are set to refresh every 60 seconds by default. When embedding in an App you may choose to reduce this duration so you can see changes as they happen.
To reduce the duration, edit the analysis and change the Refresh Seconds under Sharing. You can refresh down to minimum of 5 seconds.
Further Reading
- Creating An Interactive Shop Floor Dashboard App
- Setting Up Your First Machine Analysis
- Setting Up An Analysis of Table Data
Did you find what you were looking for?
You can also head to community.tulip.co to post your question or see if others have faced a similar question!
.gif)