
Go from ambiguous operations to performance visibility insights with packaged library content
The purpose of this article is to provide a one-stop-shop for start your performance visibility journey. High-level outline below:
- LEARN: Learn about performance visibility
- BUILD: Configure and deploy the performance visibility solution
- IMPROVE: Manage operational improvements
LEARN: Performance Visibility
Check out our guide on performance visibility here
This includes an overview and perspective on the use case.
The critical aspect in performance visibility is that you can immediately create value without the need to integrate to an ERP or other external systems by simply measuring and understand performance details at a more granular level. For example, even simple insights around downtime, defect rates, and throughput can unlock a lot of value at the early stage of an operational transformation.
BUILD: Configure and Deploy the Solution
There are a variety of solutions in the library tailored for performance visibility
| Solution | Description |
|---|---|
| Performance Visibility Scorecard This solution provides a simple interface for tracking station performance with an intuitive user interface |
|
| Centralized Performance Visibility Scorecard This solution is very similar to the performance visibility scorecard but is ideal for managing and monitoring multiple stations on a single app |
|
| Hourly Production Scorecard This solution breaks out each process element of tracking performance visibility into a separate step (e.g. separate step for downtime, separate step for production counts); it also includes aggregated hourly analytics |
For this example, we'll go deep on the Performance Visibility Scorecard
To go from library app to ready to use app, following the checklist below:
- Install and test library apps for compatibility with Tulip Version (Link to app: Performance Visibility Scorecard)
- Create Interfaces (display devices) and stations for each device (Navigate to shop floor and ensure each device is represented by a station and has the Tulip Player installed)
- Create user accounts for app builders and operators
- Install devices on the shop floor
- Publish version 1 of the app without any changes
- Run the app on the production floor to confirm device compatibility and tulip version compatibility
- Note any specific changes required (e.g., different downtime codes, analytics)
- Adjust downtime codes by duplicating the downtime buttons and adding any other settings
- Train the operators, supervisors, managers, etc. on what the App is intended to be used for
- Kick off use of the App on the shop floor
- Hypercare for any questions from end users / App fine tuning
- Set up additional laptops / interfaces / stations as needed
Configuration Considerations
When configuring the performance visibility scorecard, the following are typically adjusted:
Downtime Types
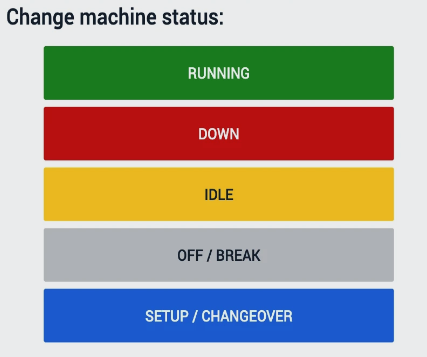
To change the downtime codes (Shown above as an example), duplicate the button and update the trigger logic to write the revised downtime state.
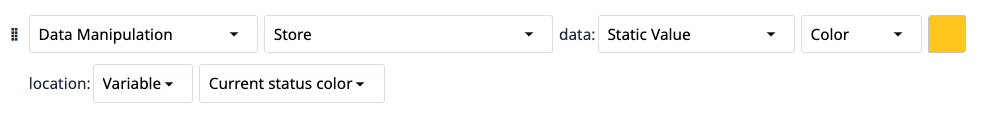
Change Color Logic: Change to relevant color
Change Status Name (Status written to table):
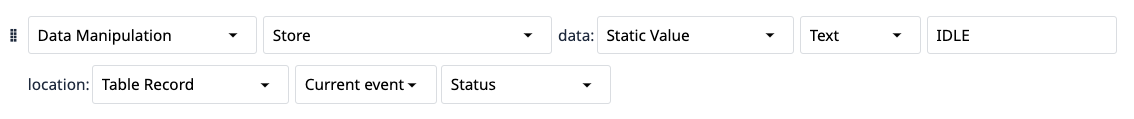
Ensure the button name matches the status name being stored to the table to correctly capture status duration
No Target Statuses
Go to App --> Variables and configure the "No Target Statuses"
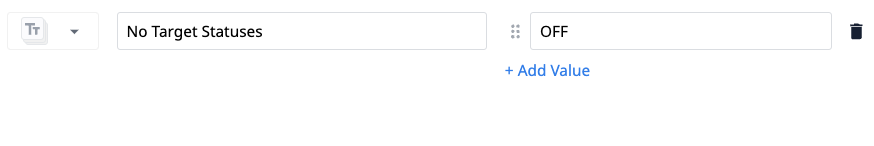
This simply means that for the above example, when the station is "OFF", the target will not increment. For example, you could add a status called "NOT SCHEDULED" and would want to clarify that there is not a production target during this status.
IMPROVE: Manage Operational Improvements
After the app has been configured and deployed, reference the following questions and considerations for turning augmented operations into value:
- What is your root problem? Downtime? Slow production speeds? poor quality? Use the analytics provided as well as the table data (Log) Station Activity to understand root operations problem
- What are common downtime issues? Maintenance? Poor Scheduling? Use this to inform future ops improvement projects
- What is the target value? Are you building a business case around increased throughput or reduced costs? Make sure to note this in the high-level business case for leadership