
How To View Cycle Time Statistics by User with a Table Analysis
Here's how to set up a simple table analysis to view statistics around one process in Tulip
Rather than using Excel to build summary statistics across many rows of data, you can create a Table analysis that automatically rolls up data from many app completions.
This guide will show you how to use a Table analysis to share a simple summary of quantitative variables from an app.
In this case, we will focus on statistics by operator, but you can use this guide for pretty much any grouping- by day, by hour, by station, by app name across multiple apps etc.
Before using this guide, you should understand the concept of "app completions and create a few sample completions in one app for testing purposes.
Structuring Your App
In this example, we will look at statistics that are automatically collected by the app- cycle times.
Since each use of the app automatically collects other metadata like app name, station name and date, you can build multiple types of Table analyses without any custom variables.
So, there is no need to add any variables to your app for this one.
Building the Analysis
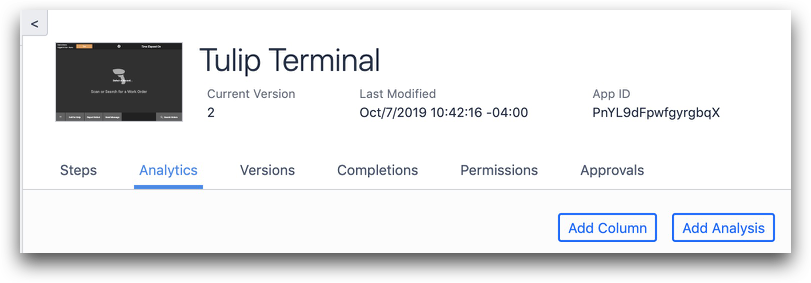
First, choose an app and then choose the "Add Analysis" button in the Analytics tab of the App Summary View.
Then, choose the "Table" analysis from the list of templates.
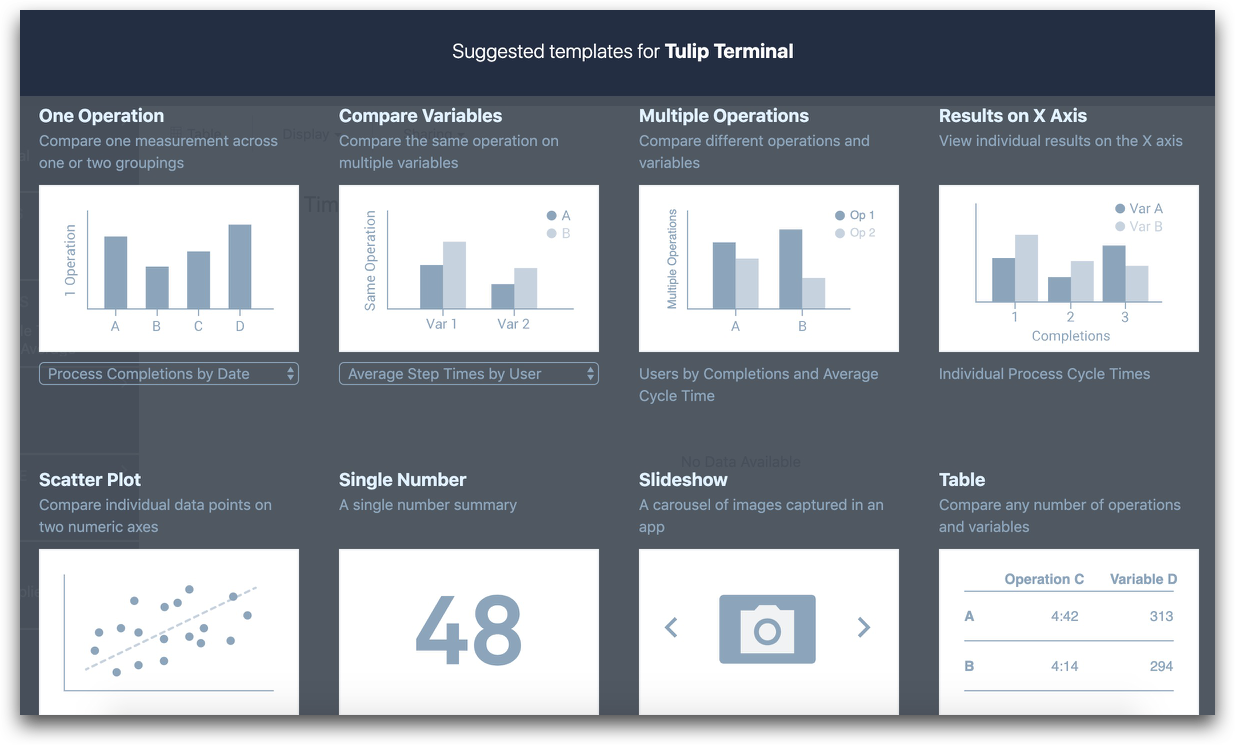
There are 6 fields that you can edit in a Table analysis:
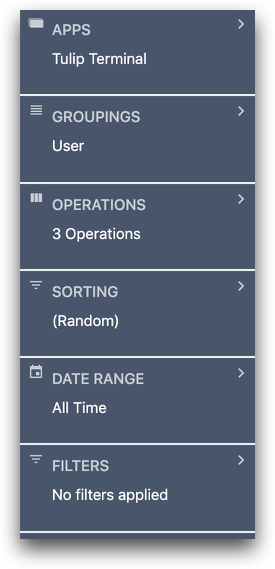
In this case, we will need to edit "Groupings" and "Operations" to successfully track metrics across all operators that have used the app.
The "Groupings" section defines how data should be grouped into individual rows in the Table analysis. In this case, we want to summarize data for each user. So we will group by user.
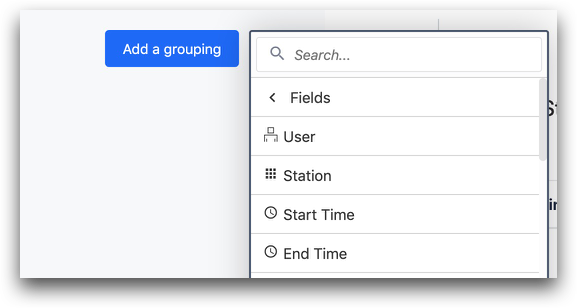
Click the "Groupings" category then "Add Grouping".
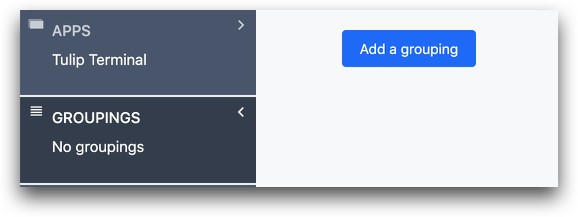
Choose "Fields" and then "User".
Next, we need to choose the "Operations", which are the metrics or variables we want to track across all app completions included in the analysis.
In this case, we want to see the maximum, minimum and average cycle time for the app for each operator.
So, we need to define each of these summary values for each user.
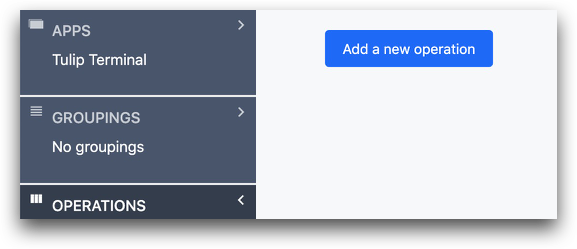
To do this, select "Operations" and then "Add a new operation".
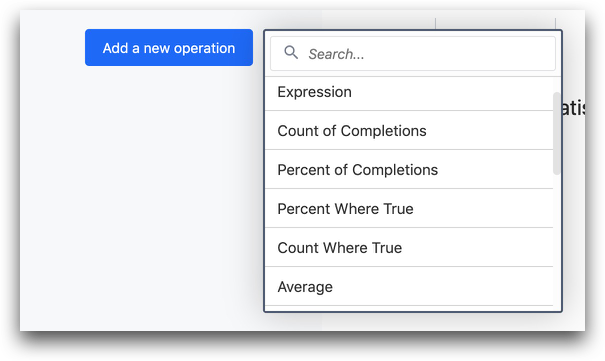
Then, choose "Aggregation functions" to create summary stats across many completions. Choose "Average" so we can find the average cycle time.
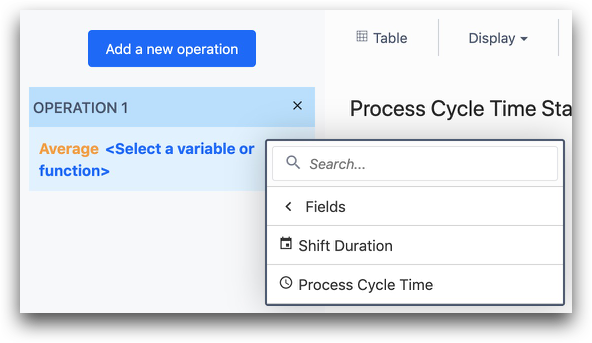
Then, click into the "Fields" menu and select "Process Cycle Time".
You can repeat this process for minimum and maximum cycle time by clicking "Add a new operation" again and using a different Aggregation function.
Did you find what you were looking for?
You can also head to community.tulip.co to post your question or see if others have faced a similar question!