Contents x
- Getting Started
- Build
- App Design
- Driving Business Value with User Research
- App Design Best Practices
- Tulip Solution Credo
- Composable vs. Monolithic Architectures Updated
- How to Design a Tulip Solution
- How to Build Composable Apps
- How to Design an Effective Base Layout
- Best Practices for Naming Elements in Tulip
- How to Add Shapes to App Steps
- App Editor
- Intro to the Tulip App Editor
- Creating a New Tulip App
- How to Use Keyboard Shortcuts in the App Editor and Player
- Multilingual Feature in Tulip
- Steps
- Widgets
- What is a Widget?
- Input Widgets
- Embedded Widgets
- Button Widgets
- How to Configure Widgets
- Adding Input Widgets to Steps Updated
- What is an Interactive Table Widget?
- How to use Conditional Formatting
- How to Embed Videos
- How to Embed Analytics in an App
- Working with Files
- Dynamically populating Single or Multiselect widgets
- How To Use the Checkbox Widget
- How to Add a Barcode Widget
- How To Add a Grid Widget to A Step
- How To Copy/Paste Content Within Apps And Between Apps
- How To Add a Gauge Widget To Your Step
- Custom Widgets Overview Updated
- Creating A Signature Form Step
- Data Validation with Input Widgets Updated
- Record History Widget Overview
- Technical Details of Form Steps
- How to Add Images To An App
- How to Use the Electronic Signature Widget
- Number Formatting in Apps Updated
- Triggers
- What are Triggers?
- Step Level Triggers
- App Level Triggers
- Widget Triggers
- A Guide to App Transitions
- Timer Triggers
- How to Add Device Triggers
- How to add Triggers with Conditions (If/Else Statements)
- List of Actions and Transitions in the Trigger Editor
- What are the Top 10 Most Common Triggers?
- How To Set Widget Color from a Trigger
- How to Send Emails
- How To Setup Tulip Users for SMS Notifications
- How to Print Steps from a Trigger
- How to Use the Expression Editor in the App Editor
- Technical Details of the Expression Editor
- Full List of Expressions in the App Editor
- Using Datetime Expressions
- Typecasting Expressions
- Using Expressions with Arrays and Objects
- Working with Time in Triggers
- Supported Custom Datetime Formats
- How To Complete an App
- How To Scan Barcodes and QR Codes via Your Device's Camera
- How to add a Regular Expression to a Trigger
- Using App Info in Tulip Apps
- How to Call a Connector Function using Triggers
- Variables
- Troubleshooting
- Data
- Connectors
- What are Connectors?
- How to Create a Connector
- Introduction to Tulip Connector Hosts
- How To Run A Connector Function in Multiple Environments
- Connector Snapshotting
- Understanding Arrays and Objects in Connector Function Outputs
- Displaying Interactive Lists of Table Records Or Connector Output in Apps
- Troubleshooting Connectors
- Sharing Connectors Across Workspaces
- Connector Input Encoding Control
- How to Create A Test Database for A Connector Function
- How to Set Up Quick Connectors
- HTTP Connectors
- An Overview of HTTP Connectors
- How to Create and Configure an HTTP Connector Function
- How to Format HTTP Connector Outputs
- Using HTTP Connectors in Apps
- Catch HTTP Connector Errors
- Connector Error Log and Retry Walkthrough
- What is OAuth 1.0?
- What is OAuth2.0?
- OAuth2.0 Configuration and Technical Details
- SQL Connectors
- MQTT Connectors
- Integrating Connectors
- Analytics
- What are Analyses?
- Intro to Analytics Builder
- How to Create a New Analysis
- An Overview of Display Types
- Template Types, Explained
- How to Use the Universal Template
- Number Formatting in Analytics
- Introduction to Chart Layers
- What is a Control Chart?
- Alerting for Control Charts
- How to Embed Analytics in an App
- How To Analyze Data From Multiple Apps
- Using Machine Data in the Analytics Editor
- Understanding Date Ranges
- List of Fields in the Analytics Context Pane
- How to Use the Expression Editor in the Analytics Editor
- Technical Details of the Expression Editor
- Full List of Expressions in the Analytics Editor
- How to Modify an App Analytic
- What is a Forecast Layer?
- Example Analytics
- How To Calculate First Pass Yield with a Number Analysis
- How to Create Table-Based Analytics
- How To Analyze Quality Inspection Checklists with a "Multiple Variables" Analysis
- How To Compare Defects by Type and by Day using the "Compare By" Field
- How To View Cycle Time Statistics by User with a Table Analysis
- How To Create a Pareto Chart of Common Defects
- How To Create Your First Shop Floor Dashboard
- How to Share Analyses or Dashboards
- How to Create Dashboards
- Vision
- Vision Setup
- Tulip Vision Functionality
- Using Vision Buffer Video Recording
- Vision Barcode Scanning Guidelines and Limitations
- Using the Color Detector
- Using the Change Detector
- Using the Jig Detector
- Using the Vision Camera Widget in Apps
- Using Vision's Snapshot Feature
- Using the Datamatrix and Barcode Detectors
- Using Optical Character Recognition (OCR) Detector
- Using a Screen Capture as a Camera Source for Vision
- Tulip Vision Integrations
- Vision Troubleshooting
- Machine Monitoring
- Intro to Machine Monitoring
- How to Set Up Your First Machine
- How to Use Machine Outputs in Triggers
- How To Build Your First OPC UA Data Source
- How To Build Your First MQTT Connector
- How To Add a Machine Widget to an App
- How To Prepare Your Machines to Connect to Tulip
- How to Add Machine Attributes, Downtime Reasons, and States
- Write to Machine Attributes using OPC UA/MQTT Protocols Updated
- Using Edge Devices to Run On Prem Connector Host
- Using Edge MC to Run OPC UA
- How to use the Machine Attributes API
- How to Set Up Machine Types
- How to Add and Configure Machines
- How To Create Your First Machine Trigger
- Recommendations for Machine Monitoring Architecture with Tulip
- Regulated Industries
- GxP App Building Basics
- Best Practices for GxP App Building
- A Summary of Tulip's GxP Capabilities
- GxP Data Collection
- Corrections to Process Data and Review Thereof
- Pause and Resume Functionality
- Using the Record History Widget to View Changes to Table Records
- How to Export App Data to CSV
- Data Review for GxP Compliance
- Data Validation with Input Widgets Updated
- Customize User Roles Updated
- How to Use the Electronic Signature Widget
- Frontline Copilot
- Frontline Copilot Usage and Pricing
- Operator Chat Widget
- Frontline Copilot Settings Page
- Translate Trigger Action
- Extract Text From Image Trigger Action Updated
- Answer Question from Data/Document Trigger actions
- Classify Trigger Action
- Speech-to-text Input
- Chat with Tables
- Frontline Copilot Governance FAQ
- Automations
- Getting Started with Automations
- Overview of the Automations Editor
- How to set up Scheduled Automations
- How to use Looping in Automations
- How to Use Automations Versions
- How to Use Automations Run History
- Automation Limits
- Inventory Management Solution with Automations
- Looping Warning in Automations
- Export & Import
- App Design
- Run Apps
- How To Use the Tulip Player
- How to Run an App in the Tulip Player Updated
- Choosing between the Tulip Web Player or Tulip Player apps
- How to Switch Between Multiple Tulip Accounts
- How To Use the Tulip Player on Apple iOS & iPadOS
- Languages Supported in Tulip
- How to access your Tulip Player/Instance in an iFrame
- How to Run Tulip Applications on Different Devices
- How To Troubleshoot the Tulip Player
- Recommended Devices For Running the Tulip Player Updated
- How to Restart the Tulip Player if the Screen Goes Blank
- How to Export App Data to CSV
- Deploy and Manage
- Set Up Your Tulip Instance
- User Management
- App Management
- Shop Floor Management
- Workspace Managment
- Player Management
- Linux Player
- Player Features by Platform Updated
- Player Logout Behavior
- How to Hide the Developer Menu in Tulip Player
- How to Disable Automatic Updates for the Tulip Player
- Fallback Database Error Resolution
- Using the Tulip Player with Different Windows Accounts
- Tulip Player Enterprise Deployments
- Overview of Stations and Interfaces Updated
- How To Troubleshoot the Tulip Player
- Developer Tools
- Connect to Software
- Connectors
- What are Connectors?
- How to Create a Connector
- Introduction to Tulip Connector Hosts
- OAuth2.0 Configuration and Technical Details
- How To Run A Connector Function in Multiple Environments
- Connector Snapshotting
- Understanding Arrays and Objects in Connector Function Outputs
- Connector Input Encoding Control
- How to Create and Configure an HTTP Connector Function
- How to Format HTTP Connector Outputs
- Using HTTP Connectors in Apps
- How to Write a SQL Connector Function
- An overview of MQTT Functions
- How To Build Your First MQTT Connector
- Ecosystem Integration Guides
- Amazon Bedrock Integration
- AWS Integration - Fetch All Tulip Tables and Write to S3
- AWS Integration - Send data to AWS via API Gateway & Lambda
- AWS Integration - Fetch data from Tulip Tables
- AWS Integration - Fetch All Tulip Tables in Lambda Function
- Glue ETL Script Example for Loading Tulip Table Data
- IoT Sitewise Integration
- Lean Daily Management with AWS
- Microsoft Azure Machine Learning Integration
- Microsoft Fabric Integration
- Rockwell FactoryTalk Optix Integration
- Snowflake Integration with Fabric - Fetch Tulip Tables to Snowflake
- Connectors
- Connect to Hardware
- Edge Devices
- Edge IO
- Edge MC
- Machine Kit
- IO Gateway
- I/O Gateway End of Sale Announcement
- Setting up a Tulip I/O Gateway
- How to Register a I/O Gateway
- Reset I/O Gateway to Factory Settings
- How To Enable I/O Gateway Remote Support
- How to Use Analog Inputs on the I/O Gateway
- How To Use The Generic Serial Driver on I/O Gateway
- Tulip I/O Gateway Technical Specifications
- Factory Kit
- Factory Kit Quickstart Guide
- Factory Kit Materials and Procurement Information
- Edge IO Light Strip Setup
- Break Beam Sensor Unit Test
- How to Set Up a Foot Pedal in Tulip
- Temperature and Humidity Sensors Unit Tests
- How To Include Factory Kit Devices in Apps
- Tulip Light Kit Initial Setup
- How to Use the Tulip Light Kit
- Connecting the Factory Kit USB Devices (Barcode, Foot Pedal, Temp/Humidity)
- Setting up the Break Beam Sensor
- Light Kit Unit Test
- Tulip Light Kit Technical Specifications
- Assembling the Light Stack
- Manage Edge Devices
- How to Enable HTTPS on your Edge Device
- How to Configure the Device Portal
- How To Manage Edge Devices Within Tulip
- Supported Firmware Versions
- How To Manage Edge Device Auto Updates
- How to Configure the Network Settings on your Tulip Edge Device
- How to Configure the LAN Interface of an Edge Device
- How Tulip Edge Devices Get Their IP Address
- How to Configure SNMP Settings for Edge Devices
- How To Find Your Edge Device OS Version
- Tulip Edge Device FAQ
- Edge Device HTTPS Portal
- Edge Device Use Cases
- Using Edge Devices as a Machine Data Source
- Edge Devices and FlowFuse
- How to Enable and Set Up the Edge Device MQTT Broker
- How to Set up a MQTT Bridge on an Edge Device
- Using Edge MC to Run OPC UA
- How to use GPIO on Edge IO
- Using Node-RED with Edge MC
- Using Node-RED with Edge IO
- How to: Use Serial with Edge IO
- Using Edge Devices to Run On Prem Connector Host
- Communicate with Machines using Edge MC's Connector Host & Node-RED
- What You Can Do with Tulip + IoT
- Troubleshoot your Tulip Edge Devices
- Supported Devices
- List of Plug And Play Devices That Work With Tulip
- Device Driver Creation and Support
- Device Driver Support In Tulip
- How to Set Up a Barcode Scanner
- Using the Serial Driver
- How To Integrate a Zebra Printer with Tulip
- Using the Zebra Network Printer Driver
- Using the Zebra GK Series Label Printer Driver
- Using the USB Bobe Box Driver
- Using the Cognex In-Sight 2000 Driver
- How to Configure Cognex and Tulip
- Using the MT SevenExcellence PH Meter Driver
- Using the Generic ADC Driver
- Using the Omega HH806 Thermometer Driver
- Using the Digital Caliper Driver
- How to Set Up the General TS05 Bluetooth Temperature Gun
- Using the Cognex DataMan TCP Driver
- Setting up the Mitutoyo U-WAVE Receiver for Windows Tulip Player
- Using the Brecknell PS25 Scale Driver
- Using the RFID Driver
- Using the Kolver EDU 2AE/TOP/E Driver
- Using the USB Foot Pedal Driver
- Using the Torque Open Protocol Driver
- Using the Dymo M10 USB Scale Driver
- Using the Cognex In-Sight Driver
- Using the Telnet Driver
- Using the Generic I/O Driver
- How to Set Up a Kolver Torque Controller
- Using the Insize Multichannel Caliper Driver
- Using the Dymo S50 USB Scale Driver
- Zebra Android DataWedge Configuration
- Use the Mitutoyo Digital Caliper with Mitutoyo U-wave Driver
- Troubleshoot
- Node-RED
- Overview of Node-RED
- How-To Guides
- Use Cases
- How to Setup Modbus Devices
- How to Setup Banner PICK-IQ Devices with Edge IO
- How to Send Data to Machines from Edge Devices using Node-RED and Tulip Tags
- Communicate with Machines using Edge MC's Connector Host & Node-RED
- Connecting a 4-20 mA Sensor with Edge IO and Node-RED
- Managing Machine States and Part Counts with Edge IO and Node-RED
- Connecting an Analog Oscilloscope with Edge IO and Node-RED
- Connecting Wired Phidgets with Edge MC and Node-RED
- Edge Devices
- Write Reusable Components
- Work with APIs
- Connect to Software
- IT and Technical Docs
- Maintenance Event Schedule
- How to get Tulip Support Updated
- IT Infastructure
- Tulip IT Welcome Guide
- Configuring Your IP Allowlist
- An Overview of Tulip’s Security Options
- Tulip IT Security Guide Updated
- Introduction to Tulip Connector Hosts
- On-Prem Connector Host Version Support
- Enabling log-rotations for existing on-premise Connector Host container
- Recommendations for Machine Monitoring Architecture with Tulip
- Tulip On-Premise Virtual Machine Details
- Tulip Platform Components & Network Diagram
- Deploying Tulip in AWS GovCloud
- How To Use a Proxy Server with Tulip Player on Windows
- Overview of On-Premise Connector Hosts Updated
- Networking Requirements for a Tulip Cloud Deployment Updated
- Tulip W-9 Form
- What are Tulip's Cyber Security Policies and Infrastructure?
- LDAP/SAML/SSO
- How to use the Tulip Partner Portal
- Guides
- Digital Transformation Journey
- Use Cases by Solution
- Examples
- How To Get Real-Time Visibility Of Work Orders by Workstation
- 5S Audit App Tutorial
- How To Build An Automated Rejects Report App
- How To Plan Your First Frontline Operations App
- How To Track Machine Audits In A Table
- How To Automate Your Work Orders In A Frontline Operations App
- How To Use Manufacturing Apps in High Mix Environments
- How To Build A Digital Work Instructions App
- How To Track Product Genealogy Using Tables
- How to Add an Ohaus Scale and Store Output in a Variable
- How To Deduct From An Inventory Table Upon Completion of An Operation
- How To Use the Work Instructions "UI Template"
- How To Create A Skills Matrix with User Fields
- How To Create A Bill of Materials (BOM) Table
- How To Manage Your Inventory Using Tables
- How To Pass Dynamic Data Between Multiple Apps with User Fields
- How To Navigate Between Multiple Apps by Creating a "Routing App"
- 📄 Order Tracking
- 📄 Defect Tracking
- Library
- Using the Tulip Library Updated
- Laboratory Operations App Suite
- Library Collections
- Library Apps
- Educational Examples
- App Solutions
- CMMS App Suite
- Zerokey solutions
- Performance Visibility
- Electronic Batch Record (eBR) App Suite
- CAPA Lite by PCG
- 5 Why Root Cause with AI
- Simple Defect Reporting with AI
- Business Case Builder
- Shift Starter Meeting
- Kanban App Suite
- Simple OEE Dashboard
- Arena BOM Solution
- Equipment Management App Suite
- Simple Checklist
- Checklist Management Suite
- Attendance Management Simple Solution
- Pack & Ship Library Applications
- CAPA Management
- Mobile Camera App
- OEE Calculator
- Hourly Production Scorecard
- Material Backflush
- Quality Event Dashboard
- First Pass Yield Application
- Pick to Light
- Training Solutions
- Digital Systems Inventory
- Location Tracking with Vision
- Digital Systems Access Management
- Material Management
- Tool & Asset Manager
- Quality Event Management
- Step Advance with Break Beam Sensor
- Digital Stopwatch
- Audit Checklist
- Katana ERP App
- High-level Baseline Assessment
- BOM Management
- Safety Incident Manager
- Composable Lean App Suite Updated
- Mobile Operations App Suite Updated
- App Templates
- eDHR App Suite
- Training Template
- Quality Event Management App Suite
- Batch Packaging Template App
- Dashboard Layout UI Template
- Machine Monitoring Dashboard
- Defect Tracking Template
- Color Configuration
- Work Instructions Example
- Design Template
- Training Manager
- Training Management
- Work Instructions Templates
- Work Instructions Template
- Picklist Template
- Basic Templates for Building Tulip Applications
- Traveler and Material Flow Dashboard
- Order Tracking Template
- Composable MES
- Composable MES for Pharmaceutical Manufacturing
- Connectors and Unit Tests
- Planeus Unit Test Updated
- COPA-DATA Connector New
- Microsoft Planner Connector
- Microsoft To Do Connector
- Microsoft Project Connector
- Trello Connector
- Monday Connector
- Asana Connector
- Sandalwood: Ignition Connector
- Veeva Connector
- Inkit Connector
- MRPeasy Connector
- Zapier Webhook Connector
- Oracle Fusion Connector
- LabVantage Connector and Unit Test
- Google Chat Connector
- Salesforce Connector
- Litmus Overview
- eMaint Connector
- eLabNext Connector
- Acumatica ERP Connector
- CETEC Connector
- PagerDuty Connector
- NiceLabel Integration
- Aras Integration Overview
- SDA Integration
- Nymi Band Unit Test
- Arena Integration Updated
- Barcode Scanner Unit Tests
- Footpedal Unit Tests
- Getting Started with Tulip on RealWear Headset
- Airtable Connector
- Shippo Connector
- Bartender Integration
- SAP S/4 HANA Cloud Connector
- RFID Scanner Unit Tests
- Jira Connector
- Zebra Label Printer Unit Test
- Google Translate Connector
- MSFT Power Automate
- OpenAI Connector
- Google Calendar Connector
- Tulip API unit test
- Duro PLM Unit Test
- HiveMQ Unit Test
- NetSuite Integration
- Cognex Unit Test
- PowerBI Desktop Integration
- ProGlove Unit Test
- Fivetran Integration
- ParticleIO Integration
- Google Drive Connector
- Snowflake Connector
- SAP SuccessFactors Connector
- ZeroKey Integration
- Google Geocode Connector
- Google Sheets Connector
- How To Integrate Tulip with Slack
- HighByte Intelligence Hub Unit Test
- LandingAI Unit Test
- LIFX Unit Test (Wireless Lights)
- Microsoft Calendar Connector
- M365 Dynamics F&O Connector
- Microsoft Outlook Connector
- Microsoft Teams Connector
- Connect the Microsoft Graph API to Tulip with Oauth2
- Microsoft Excel Connector
- NetSuite Apps and Connector
- OpenBOM Connector
- Weighing Scale Unit Tests
- InfluxDB Connector
- Augury Connector
- ilert Connector
- Schaeffler Optime Connector
- MongoDB Atlas Connector
- MaintainX Connector
- Twilio Connector
- SendGrid Connector
- Solace Connector
- How to Design Tulip Apps for the RealWear Headset
- OnShape Connector
- Custom Widgets
- Scheduling Custom Widget Updated
- Timeline widget
- json Tree Viewer Widget
- Kanban Task Management Widget
- Badge Widget
- Advanced Timer Widget
- Segmented Button Custom Widget
- Dynamic Gauge Custom Widget
- Snackbar Widget
- Change Detector Unit Test
- Status Color Indicator Unit Test
- Input Length Check Unit Test
- Calculator Custom Widget Unit Test
- Image Annotation Widget Unit Test
- Lean Dashboard Widgets
- Looper Unit Test
- Stopwatch Unit Test
- Number Input Unit Test
- Number Pad Unit Test
- Radial Gauges
- Step by Step Menu Unit Test
- SVG Widget
- Text Input Unit Test
- Tool Tip Unit Test
- Work Instructions Care Points Unit Test
- Written Electronic Signature Widget Unit Test
- ZPL Viewer Unit Test
- Simple Line Graph Widget
- Shelves Custom Widget
- Slider Widget
- NFPA Diamond Custom Widget
- Pass - Fail Custom Widget
- Simpler Timer Custom Widget
- Nymi Presence Integration Widgets
- Automations
- Check Expired Training
- Event Alerting & Escalation: Managing Overdue Events
- Hourly production status notification
- Maintenance equipment status update
- Equipment Status Reset
- Calibration Status Reset
- Machine Status Check Reminder
- Inventory Status and Alerting Automation
- Andon Alerting for Station Down
- Check Training Status and Send Email Automation
- Update Inventory Table Automation
- Slack Connector Automation
- Part Count Checker
- Release Announcements
- Platform Releases
- Platform Release 309 - March 2025 Updated
- Platform Release 308 - February 2025
- Platform Release 307 - February 2025
- Platform Release 306 - February 2025
- Platform Release 305 - February 2025
- Platform Release 304 - January 2025
- Platform Release 303 - January 2025
- Platform Release 302 - January 2025
- Platform Release 301 - January 2025
- Platform Release 300 - January 2025
- Platform Release 299 - December 2024
- Platform Release 298 - December 2024
- Platform Release 297 - December 2024
- Platform Release 296 - November 2024
- Platform Release 295 - November 2024
- Platform Release 294 - November 2024
- Platform Release 293 - November 2024
- Platform Release 292 - November 2024
- Platform Release 291 - October 2024
- Platform Release 290 - October 2024
- Platform Release 289 - October 2024
- Platform Release 288 - September 2024
- Platform Release 287 - September 2024
- Platform Release 286 - August 2024
- Platform Release 285 - August 2024
- Platform Release 284 - July 2024
- Platform Release 283 - July 2024
- Platform Release 282 - June 2024
- Platform Release 281 - June 2024
- Platform Release 280 - May 2024
- Platform Release 279 - May 2024
- Platform Release 278 - April 2024
- Platform Release 277 - April 2024
- Platform Release 276 - April 2024
- Platform Release 275 - March 2024
- Platform Release 274 - March 2024
- Platform Release 273 - February 2024
- Platform Release 272 - February 2024
- Platform Release 271 - January 2024
- Platform Release 270 - January 2024
- Platform Release 269 - January 2024
- Platform Release 268 - December 2023
- Platform Release 267 - November 2023
- Platform Release 266 - November 2023
- Platform Release 265 - November 2023
- Platform Release 264 - October 2023
- Platform Release 263 - October 2023
- Platform Release 262 - September 2023
- Platform Release 261 - September 2023
- Platform Release 260 - August 2023
- Platform Release 259 - August 2023
- Platform Release 258 - July 2023
- Platform Release 257 - July 2023
- Platform Release 256 - July 2023
- Platform Release 255 - June 2023
- Platform Release 254 - June 2023
- Platform Release 253 - May 2023
- Platform Release 252 - May 2023
- Platform Release 251 - April 2023
- Platform Release 250 - April 2023
- Platform Release 249 - March 2023
- Platform Release 248 - March 2023
- Tulip Player Releases
- Player 2.7.2 Release - February 2025 New
- Player 2.7.1 Release - January 2025
- Player 2.7.0 Release - December 2024
- Player 2.6.2 - September 2024
- Player 2.6.1 - September 2024
- Mobile Player 2.4.0 Release
- Player 2.6.0 Release - August 2024
- Player 2.5.1 Release - February 2024
- Mobile Player 2.3.4 Release Notes - May 2024
- Mobile Player 2.3.3 Release - February 2024
- Player 2.5.0 Release - January 2024
- Mobile Player 2.3.2 Release - November 2023
- Player 2.4.1 Release - November 2023
- Mobile Player 2.3.1 Release - November 2023
- Player 2.4.0 Release - September 2023
- Player 2.3.1 Release - July 2023
- Player 2.3.0 Release - July 2023
- Player 2.2.1 Release - June 2023
- Mobile Player 2.2.1 Release - June 2023
- Mobile Player 2.1.4 Release - May 2023
- Player 2.2.0 Release - May 2023
- Player 2.1.2 Release - March 2023
- Player 2.1.0 Release - March 2023
- Tulip OS Releases
- Tulip OS60 Release - March 2025 New
- Tulip OS 58.2 & 59.1 Release - December 2024
- Tulip OS 59 Release - October 2024
- Tulip OS 58.1 Release - July 2024
- Tulip OS 58 Release - July 2024
- Tulip OS 57 Release - March 2024
- Tulip OS 55.5 & 56.4 Release - February 2024
- Tulip OS 56 Release - January 2024
- Tulip OS 54.1 Release May 2023
- Tulip OS 55 Release - September
- Library Releases
- Library Release - r83 Updated
- Library Release - r82
- Library Release - r81
- Library Release - r80
- Library Release - r79
- Library Release - r78
- Library Release - r77
- Library Release - r76
- Library Release - r75
- Library Release - r74
- Library Release - r73
- Library Release - r72
- Library Release - r71
- Library Release - r70
- Library Release - r69
- Library Release - r68
- Library Release - r67
- Library Release - r66
- Library Release - r65
- Library Release - r64
- Library Release - r63
- LTS Releases
- Platform Releases

List of Fields in the Analytics Context Pane
Article summary
Did you find this summary helpful?
Thank you for your feedback
List of Fields in the Analytics Context Pane
A Guide to All the Possible Fields in the Analytics Editor.
Below is a description of all the possible fields that can be selected in Analytics
Aggregation Functions
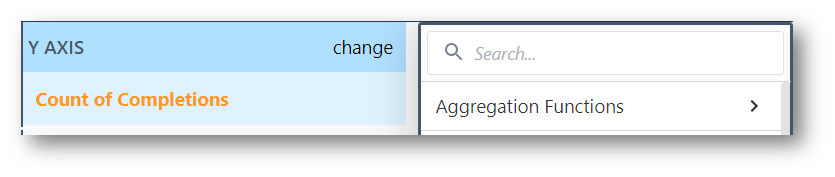
Aggregation Functions denoted with * can also be utilized in Expressions for more complex analyses.
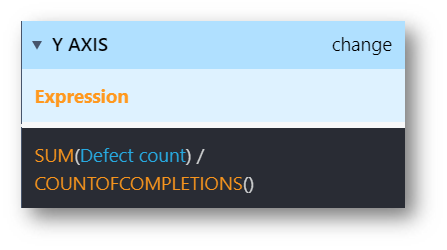
Expression
Separate from the overall expression editor, this expression editor can be used for aggregation functions, and is typically useful in the Y axis.
Example: Finding the total percentage of defective parts from the number of completions.
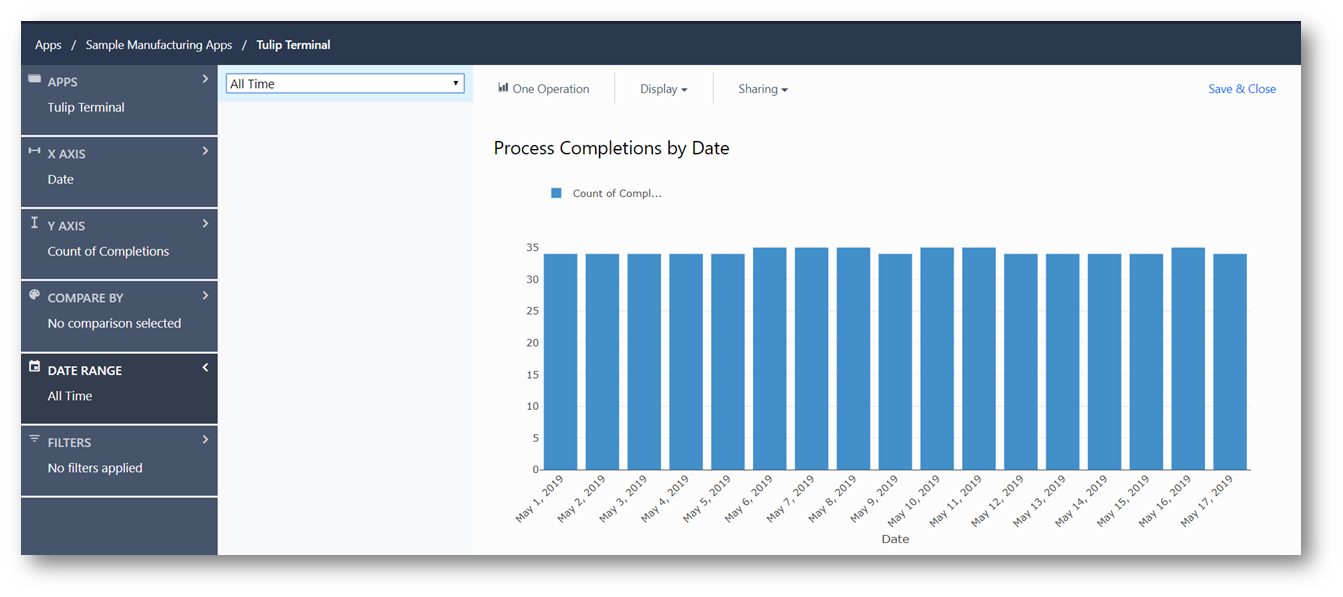
Count of Completions*
A summation of all the Completions that have successfully run in a given app or apps with the selected criteria. If there is no set criteria, this will return the total number of completions.
Percent of Completions
Percentage of Completions that match a given criteria.
Percent Where True
Frequency that the given criteria is True. Often, this is a good place to check for FPY using a Boolean "Pass/Fail" Variable.
Percent Where False
Frequency that given criteria is False. The is the inverse Percent Where True. Percent Where False added to Percent Where True on the same data set should equal 100%.
Count Where True
Returns the total count of Completions that match a given criteria.
Count Where False
Returns the total count of datapoints that match a given criteria that is False.
Average*
Gives the average of a number Variable.
Median
Gives the median value of a number value.
Sum*
Provides the summation for a Variable. For more complex and conditional sum statements, SUM() can be used as a function in the Expression Editor.
Minimum*
Returns the minimum historical value of a given Variable or Table Record Field.
Maximum*
Returns the maximum historical value of a given variable or Table Record Field.
Mode
Returns the most frequent value of a given Variable or Table Record Field.
Standard Deviation
Returns the standard deviation of a number Variable or Expression, categorized by the X axis.
95th Percentile
Returns the 95th percentile of a numerical data set. This value means that 95% of the values are below this number.
5th Percentile
Returns the 5th percentile of a numerical data set. This value means that only 5% of the values are below this number.
Ratio
Returns the ratio of one number Variable or Expression to another. This takes in two number variables (or expressions), where the first acts as the numerator, and the second as the denominator.
Ratio Complement
Similar to ratio, but takes in two conditions of any type. These conditions may be set when one variable or field is equal to a given condition. It may also be a number variable or an expression. This also takes the first argument as a numerator, and the second as a denominator.
Fields
Fields are best used as an X axis, or something to Compare By in analyses. This article has some more information on Fields.
NOTE
Not all of this data is available for Table Data analyses. Each field used in sorting must be added to a column in your Table to be accessable in analyses.
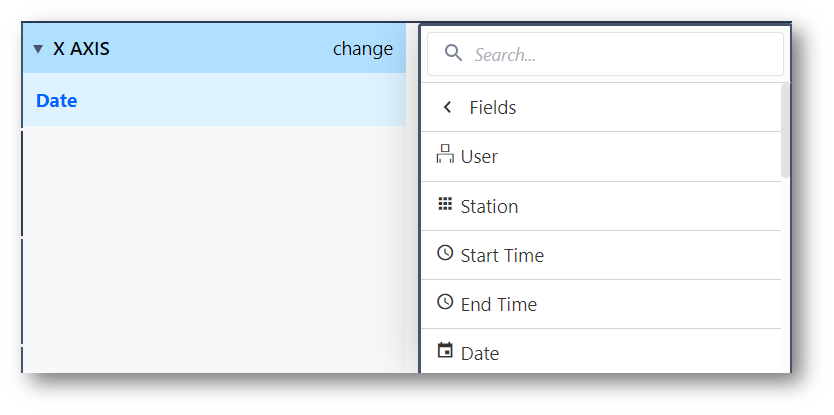
User
The logged in user who Completed the app.
Badge ID
Similar to User, but gives the assigned Badge ID instead of the name.
Station
Which station the app completed at.
Start Time
When the app began working towards a completion.
End Time
When the app completed.
Week
Groups app completions by the week they completed. Useful for viewing aggregations on a week-by-week basis.
Month
Groups app completions by month.
Year
Groups app completions by year.
Shift Type
Categorizes data by the Shift Type worked. Only applicable to Enterprise Accounts.
Shift Duration
Displays or categorizes the duration of the Shift Type. Only applicable to Enterprise Accounts.
Is Working Day
Categorizes completions by the status of being a scheduled workday or not. Only applicable to Enterprise Accounts.
Day of Week
Categorizes completion data by the day of the week. This will aggregate matching days. For example, if given an All Time range, the analysis will stack all Monday values together.
Hour of Day
Categorizes completion data by hour of the day. Aggregates similarly to Day of Week.
Hour
Distills all data to the hour it was completed. This field gives all historical data by hour, and is not aggregated like Hour of Day.
Process Cycle Time
Displays the overall runtime of the App completion.
App
Categorizes data by which app the data came from. Applicable only to analyzing data from multiple apps.
App Version
Groups app data by the Version of the App ran to create the Completion.
Table Records
Here, you can select any table field that is used within the app in the analysis. For more detailed information, check out this article on Table Analyses.
App Variables
A list of all app variables used within the target app can be found here.
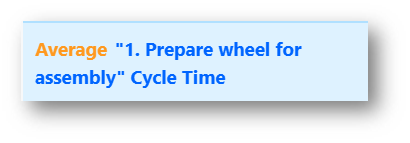
App Steps
All Steps within the app are listed here, in the form of cycle time spent on the steps.
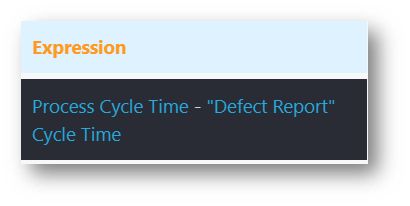
Example 1: find the average time spent on a given step.
Example 2: filter out undesired step times from Process Cycle Time.
App Forms
Provides a list of all the fields used within application form steps.
This includes the Signature Form. This is named based on the label of the signature widget within the Signature Form Step. You can use this field as the "X Axis" to show all operators that have signed via the Signature Form, for example.
Functions
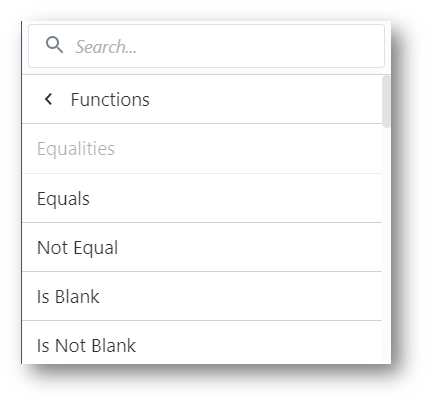
Functions vary slightly in each place used. The entries for variables and expressions may differ slightly when used in the X-axis, Y-axis, or Compare By fields. The following will outline what each function does.
Equals
Checks for equivalency between a Variable or Table Record Field or expression to a given state or value.
Not Equal
Checks that a Variable or Table Record Field or expression is not equivalent to a given state or value.
Is Blank
Checks for completions where the given variable is blank.
Is Not Blank
Checks for completions where the given variable has a value.
Not
Not acts as a modifier to use another Function. It will check for completions where the inverse of the given Function(s) is satisfied.
And
And is another modifier which allows for multiple Functions to be checked, and returns completions where both statements are satisfied.
Or
Or is a third modifier which allows for multiple functions, and returns completions where any of them are satisfied.
Greater Than
Checks that a numeric value is greater than a given value or expression.
Greater Than Or Equal To
Checks that a numeric value is greater than or equal to a given value or expression.
Less Than
Checks that a numeric value is less than a given value or expression.
Less Than or Equal To
Checks that a numeric value is less than or equal to a given value or expression.
In Last N Working Days
Checks completions that were in the previous N days. Working days are set on a default, unless defined by Schedules (Enterprise Accounts).
Expression
Expression allows use of the Expression Editor to write custom expressions. For more detail, read about using the Expression Editor in Analytics
Bins
Allows binned separation of a numeric value. This allows a histogram to be made in any number of bucketed value ranges with a selected minimum and maximum range.
Link Fields
Returns the data of the first Variable or Table Record Field unless it is null. In that case, the second given variable is returned.
Length Of
On the X-axis, groups completions by the length of a variable in digits. On the Y axis, can be used with an aggregation function to check a given length.
Starts With
Checks that a Variable or Table Record Field begins with a given value.
Ends With
Checks that a Variable or Table Record Field ends with a given value.
Contains
Checks a Variable or Table Record Field contains a given value.
Is Exactly
Checks that a Variable or Table Record Field matches completely with a given value.
Is Not Exactly
Checks that a Variable or Table Record Field is anything other than a perfect match to a given value.
Contains All Of
Not yet released. Checks that the contents of a variable matches the given value anywhere.
Example - Variable value 'ABCDE' contains all of 'BCD'
Does Not Contain All Of
Not yet released. Checks that a variable's contents do not match the given value anywhere.
Further Reading
To better understand these functions, try playing around with sample data. The Tulip Terminal app in each instance has sample data to use. Make sure to filter the analysis to All Time to test the analysis' data.
Did you find what you were looking for?
You can also head to community.tulip.co to post your question or see if others have faced a similar question!
Analytics
Analytics are live updating graphs and metrics calculated based on app data, Table data, and machine data. Analytics can be embedded and dynamically filtered within an application.
App Completion
App Completions are a mechanism to store immutable data from a Tulip app. When an app is completed, all Variable's current values will be stored in the app completions tab. This completion data can be analyzed in Analytics.
By default, after a Completion users will be brought back to the Begin Screen of your application. This behavior can be adjusted with other Transition types.
Variable
Variables are a location to store app information. Variables have a specific type that must match the contents they can store.
Variables are only accessible within a single application and are cleared when the app is restarted or completed.
Variable
Variables are a location to store app information. Variables have a specific type that must match the contents they can store.
Variables are only accessible within a single application and are cleared when the app is restarted or completed.
Expression
A configured code snippet that returns a calculated value based on certain inputs. Expressions have access to all of the variables, Table Records, and any other data available to an application.
Variable
Variables are a location to store app information. Variables have a specific type that must match the contents they can store.
Variables are only accessible within a single application and are cleared when the app is restarted or completed.
Table Record Field
Table Record Fields are single columns within a Tulip Table.
Table Record Field
Table Record Fields are single columns within a Tulip Table.
Variable
Variables are a location to store app information. Variables have a specific type that must match the contents they can store.
Variables are only accessible within a single application and are cleared when the app is restarted or completed.
Table Record Field
Table Record Fields are single columns within a Tulip Table.
Variable
Variables are a location to store app information. Variables have a specific type that must match the contents they can store.
Variables are only accessible within a single application and are cleared when the app is restarted or completed.
Expression
A configured code snippet that returns a calculated value based on certain inputs. Expressions have access to all of the variables, Table Records, and any other data available to an application.
Variable
Variables are a location to store app information. Variables have a specific type that must match the contents they can store.
Variables are only accessible within a single application and are cleared when the app is restarted or completed.
Expression
A configured code snippet that returns a calculated value based on certain inputs. Expressions have access to all of the variables, Table Records, and any other data available to an application.
Tulip Tables
Tulip Tables are a global location to store your production data. Tables are made up of Records (rows). A single can be accessed from multiple apps or stations at the same time. .gif)
App Completion
App Completions are a mechanism to store immutable data from a Tulip app. When an app is completed, all Variable's current values will be stored in the app completions tab. This completion data can be analyzed in Analytics.
By default, after a Completion users will be brought back to the Begin Screen of your application. This behavior can be adjusted with other Transition types.
Variables
Variables are a location to store app information. Variables have a specific type that must match the contents they can store.
Variables are only accessible within a single application and are cleared when the app is restarted or completed.
Steps
A view your users will see within an application. Steps can be viewed chronologically or in whatever order best fits your process.
Steps can be grouped into Step Groups to manage and organize your app Steps.
Variable
Variables are a location to store app information. Variables have a specific type that must match the contents they can store.
Variables are only accessible within a single application and are cleared when the app is restarted or completed.
Table Record Field
Table Record Fields are single columns within a Tulip Table.
Variable
Variables are a location to store app information. Variables have a specific type that must match the contents they can store.
Variables are only accessible within a single application and are cleared when the app is restarted or completed.
Table Record Field
Table Record Fields are single columns within a Tulip Table.
Expression
A configured code snippet that returns a calculated value based on certain inputs. Expressions have access to all of the variables, Table Records, and any other data available to an application.
Variable
Variables are a location to store app information. Variables have a specific type that must match the contents they can store.
Variables are only accessible within a single application and are cleared when the app is restarted or completed.
Table Record Field
Table Record Fields are single columns within a Tulip Table.
Was this article helpful?
Thank you for your feedback! Our team will get back to you
How can we improve this article?
Your feedback
Comment
Comment (Optional)
Character limit : 500
Please enter your comment
Email (Optional)
Email
Please enter a valid email
