
5S result radar (spider) chart widget
Functionality and set up for the 5S result radar chart widget
This widget can be used at the end of the audit to display the results of a 5S or in a dashboard app for an area along side other analysis.
Configuration:
Chart Data:
SERIES 1 DATA and SERIES 2 DATA: Should be a list of 5 values. The list should be in the order Sort, Set in Order, Shine, Standardise, Sustain. Only the first 5 values will be shown for lists longer than 5 items.
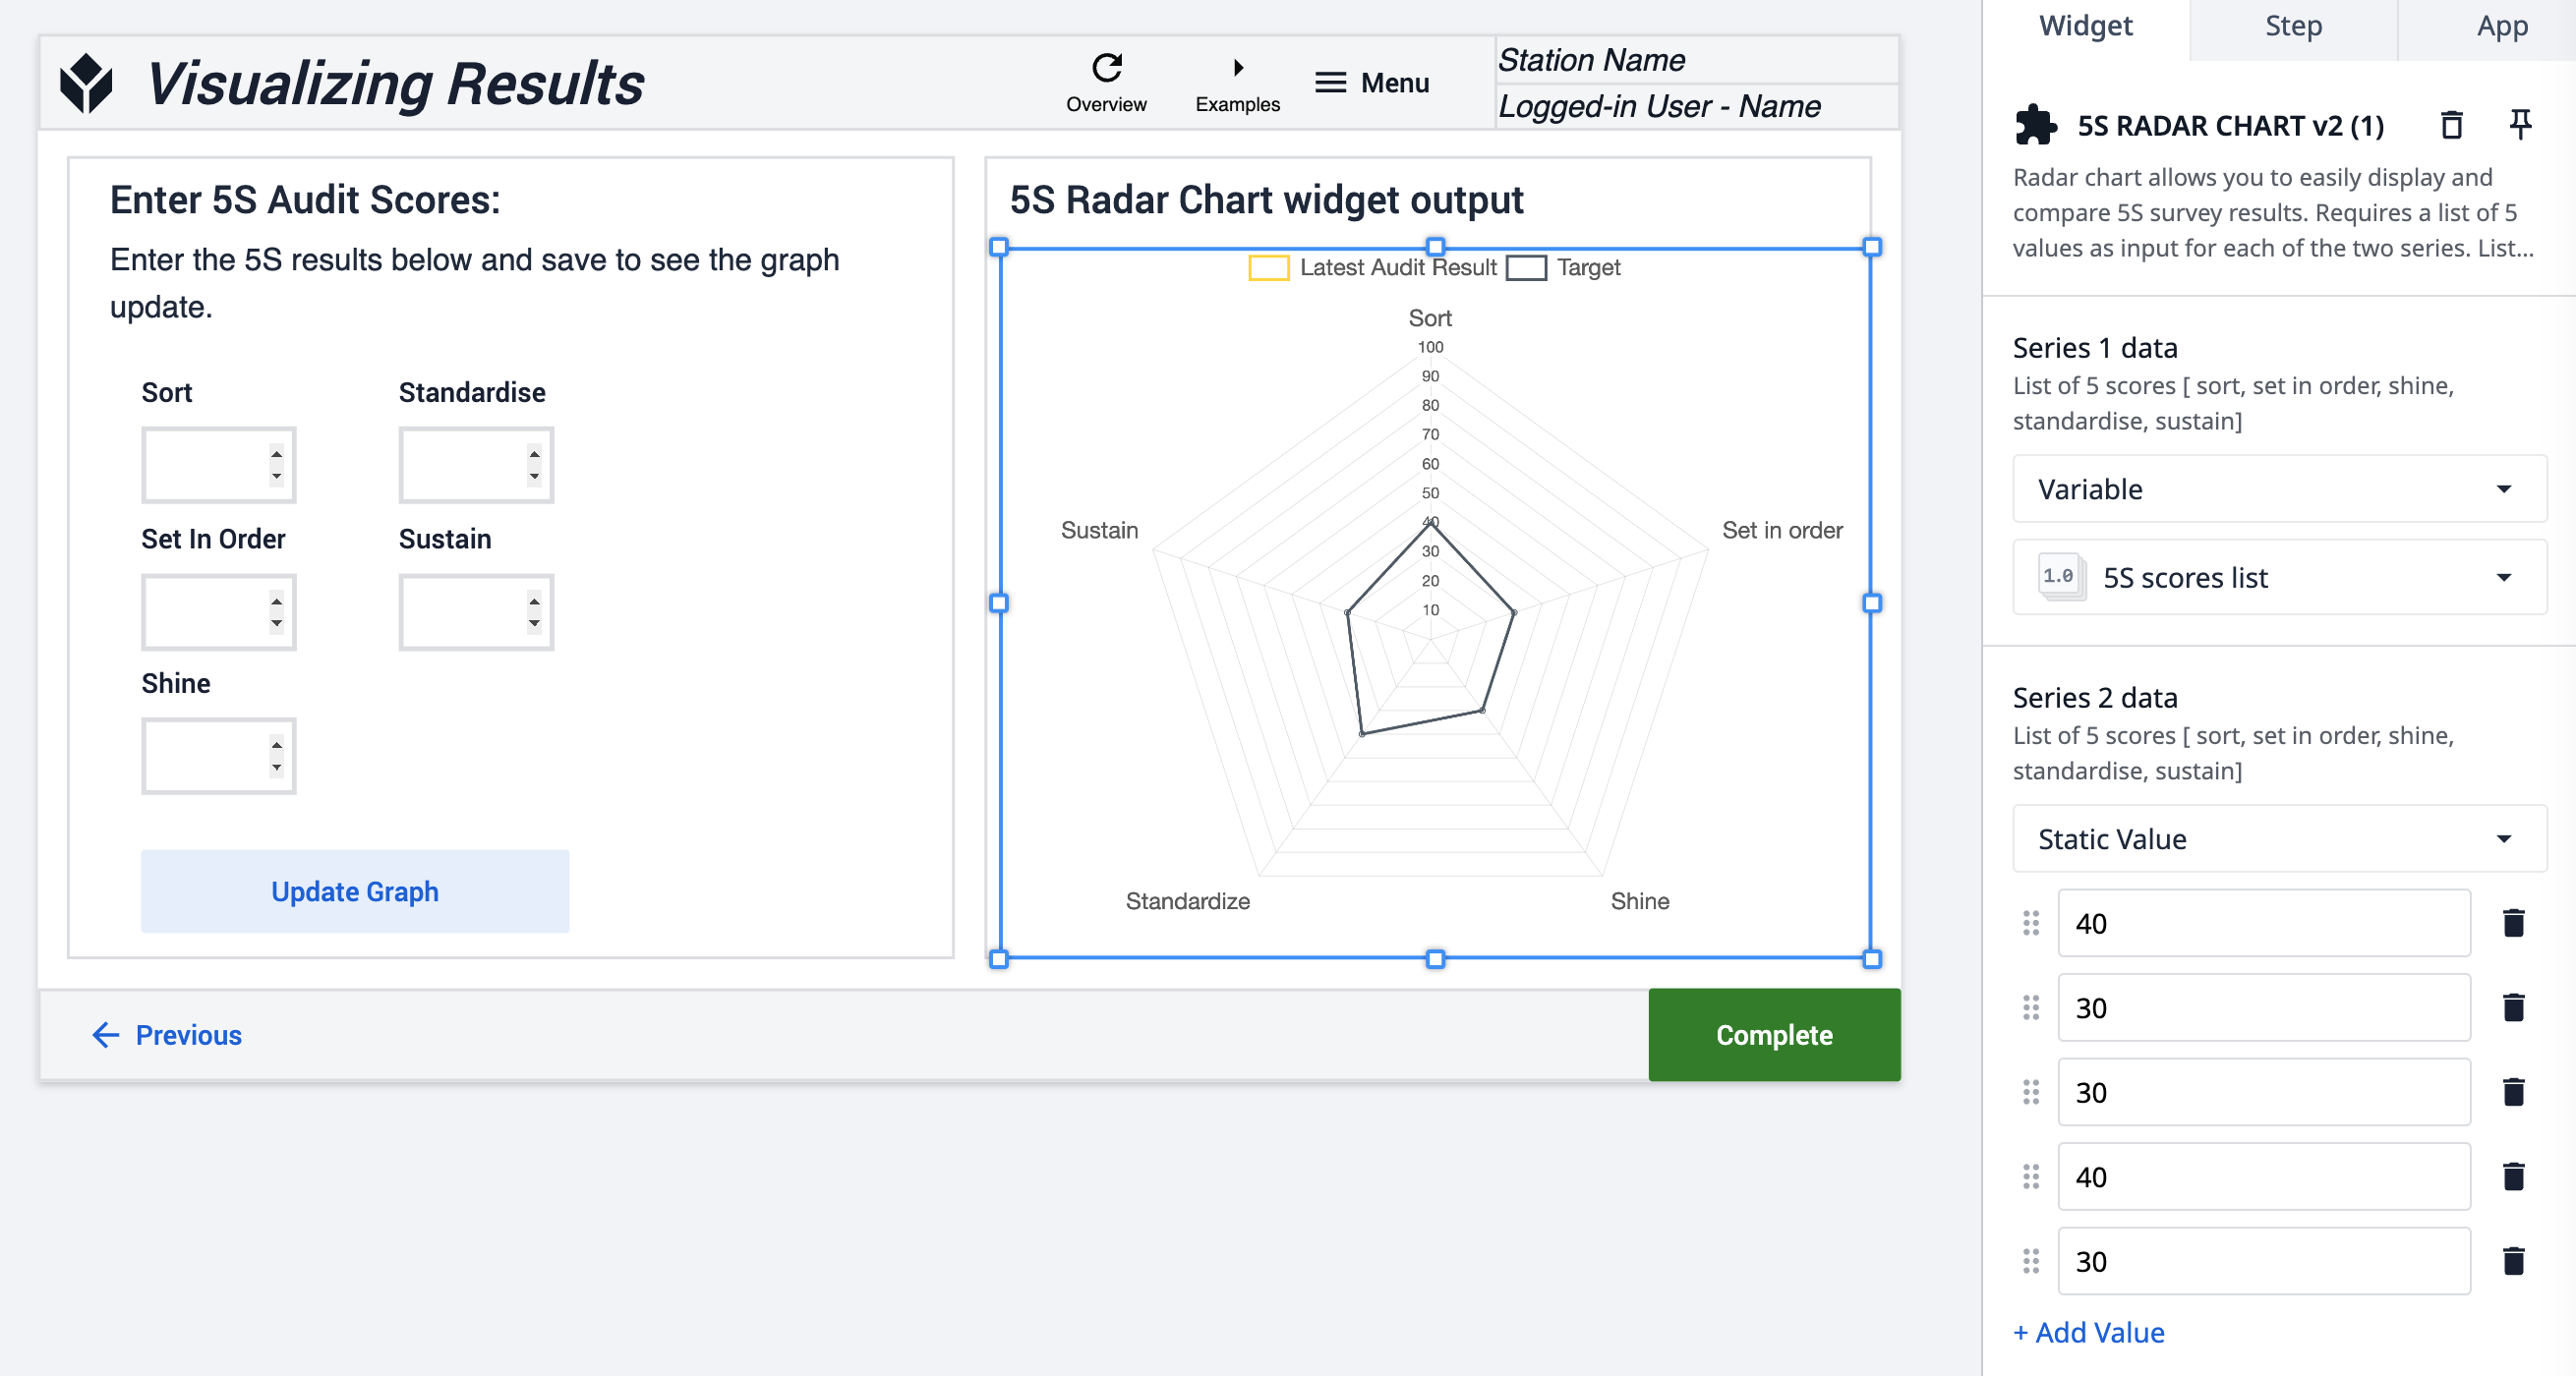
Recommended set up: Prepare a list variable for the first series in the app by combing the scores from the audit or using a table aggregation. Repeat for the second series or alternatively use static values e.g. for a target.
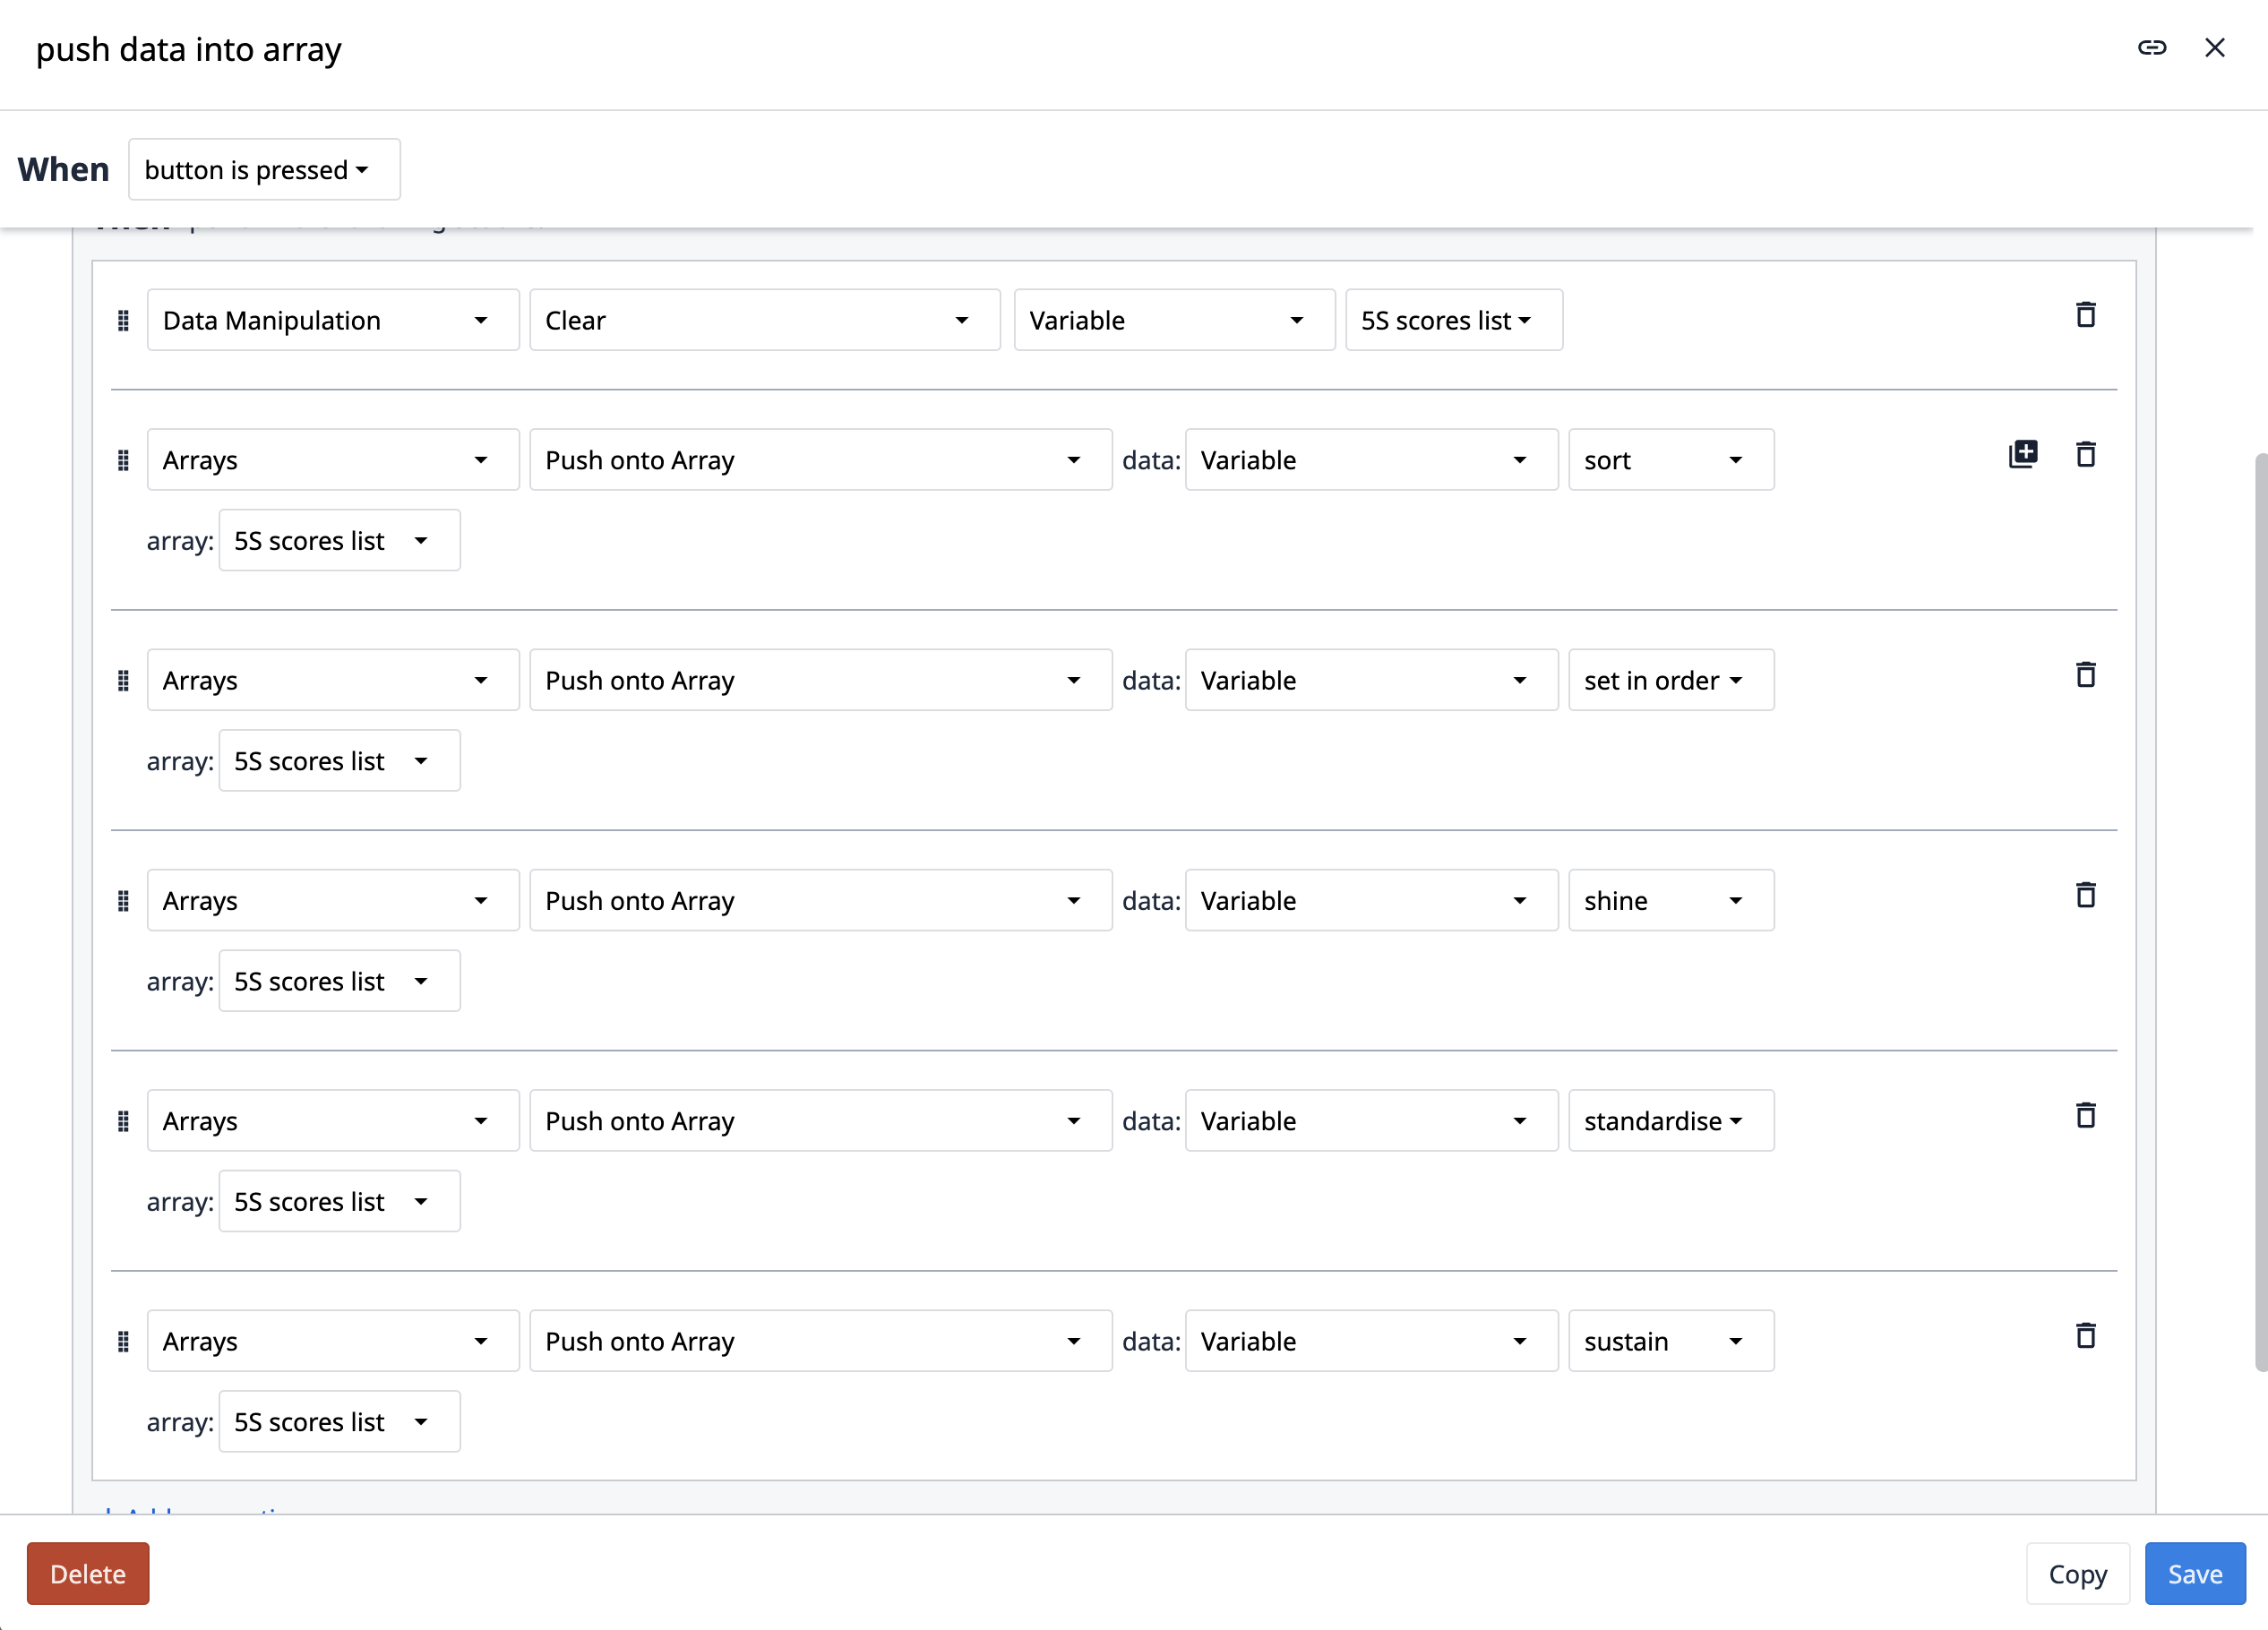
To update the graph, you should use a trigger action to push the recorded data into an array (this should be the preprepared valiable list) , as shown in the example below.
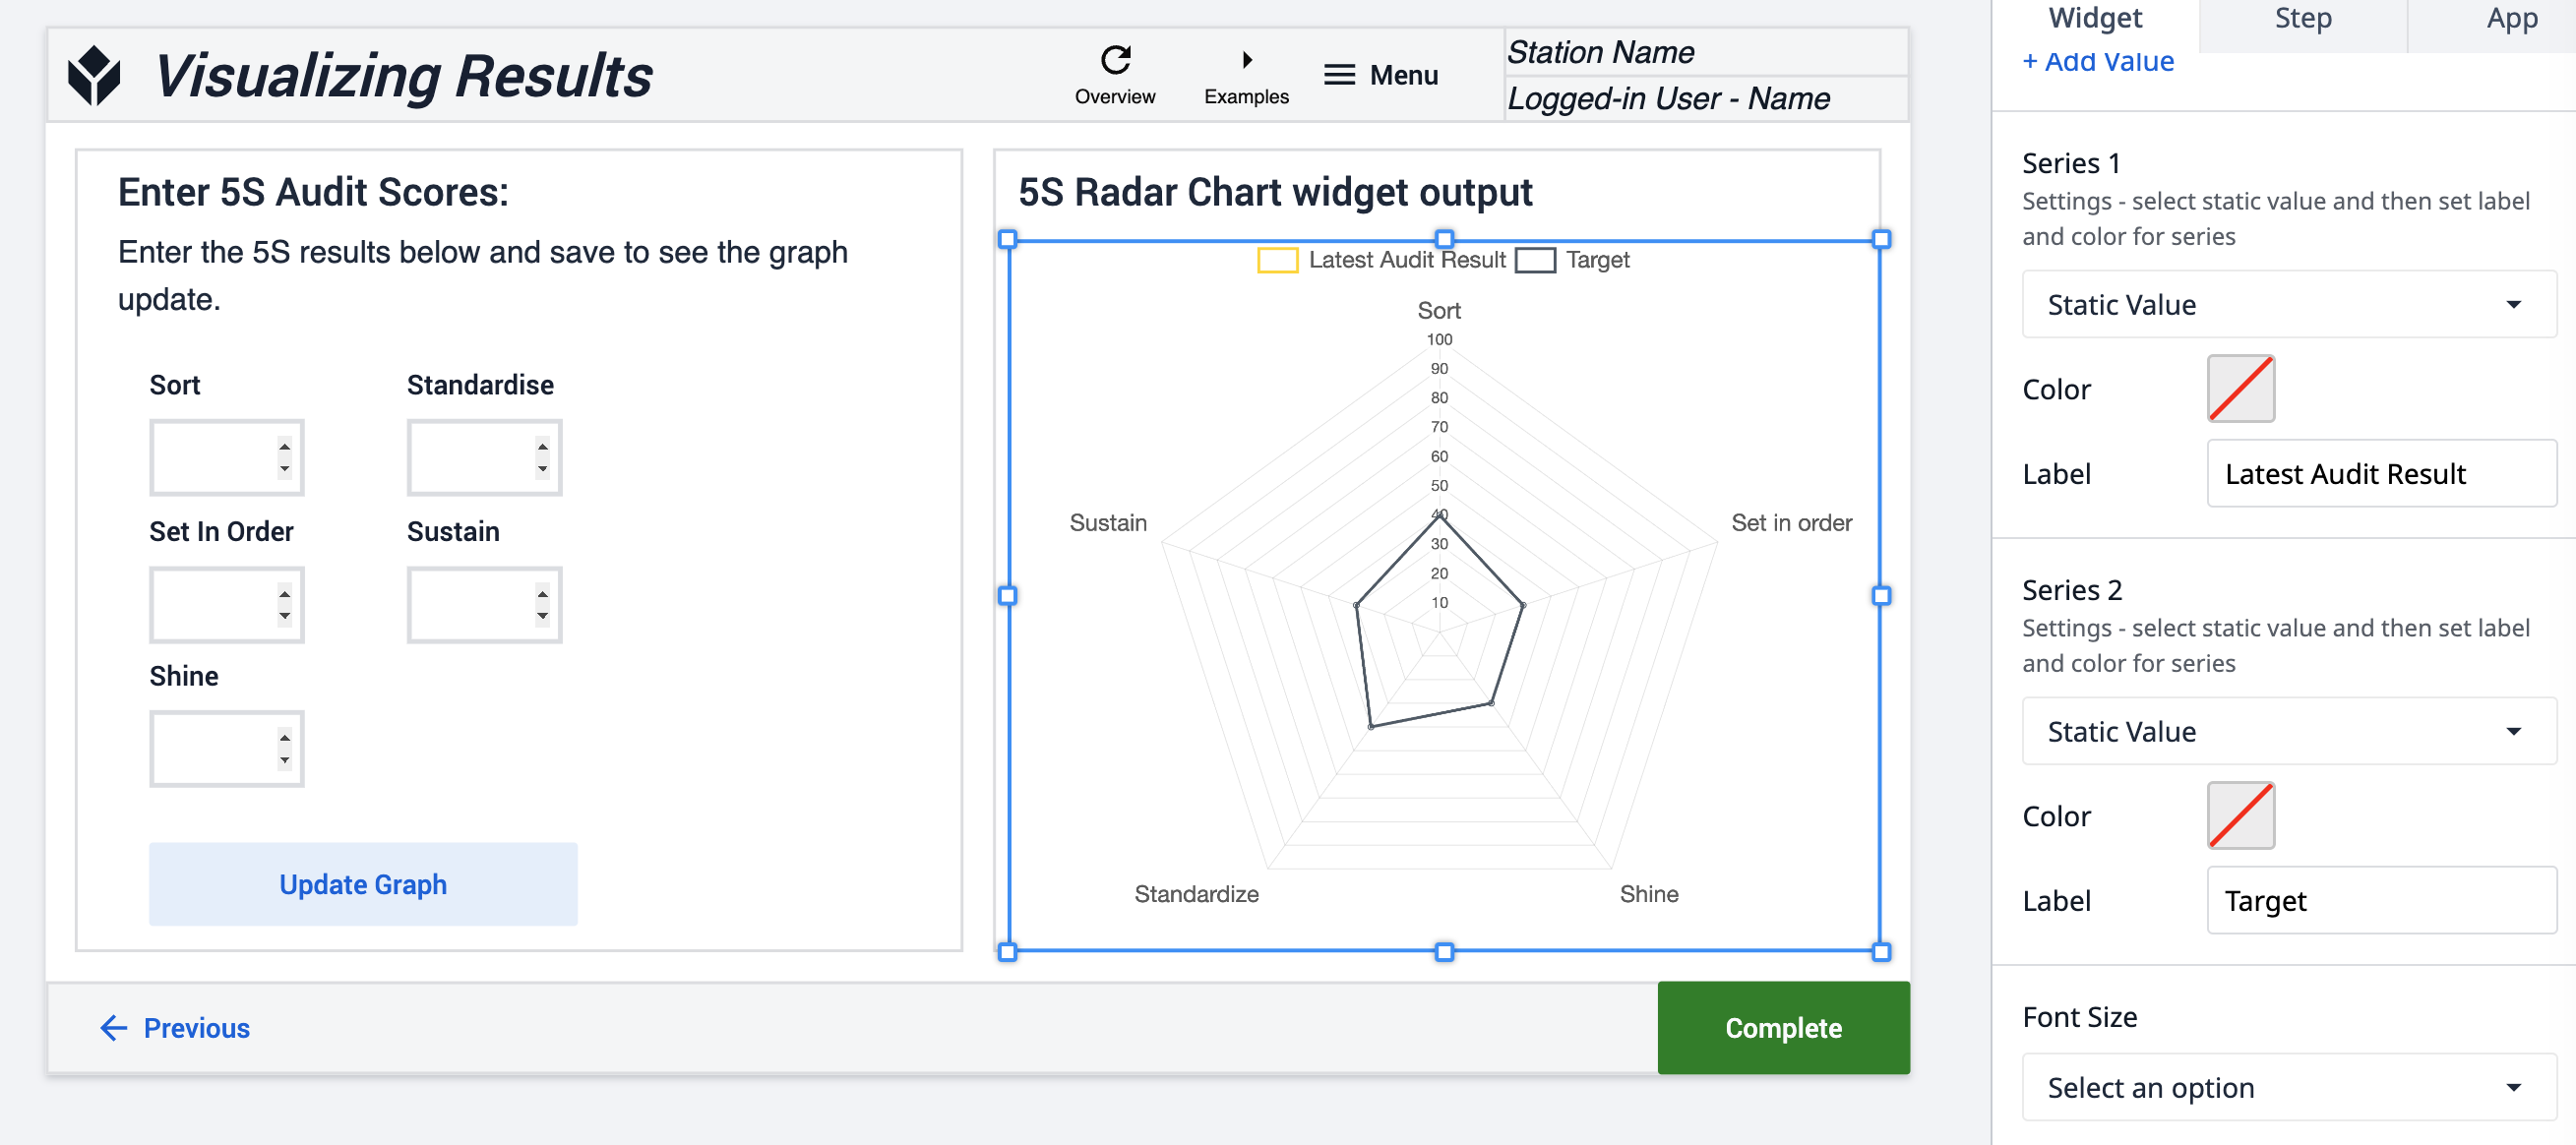
Formating:
SERIES 1 and SERIES2: Label and Line Color can be set up independently for each series.
Recommended set up: Use "Static Value" and select/ enter your options
See the unit test for more examples of set up and the widget in action.