
Imagine you’re a plant manager at a medium-sized company. There are multiple operations for production that produce various items and while the company is doing well, you know there are areas for improvement. There is a high scrap rate, excessive defect parts, and you’re not sure which areas of production are maximizing their time most efficiently. In order to understand what is happening and how you can take measures to improve, you need visibility into various areas of performance in your production.
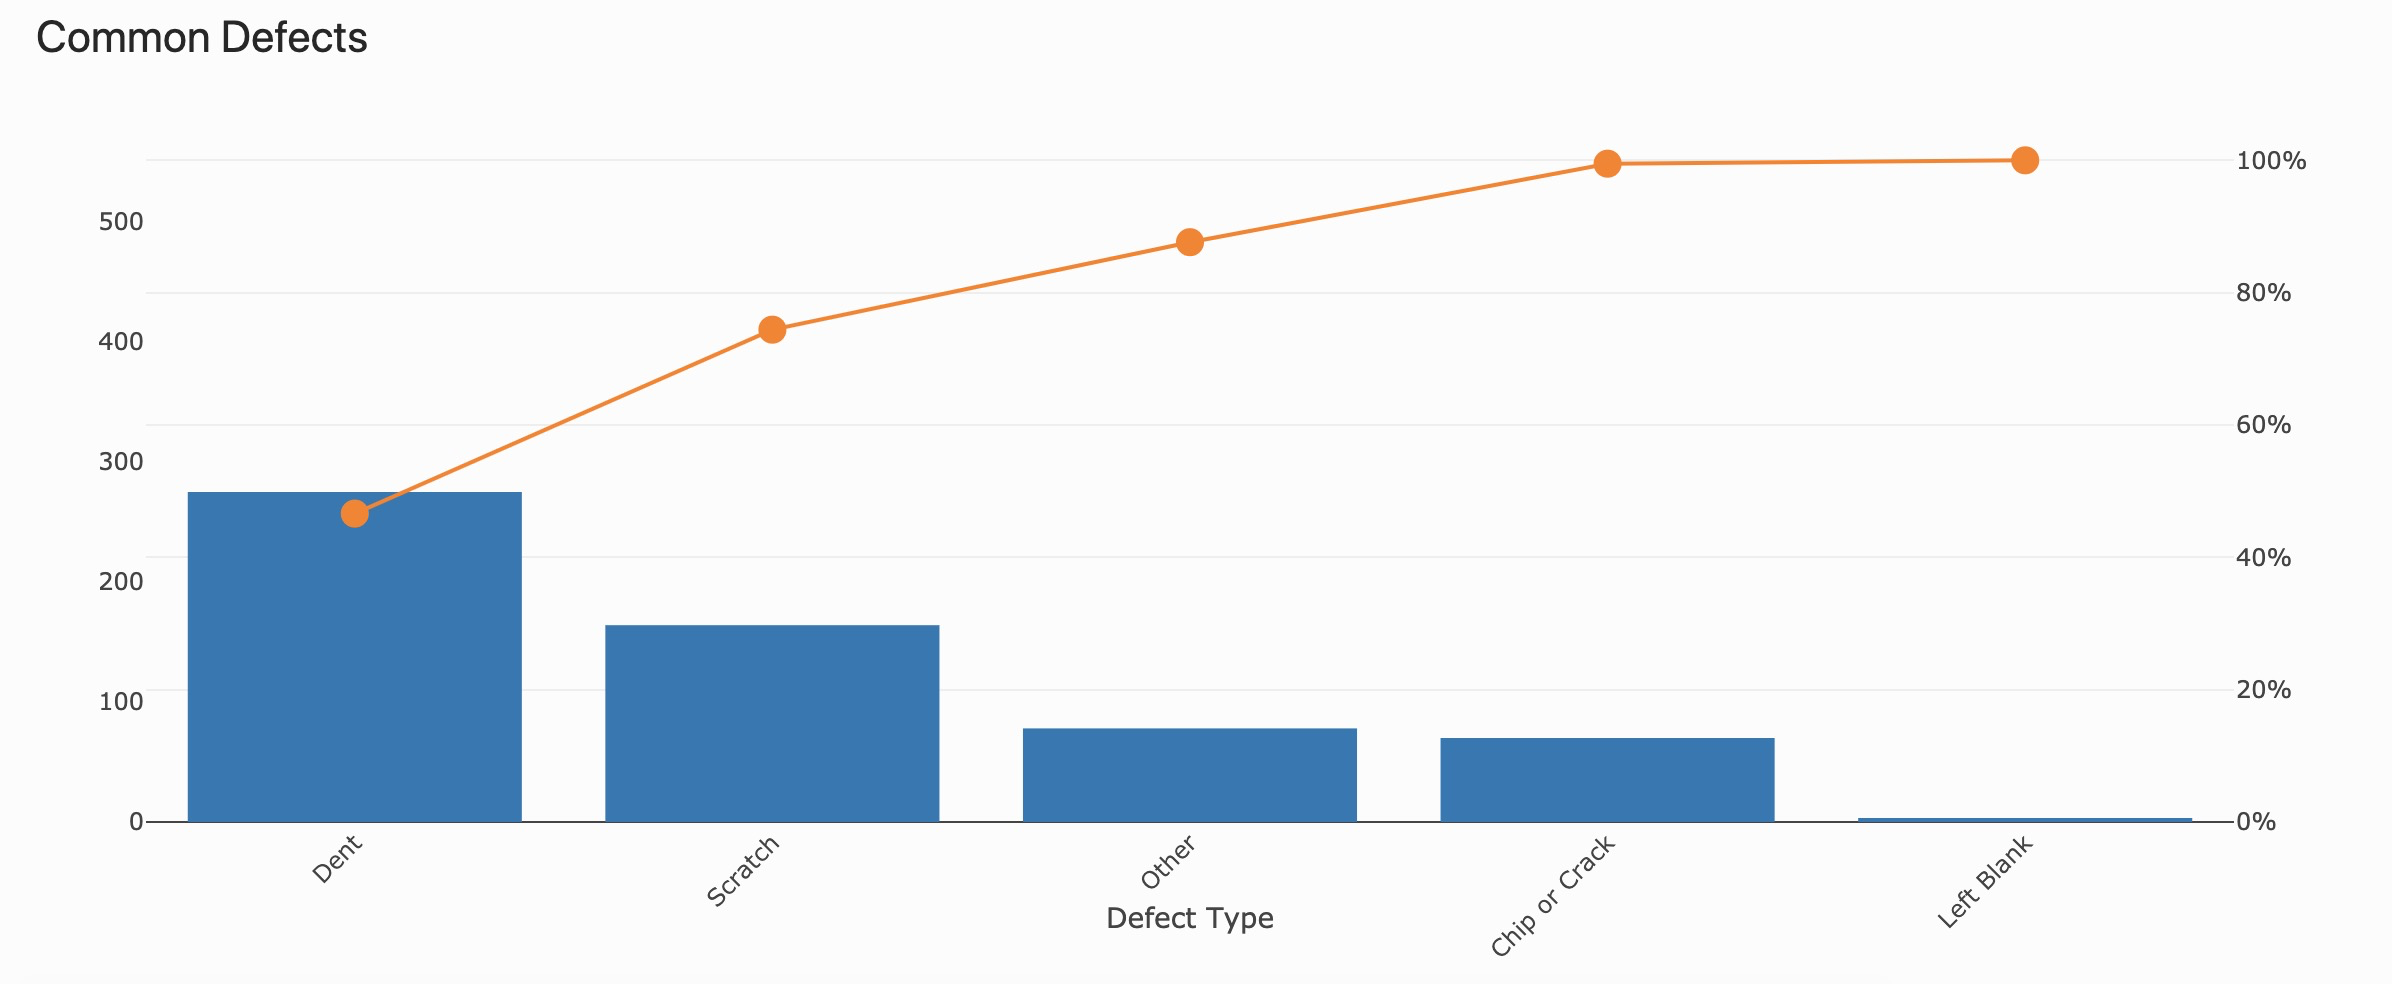
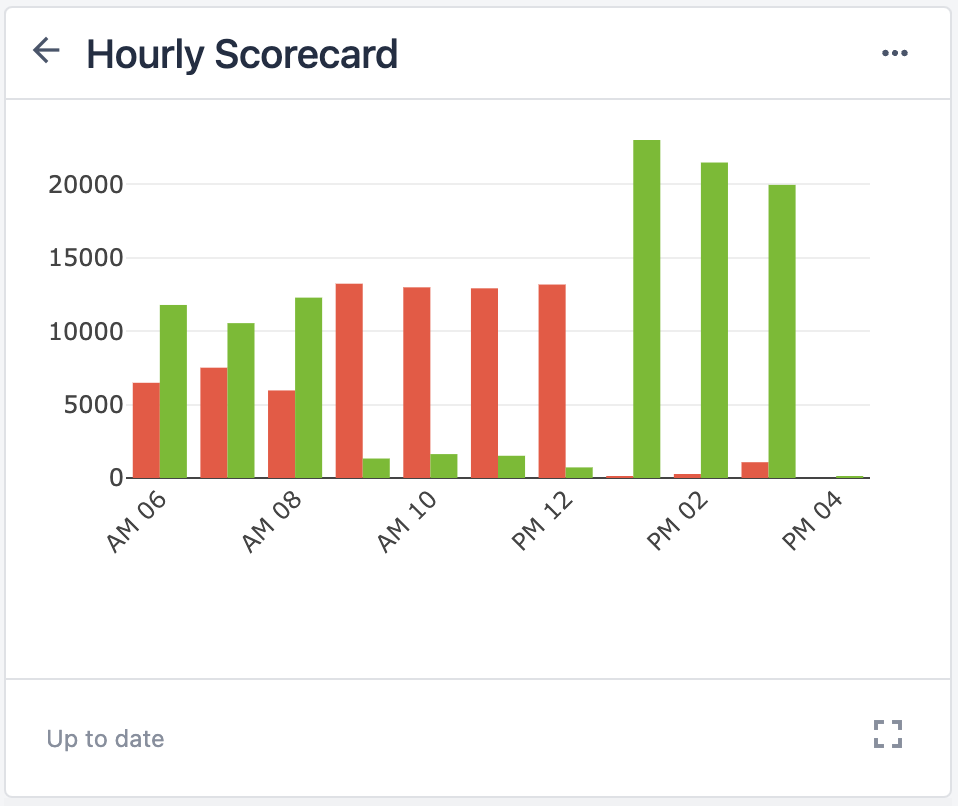
Performance visibility is the ability to track basic facts about production in real time. It involves applications that collect information about quality, delivery, and productivity of work centers. The information gathered from this use case is often measured against established targets or goals for a defined subject. Performance visibility as a use case first encompasses various types of performance data within an operation. This data should reflect your KPIs, such as parts per hour/shift/operator, on-time orders, scrap rate, quality, OEE, FPY, or throughput. The other part of performance visibility is visualizing your data with analytics, dashboards, or other tools. Visualizing production data provides a way to measure how well a line, station, machine, or operator is performing against either a target or historical average. Gathering this data is crucial for taking action on low performing assets and correcting areas to meet your goals. Successfully implemented performance visibility can increase ROI by addressing concerns such as labor costs, scrap, costs, cycle time, and more.
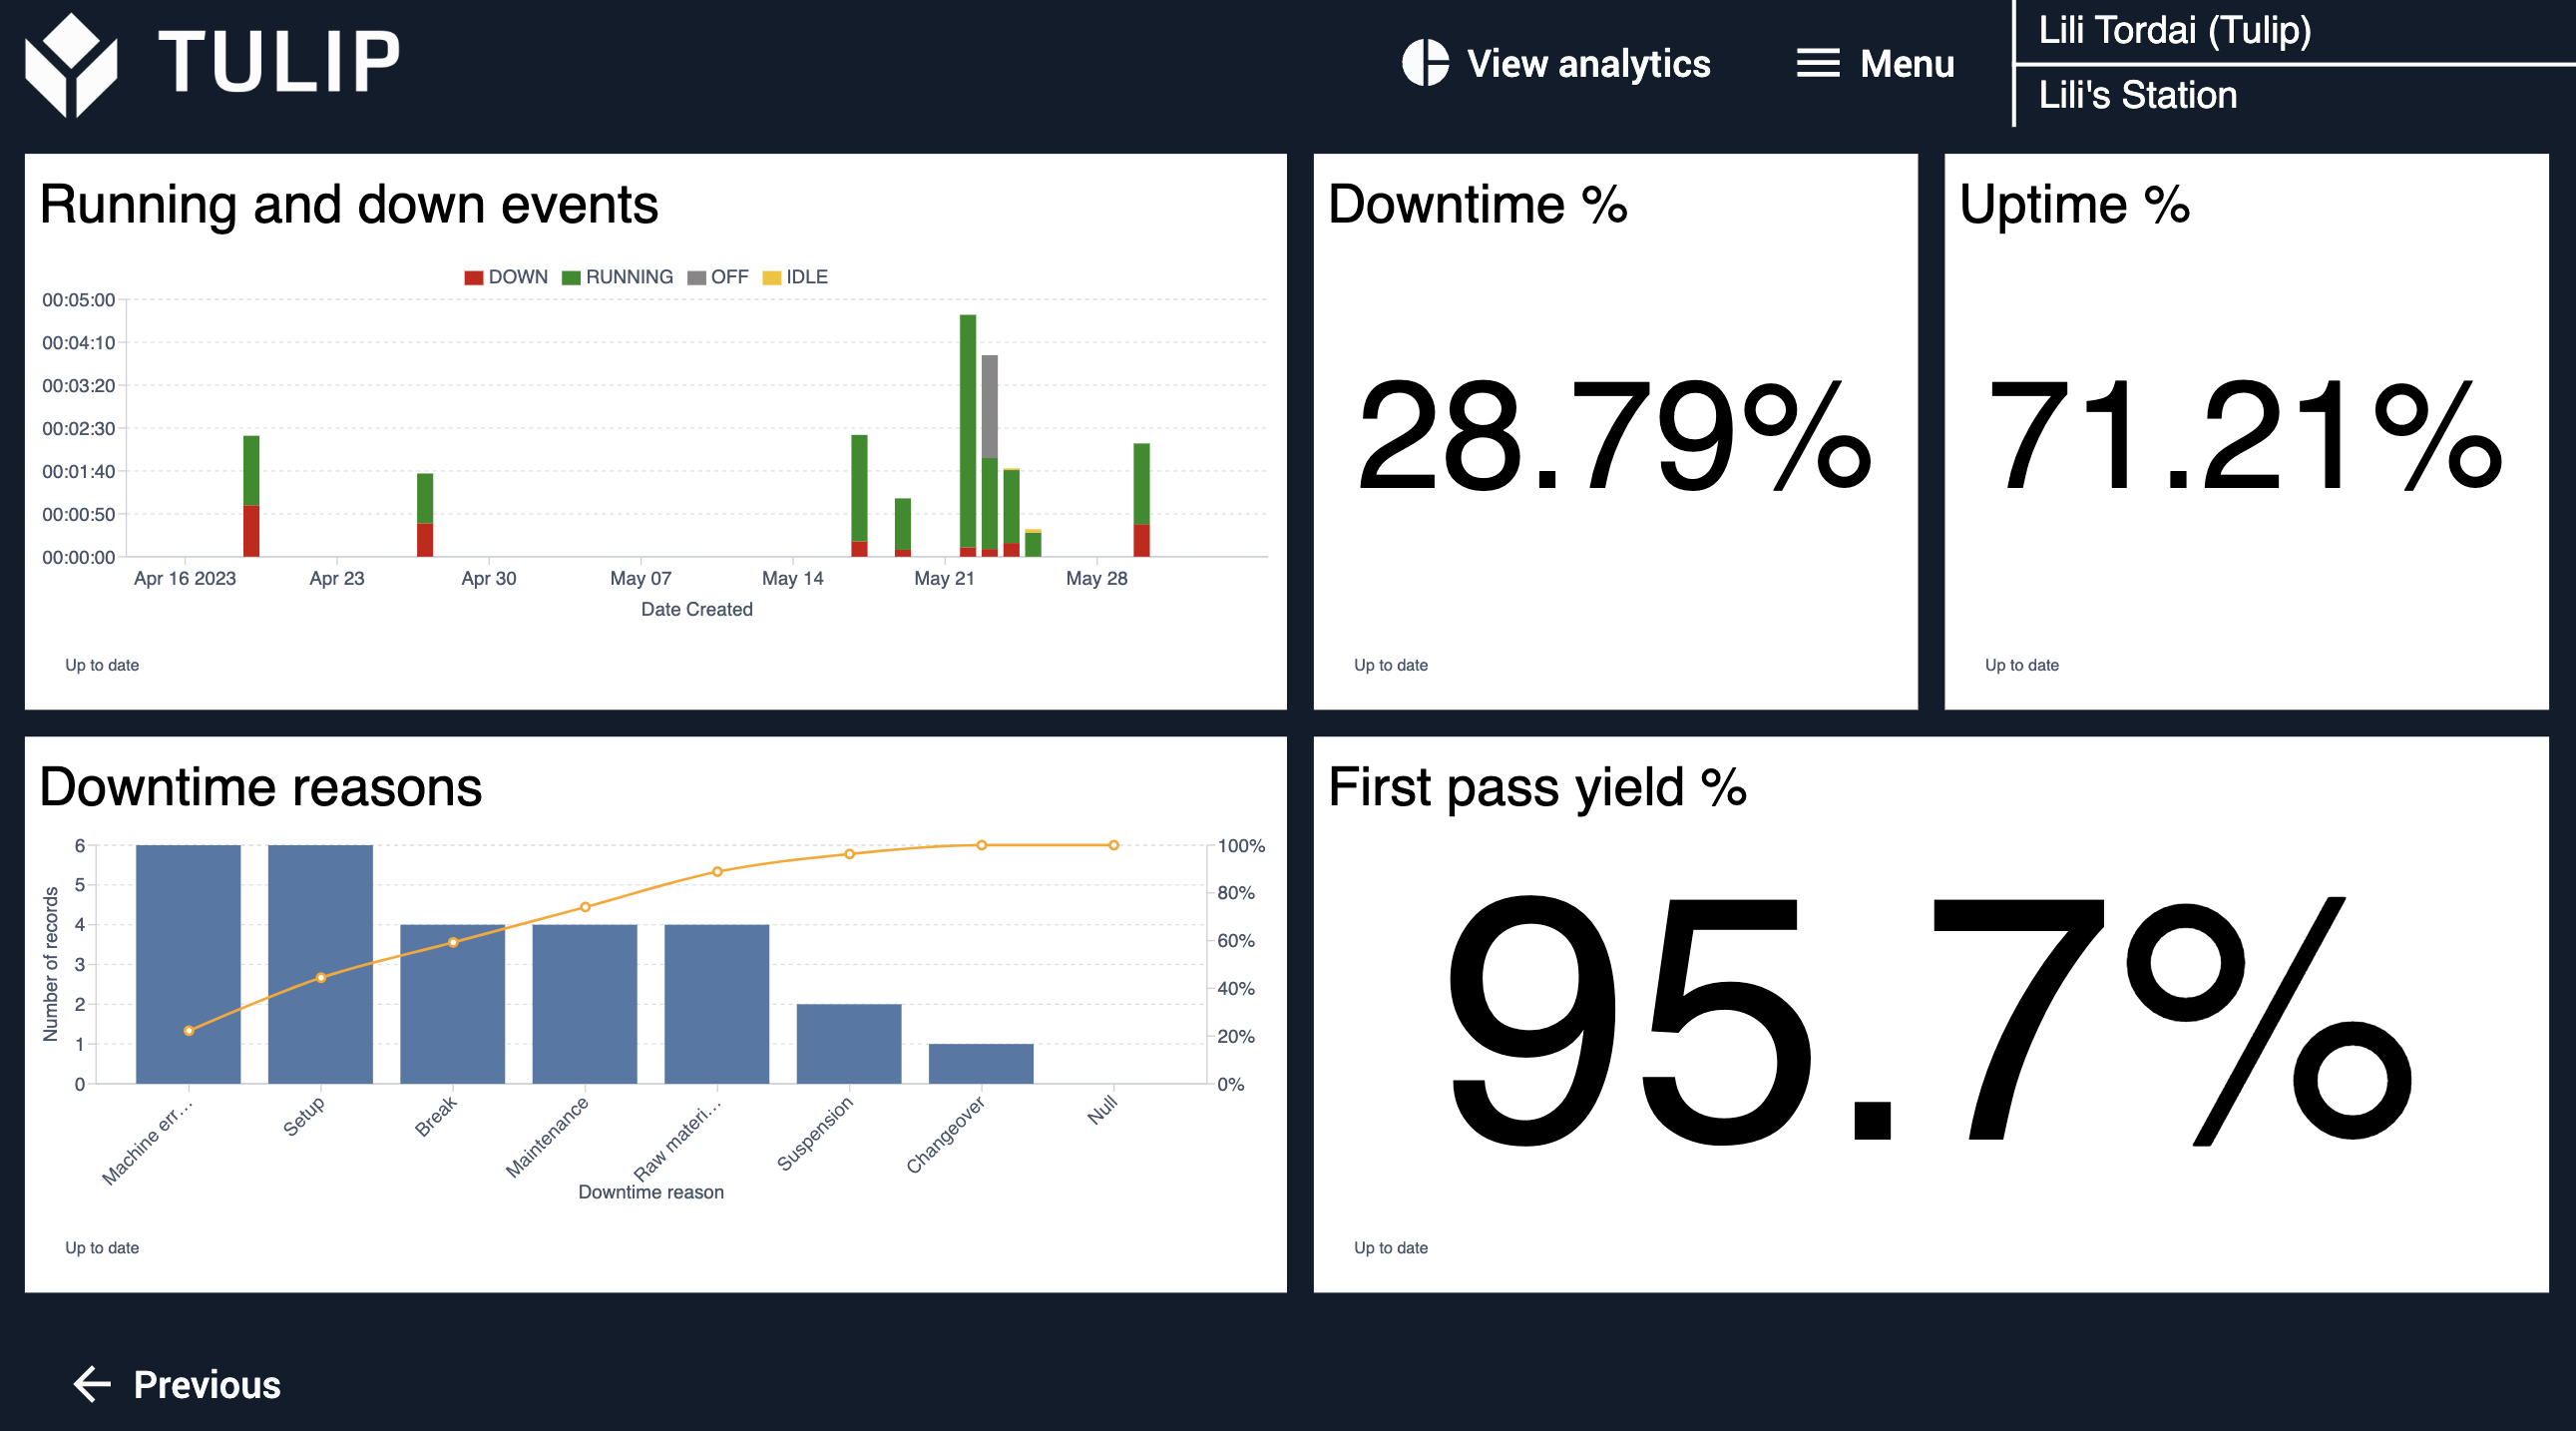
While performance visibility can apply to multiple parts of an operation and use different features within Tulip, visualizing the data with Analytics is an essential part of gaining insight that informs decision making, resolves issues, and reveals opportunities for improvement. Seeing real-time performance data compared against historical data should allow you to understand root causes and prioritize improvements.
Impact and Requirements
Consider the following questions:
- Do you know if cells/lines/machines are meeting their production targets?
- Do track quality (down to the operator level)?
- Do you know where work orders are in real time?
- Can you track cycle time for all of your lines and assemblies?
- Do you know how close you’re hitting targets month-to-month?
Seeing the data leads you to figure out why issues or discrepancies are present and react quickly to correct your course. Companies can drive results through their performance data by determining the priority for improvement and where to start. Tulip allows companies to define their own approach to suit particular needs while also providing ways to standardize and scale this process across an organization. Because performance visibility use cases prioritize collecting basic information, they are suitable for a large number of different manufacturing types and industries. Higher volume production especially benefits from performance visibility, especially as data is refined and gets more granular overtime. Lower volume production also benefits when users focus less on earned value and more on real-time data.
The ideal MVP approach in Tulip should be broken up by use case to resource needs as apps get more complex. Creating different apps for different personas ensures only relevant information is available for each area of operation. Leveraging data from dashboards can inform your company’s KPIs, such as:
- Uptime percent as it relates to downtime root causes
- Production Output, e.g. Units per Hour
- Defect Rate (minimized)
- Cycle time
Performance visibility doesn’t require expert skill or experience with Tulip to get started. Analytics are fairly easy to implement once you have data collected, which you can do using Completions or Tables. The most crucial thing to focus on before building this visibility is identify what area you want to increase insight. Start by defining the subject you need to measure (e.g. station, machine, individual, work center, etc.) and then determine the unit of measurement (e.g. output by week, uptime %, etc.). For regulated industries, keep in mind that you may require more scrutiny with operator inputs to collect data.
How to Get Started
Performance visibility requires two things: data and visualizations. Any other features are dependent on the subject and its measurement. Therefore, it’s crucial to narrow down what you care about to define the problem you want to solve. Choose features that will inform questions about your subject. You can start with existing data that’s pulled each week or month to make it available at will. The deployment and path to value can vary depending on if you are seeking to cut costs or increase revenue. Follow these steps to ensure your process has a solid foundation to begin with:
1. Define the subject you want to measure. Start with a more broad subject to measure and get more granular as needed. These can include:
- A station
- A machine
- An individual
- A work center
- An existing KPI
2. Determine the unit of measurement. For example:
- The downtime percentage of a machine
- An individual’s output of units by week
- The ratio of good parts to bad parts by part ID
3. Determine the best visualization. This may be a single number or a chart.
4. Deploy, monitor data, and iterate. Gather or refine the subject and measurements in order to focus on simple parts of your process. Always remember to start simple.
Only after successfully deploying an app and optimizing its results, should you consider advancing and integrating with other systems. These can include Andon alerting, Blue Print dashboard, Kanban system, and more. You can also begin to build on existing data and real-time events to provide more context and inform decisions that impact other areas of production, such as importing data from a Tulip table into Power BI. This can quickly get complex, so begin with simple measurements and grow from there.
Tulip Resources
Whether you want to learn more about Tulip features to build performance visibility apps or you want to use Tulip’s ready-made templates, we have the tools to help you get started.
Videos
University Courses
Library Apps
- Performance Visibility Terminal
- Shared Performance Visibility Terminal
- Consolidated Performance Visibility Terminal
- Performance Visibility Dashboard
- Mobile Hourly Production Scorecard
Examples
Did you find what you were looking for?
You can also head to community.tulip.co to post your question or see if others have faced a similar question!
.gif)