Streamline sending data from Tulip to Microsoft Fabric for broader analytics opportunities
Purpose
This guide walks through step by step how to send Tulip tables data to Fabric via a paginated REST API query. This is useful for analyzing Tulip tables data in an Azure Data Lakehouse, Synapse Data Warehouse or other Azure Data storage location
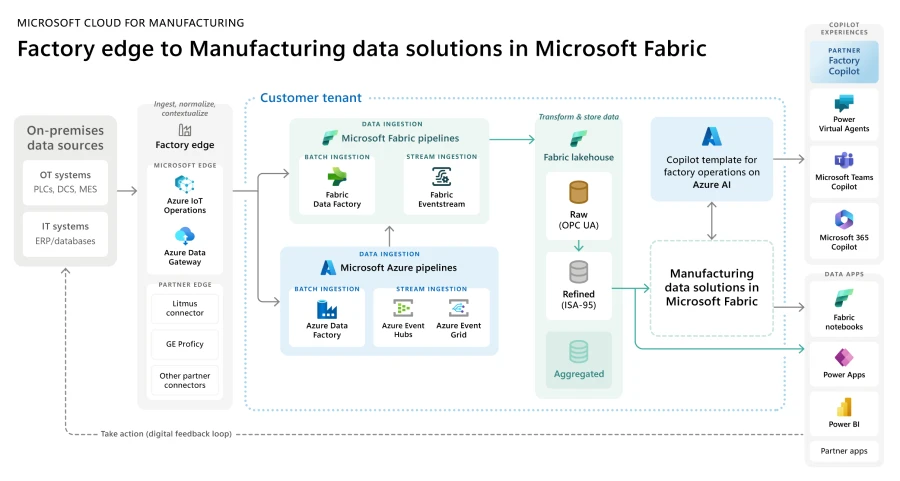
The broader architecture for Fabric -- Microsoft Cloud for Manufacturing is shown below

Setup
Detailed setup video is embedded below:
Overall Requirements:
- Usage of Tulip Tables API (Get API Key and Secret in Account Settings)
- Tulip Table (Get the Table Unique ID
Process:
- On Fabric homepage, go to Data Factory
- Create a new Data Pipeline on Data Factory
- Start with the "Copy Data Assistant" to streamline creation process
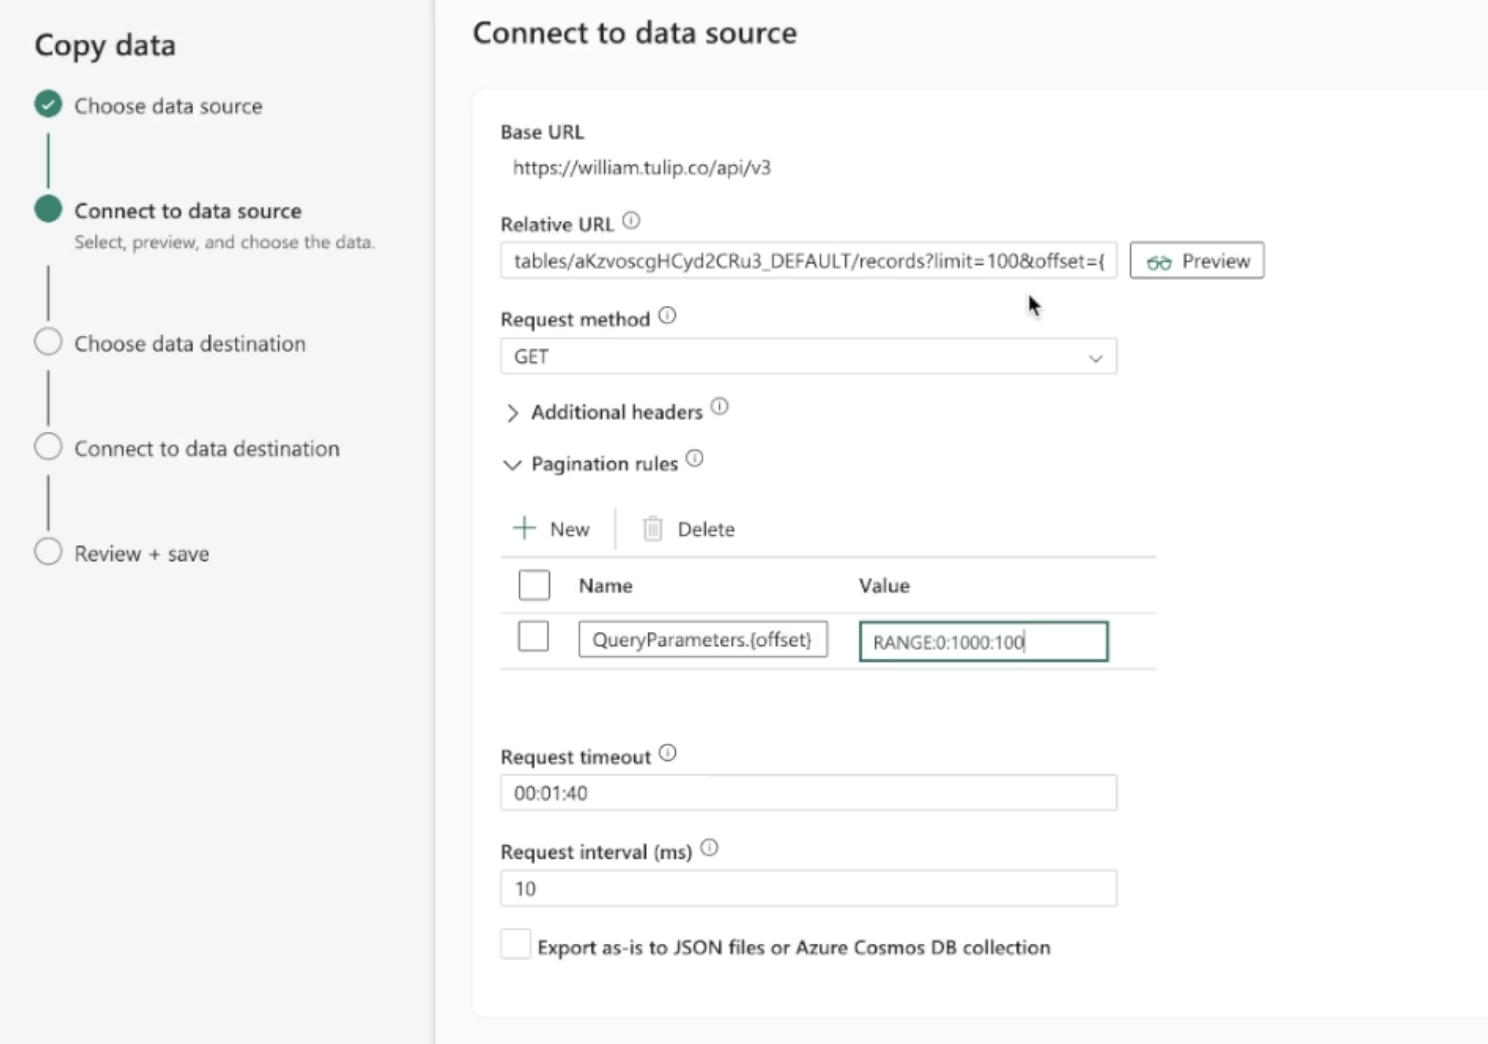
- Copy Data Assistant Details:
- Data Source: REST
- Base URL: https://[instance].tulip.co/api/v3
- Authentication type: Basic
- Username: API Key from Tulip
- Password: API Secret from Tulip
- Relative URL: tables/[TABLE_UNIQUE_ID]/records?limit=100&offset={offset}
- Request: GET
- Pagination Option Name: QueryParameters.{offset}
- Pagination Option Value: RANGE:0:10000:100
Note: Limit can be lower than 100 if needed, but the increment in the pagination needs to match
Note: the Pagination Value for the range needs to be greater than the number of records in the table

- Then you can send this data to a variety of data destinations such as Azure Lakehouse
- Connect to the data destination, review the fields / rename as needed, and you are all set!
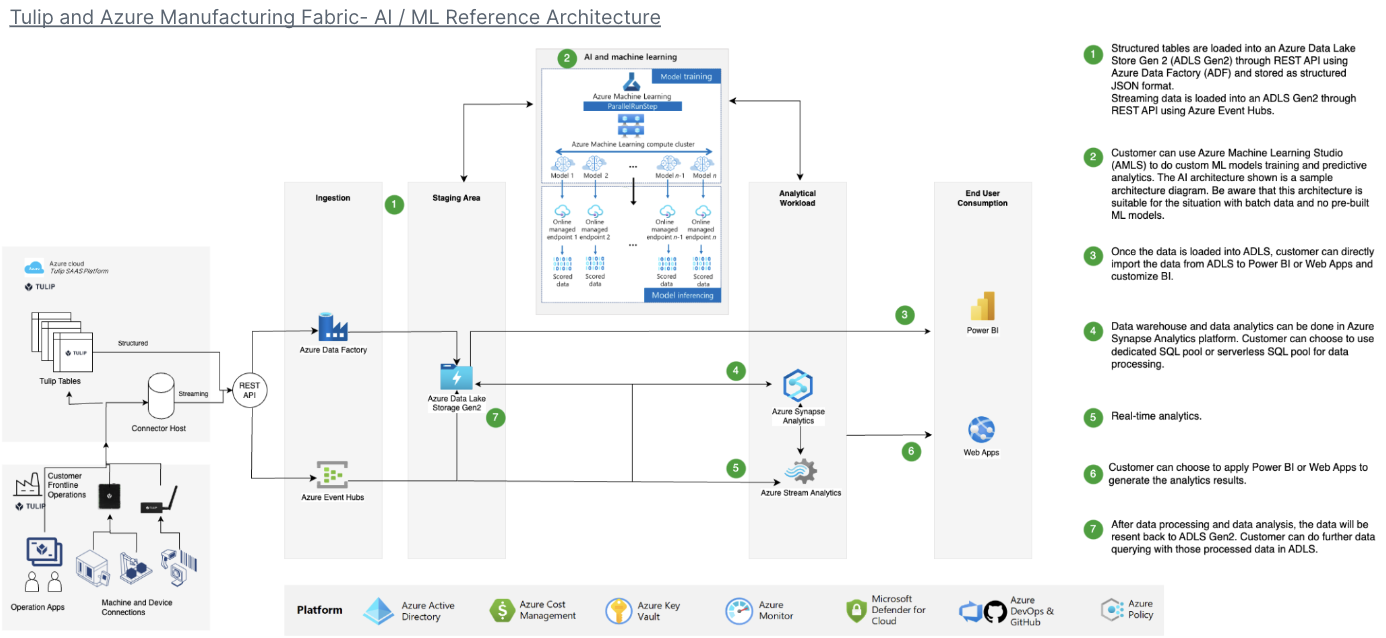
Example Architecture

Use Cases and Next Steps
Once you have finalized the connection, you can easily analyze the data with a spark notebook, PowerBI, or a variety of other tools.
1. Defect prediction
- Identify production defects before they happen and increase right first time.
- Identify core production drivers of quality in order to implement improvements
2. Cost of quality optimization
- Identify opportunities to optimize product design without impact customer satisfaction
3. Production energy optimization
- Identify production levers to optimal energy consumption
4. Delivery and planning prediction and optimization
- Optimize production schedule based on customer demand and real time order schedule
5. Global Machine / Line Benchmarking
- Benchmark similar machines or equipment with normalization
6. Global / regional digital performance management
Consolidated data to create real time dashboards