
:::(Warning)This is an experimental feature. It requires more user feedback before determining whether it will exist in the product long-term.
:::
개요
Tulip 앱은 팀원에게 설명하기 복잡하여 앱의 전체 로직을 이해하기 어려울 수 있습니다.
이 기능을 사용하면 Tulip 외부의 무료 제품에서 앱의 기능을 볼 수 있습니다. 여러분과 팀원은 앱 로직을 검사하여 앱 내에서 어떤 일이 일어나고 있는지 설명하거나 배울 수 있습니다.
권장되는 모든 외부 도구는 데이터의 개인 정보를 보호하며 아무것도 저장하지 않습니다.
앱 로직 내보내기
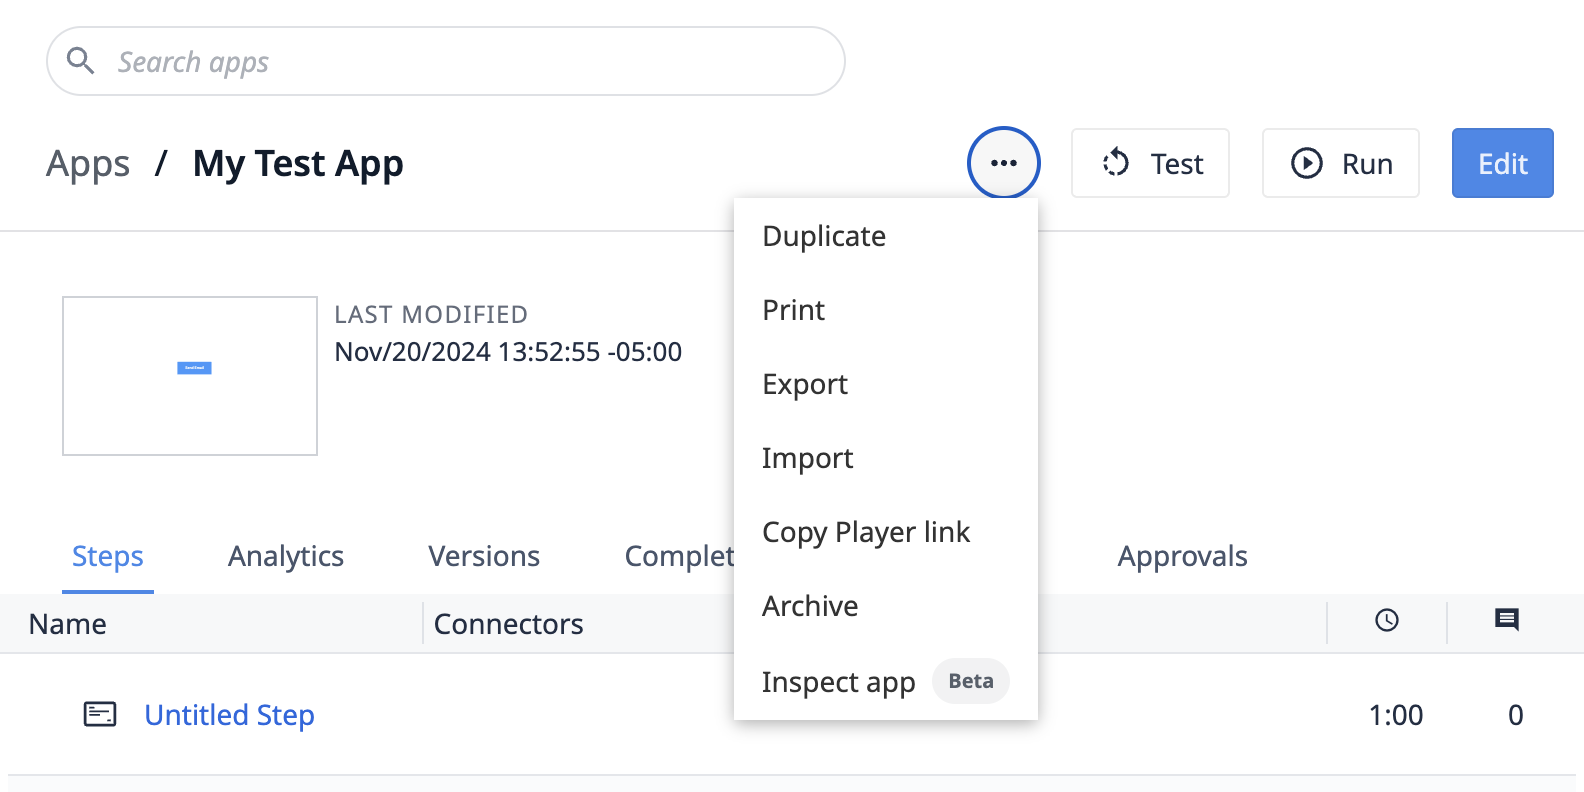
앱 요약 보기에서 점 3개 메뉴를 클릭하고 앱 검사를 선택합니다.
앱의 다이어그램을 보거나 모든 트리거 로직을 한 곳에서 볼 수 있도록 선택할 수 있습니다.
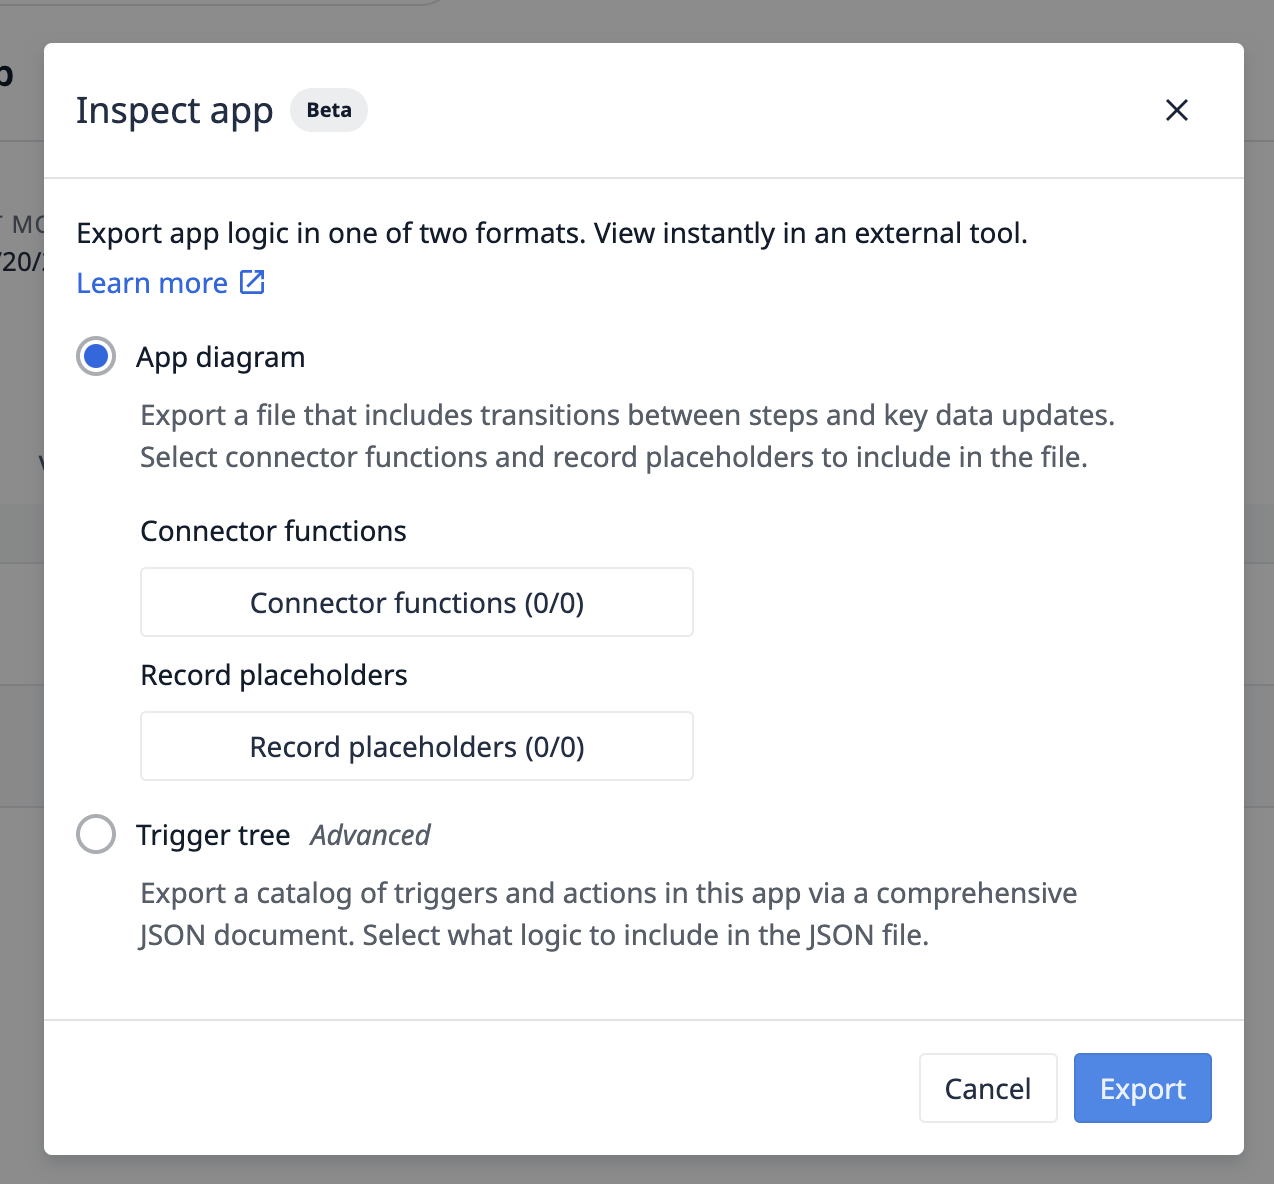
앱 다이어그램
상위 수준의 앱 기능 다이어그램을 보려면 앱 다이어그램을 선택합니다. 그러면 * 단계 * 전환 * 테이블 레코드 업데이트 * 커넥터 함수 호출 간의 관계가 표시됩니다.
이 다이어그램을 사용하여* 팀원에게 앱 내에서 일어나는 일 설명* 데이터 업데이트 및 운영자 작업 순서 보기* 앱의 각 버전에 대한 문서 작성 등의 작업을 수행할 수 있습니다.
앱 다이어그램 보기
- 내보내기를 클릭하여 앱 다이어그램의 텍스트 파일을 다운로드합니다. 이 텍스트 파일은 Mermaid 구문으로 되어 있습니다.
- 파일의 콘텐츠를 복사합니다.
- mermaid.
live{target=_blank}로이동하여 복사한 텍스트를 화면 왼쪽의 텍스트 상자에 직접 붙여넣습니다.
텍스트는 다음과 같이 표시됩니다: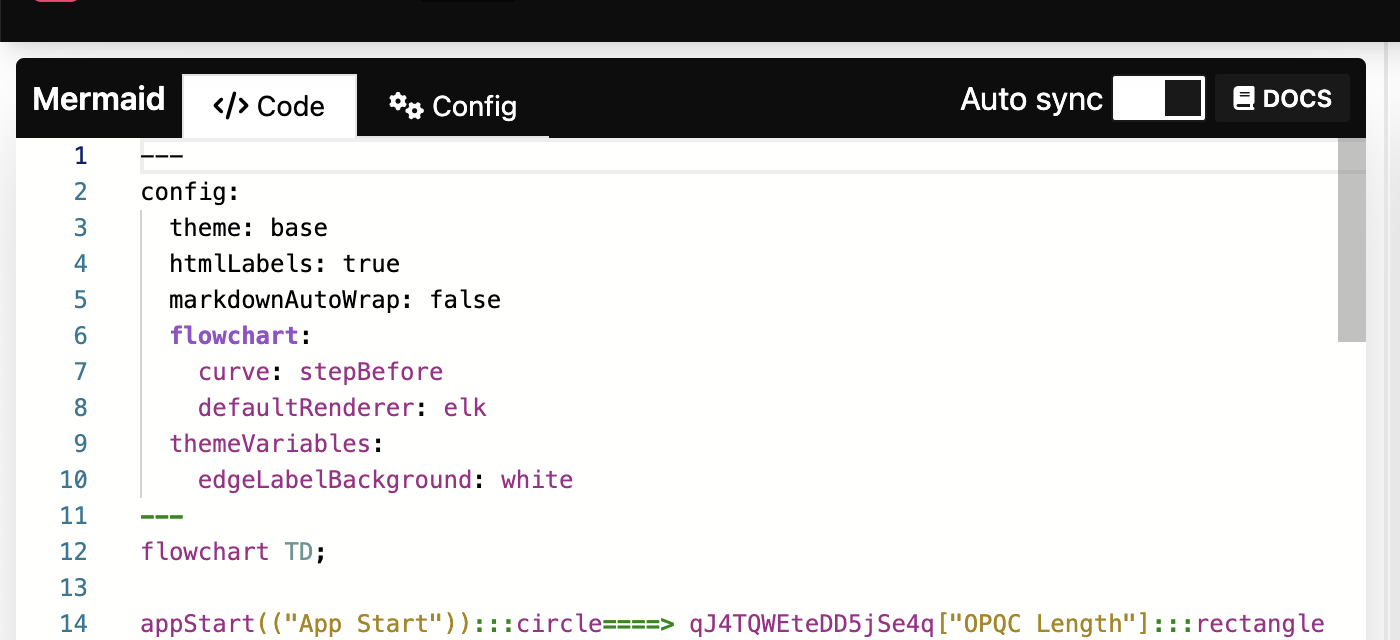 {높이="" 너비="540px"}
앱 다이어그램은 앱의 복잡도에 따라 달라집니다**.예:**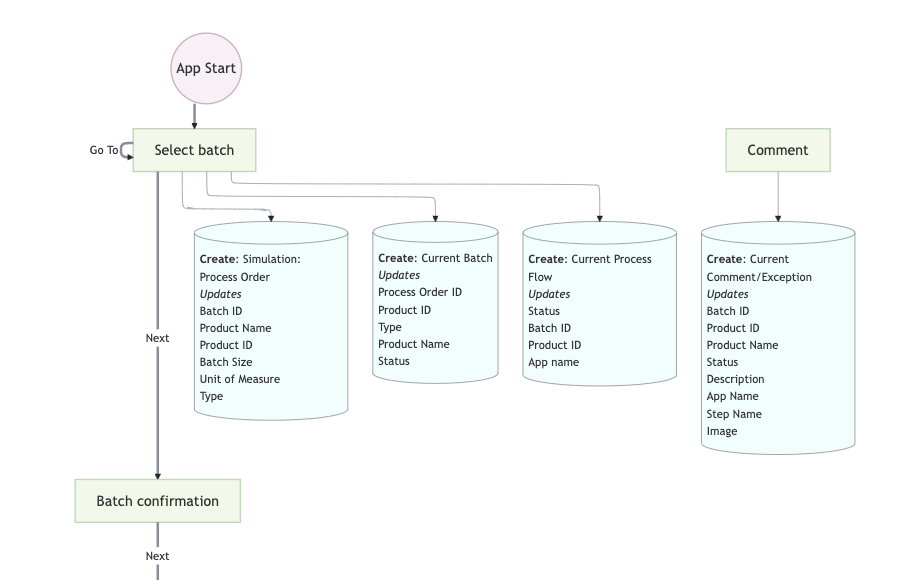
구문은 프로세스 흐름 다이어그램 언어와 유사해야 합니다* 보라색 원: 대상 앱과 단계가 채워진 '앱 시작' 또는 앱 완료* 녹색 상자: 상자 안에 단계 이름이 있는 앱의 단계* 실선: 단계 간 전환으로, 전환을 유발하는 트리거의 이름이 선에 포함되어 있습니다.* 파란색 데이터베이스 기호: 특정 단계의 특정 자리 표시자에 대한 모든 테이블 레코드 업데이트 또는 해당 단계에서 발생하는 커넥터 함수 호출입니다. 두 가지 모두에 사용되는 필드만 나열되며, 해당 필드에 매핑되는 값은 나열되지 않습니다.
다이어그램에서 특정 단계가 분리되어 있는 것을 발견할 수도 있습니다. 이러한 단계는 많은 전환이 이루어지는 단계이므로 다이어그램이 왜곡되고 많은 선이 그려지게 됩니다. 그래서 저희는 이러한 단계를 따로 분리하기로 결정했으며, 일반적으로 단계의 이름은 여러 곳에서 참조되는 '유틸리티 단계'임을 나타내는 좋은 표시입니다.
트리거 트리
트리거 트리는 앱에서 다음과 같은 중첩된 개념을 보여주는 JSON의 트리형 앱 보기입니다: * 단계 * 트리거 * 조건 * 트리거 작업
JSON을 읽을 수 있는 기술적 능력이 필요하지만 다음을 수행할 수 있습니다. * 앱의 모든 트리거를 한 곳에서 확인하여 앱을 더 쉽게 디버그* 앱 동작을 보기 위한 사용자 지정 내부 앱 구축* AI를 사용하여 앱의 기능을 더 잘 이해
트리거 트리 보기
- 트리거 트리를 선택한 다음 시각화하려는 모든 트리거 동작을 선택합니다.
- 내보내기를 클릭하면 JSON 파일이 표시됩니다.
- 파일에 있는 콘텐츠를 복사합니다.
JSONSea{target=_blank}와같은 JSON 뷰어에 콘텐츠를 붙여넣습니다.
트리거 트리는 로직이 얼마나 복잡한지에 따라 달라집니다. 예: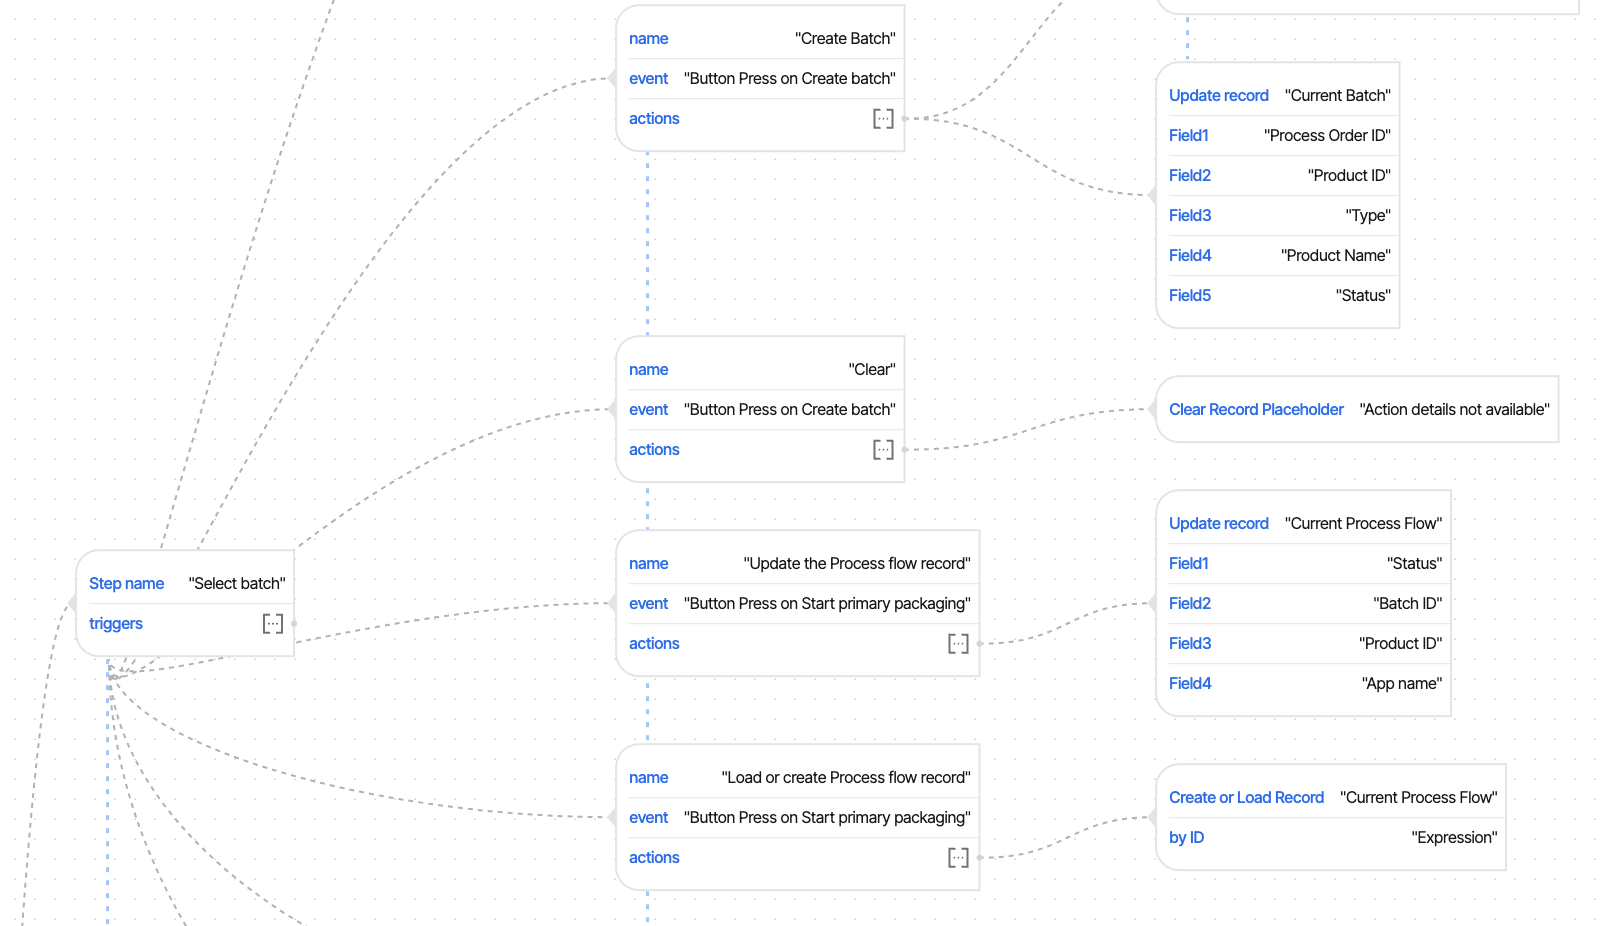 {높이="" 너비="540px"}