

This article discusses the Dashboard tab in Tulip and how to use interactive Shop Floor Dashboards.
Overview
You’ve already built a set of analyses that give you visibility into your operational KPIs in real time.
Now you want to build a dashboard to organize and communicate the information to the right people. These may be personal dashboards that help you keep track of your operation, or shop floor dashboards that show your team know how they are performing against their targets.
There are two ways people build dashboards in Tulip. The first is using the "Dashboards" tab within Tulip. The second is by building interactive dashboard apps using embedded analytics.
Dashboard tab
The Dashboard tab is designed to help you organize the analytics you’ve created in Tulip. Each dashboard consists of columns, which can be added or deleted to suit your needs.
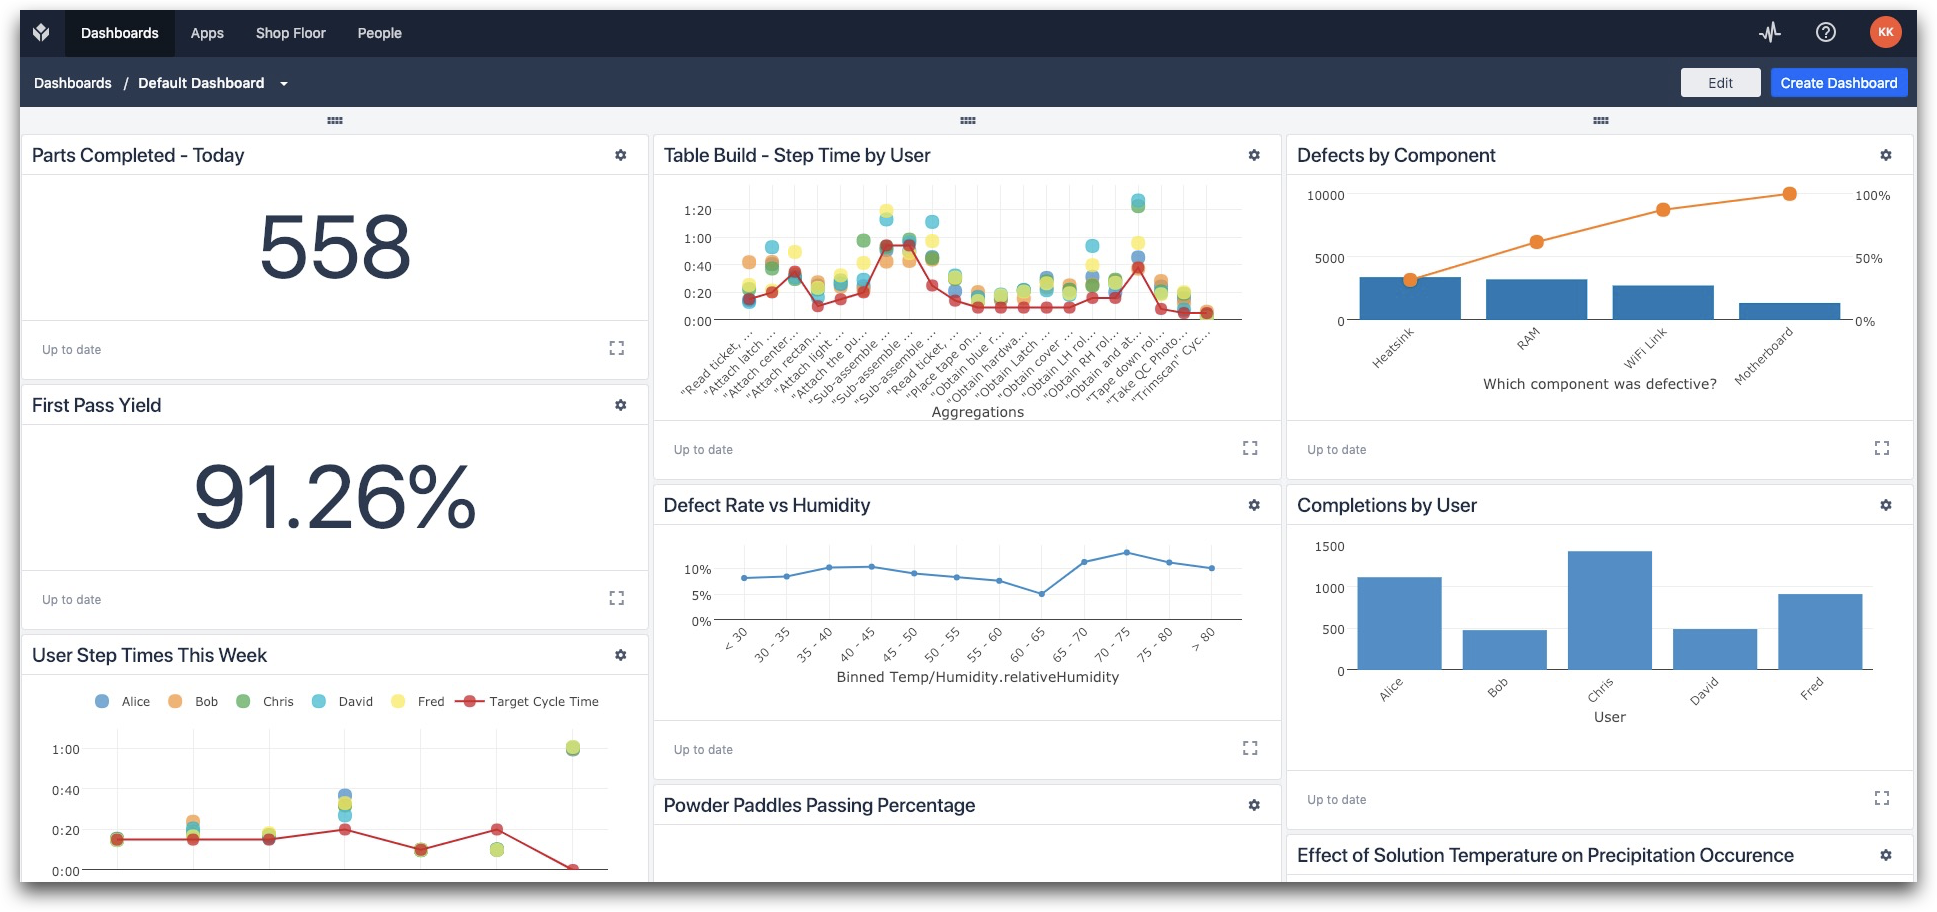
There is no limit to the number of dashboards you can create in Tulip. Generally, dashboards should be associated with a specific topic, e.g.
- Quality
- Production
- Line View for Supervisors or Process Engineers
- KPIs for Top Level Management
Build a new dashboard
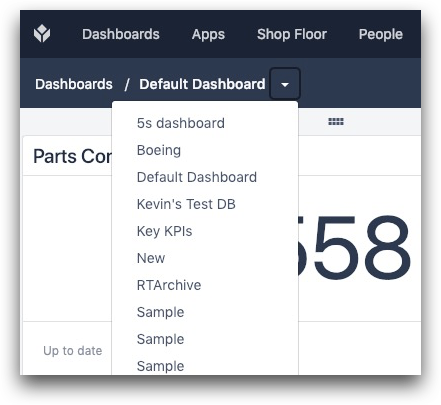
You can view all the available dashboards associated with your Tulip account by clicking the dropdown menu above the dashboard.
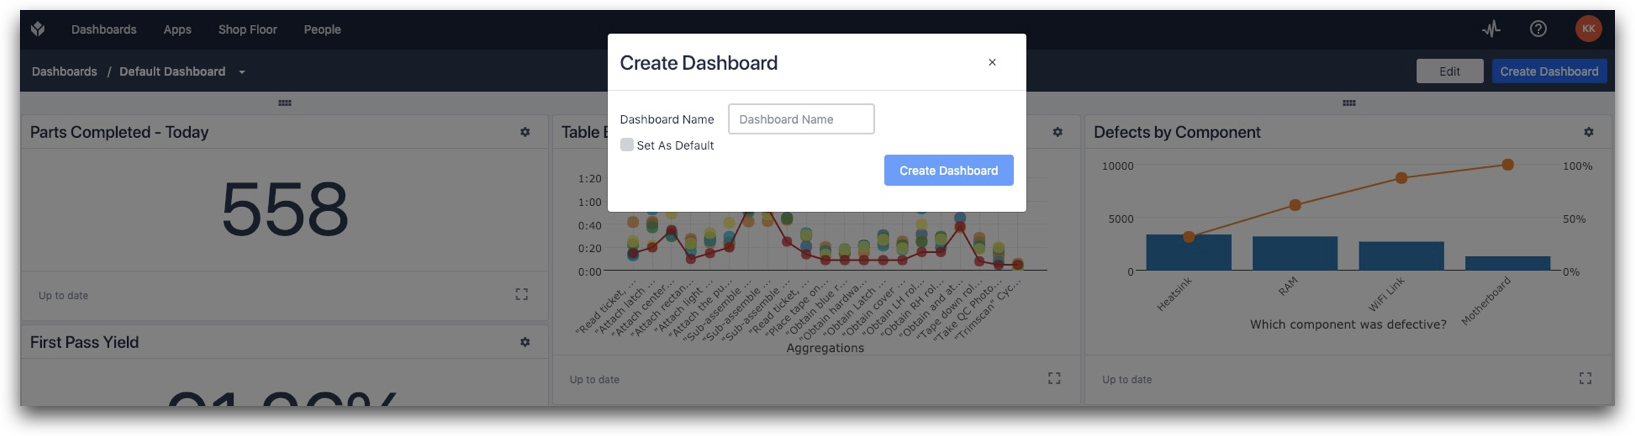
In the top right corner you will see a button “Create Dashboard”. This will let you create a new dashboard. It will also give you the option to set this dashboard as the default view when anyone from your company logs into your Tulip account.
You can reorder the analytics displayed on your dashboard by simply dragging and dropping them to the desired location.
You can always modify a dashboard view by selecting the “Edit” in the top right of the dashboard view. The edit button allows you to do the following things:
- Rename the dashboard
- Add an analysis a dashboard
- Add a column a dashboard
- Share a dashboard
- Delete a dashboard
After you create a dashboard you can share it in a view-only form with key members of your team. For more on how to do that, see “How to Share Analyses or Dashboards.”
Share a dashboard
If you want to share an entire dashboard, go to the dashboard you want to share, and click the three dot menu icon. Select Sharing.
Click Share to get a link that you can copy and share with your colleagues.
Note that sharing a dashboard also grants access to all of the analyses on it, whether or not they have been explicitly shared. Any analyses added to a shared dashboard will become accessible to anyone who has the link to that dashboard.
Create an interactive shop floor dashboard
Many process engineers build Dashboard Apps that are designed to give key information to the associates on the shop floor.
These dashboards are often designed to be interactive. Associates can see high level production and quality targets. Then, by clicking a button or by triggering a timer, they can dig deeper into a particular issue to understand the root cause.
The goal of these dashboards is to provide real-time feedback and to arm the shop floor with the insights they need to solve problems on the spot. An example of a shop floor dashboard is below.
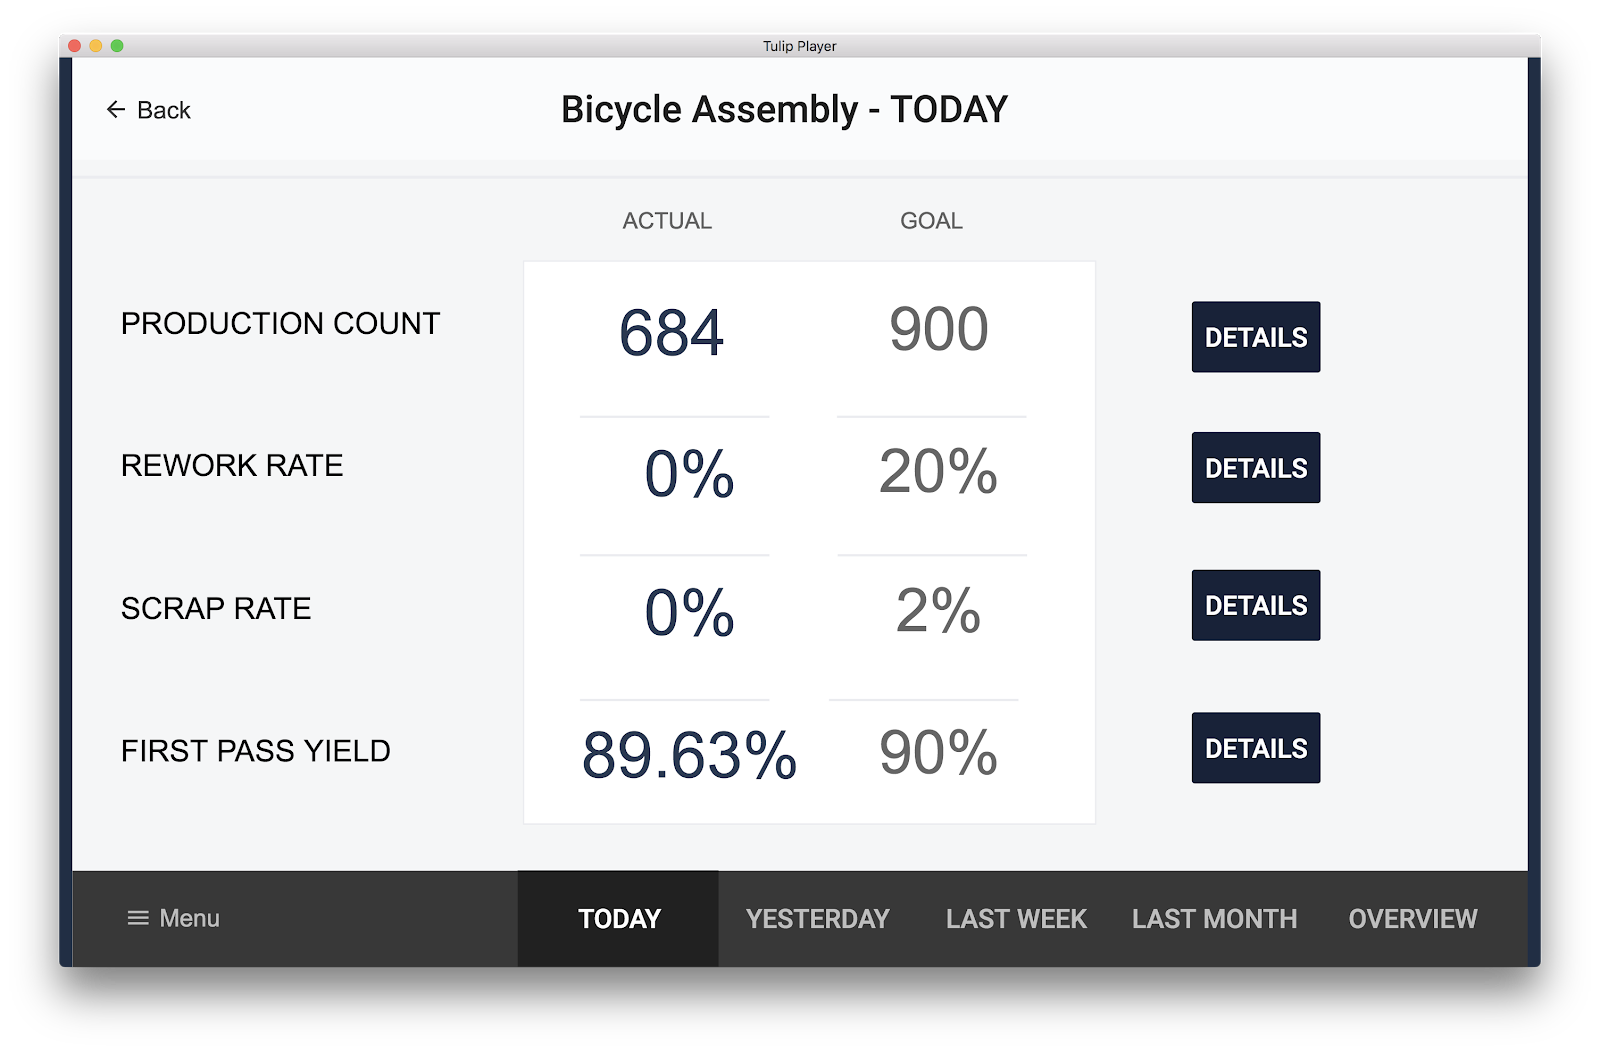
In this example, clicking the "DETAILS" button to the right of each KPI shows additional information about that particular KPI. In this example, shop floor associates can also see how this KPI has trended over time by clicking the different time frames along the bottom of the screen.
For more information on how to create interactive dashboard apps in Tulip see, “How to Embed Analytics in a Tulip App.”
Further reading
Did you find what you were looking for?
You can also head to community.tulip.co to post your question or see if others have faced a similar question!