With Tulip, transforming your operation through digital technology requires continuous improvement. This includes incremental changes and iterative development to suit your evolving needs.
What is continuous improvement?
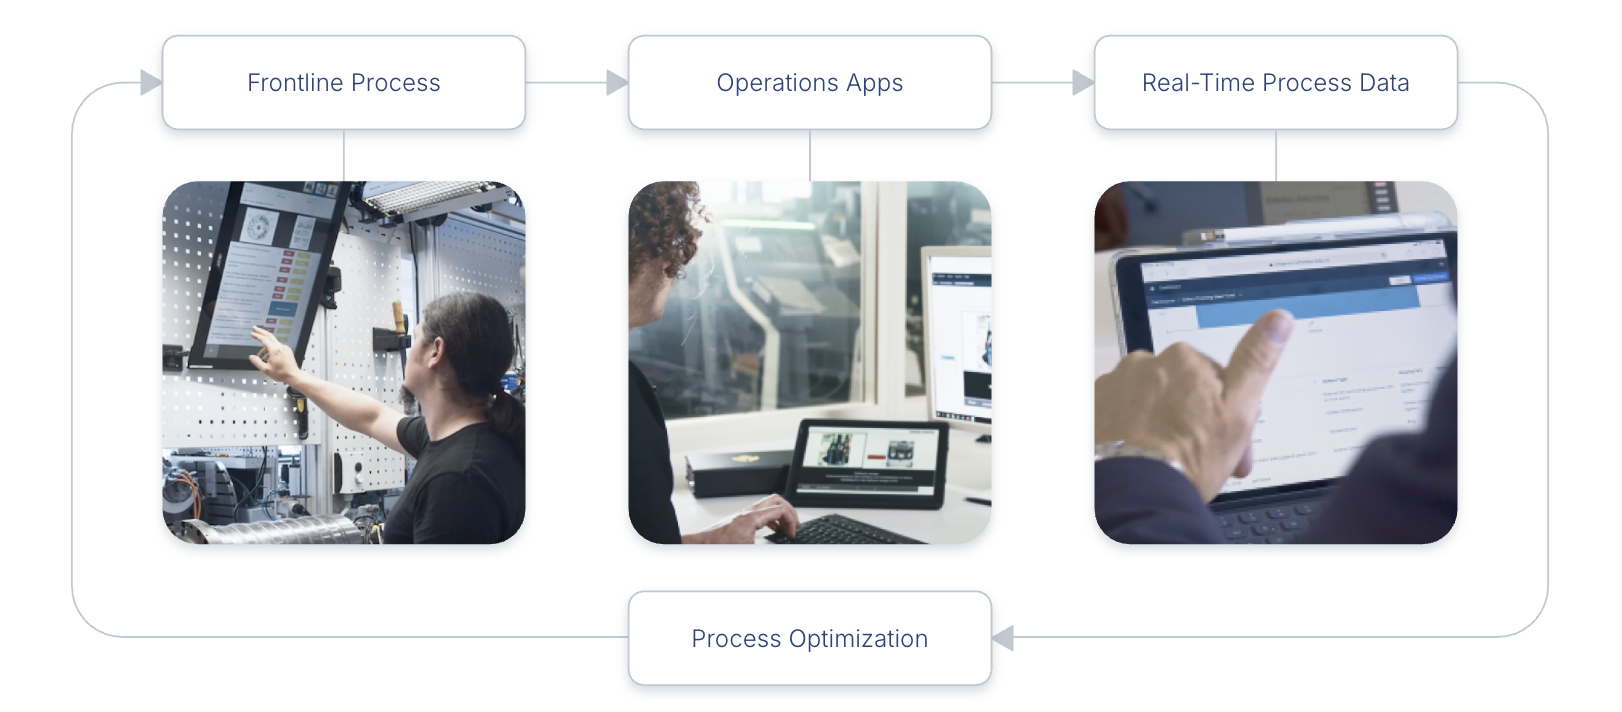
Continuous improvement workflow is an agile method.
Agile is an approach to the development lifecycle that prioritizes creating value through a process of continuous release and iteration. Rather than one large release, it focuses on reaching a goal through many small improvements.
Continuous improvement ensures quick delivery of minimum valuable solutions by gathering data, reviewing real-time process insights, and iterating your apps or processes accordingly.
Gather insights with Analytics
Tulip’s Analytics feature visualizes data with no-code charting and advanced machine learning features
The analyses you build can expose problems in your operation and show real-time performance against your KPIs.
Analyses can use the following data sources in Tulip:
- App completions
- Table data
- Machine data
Here are a few examples of value gain from analyses:
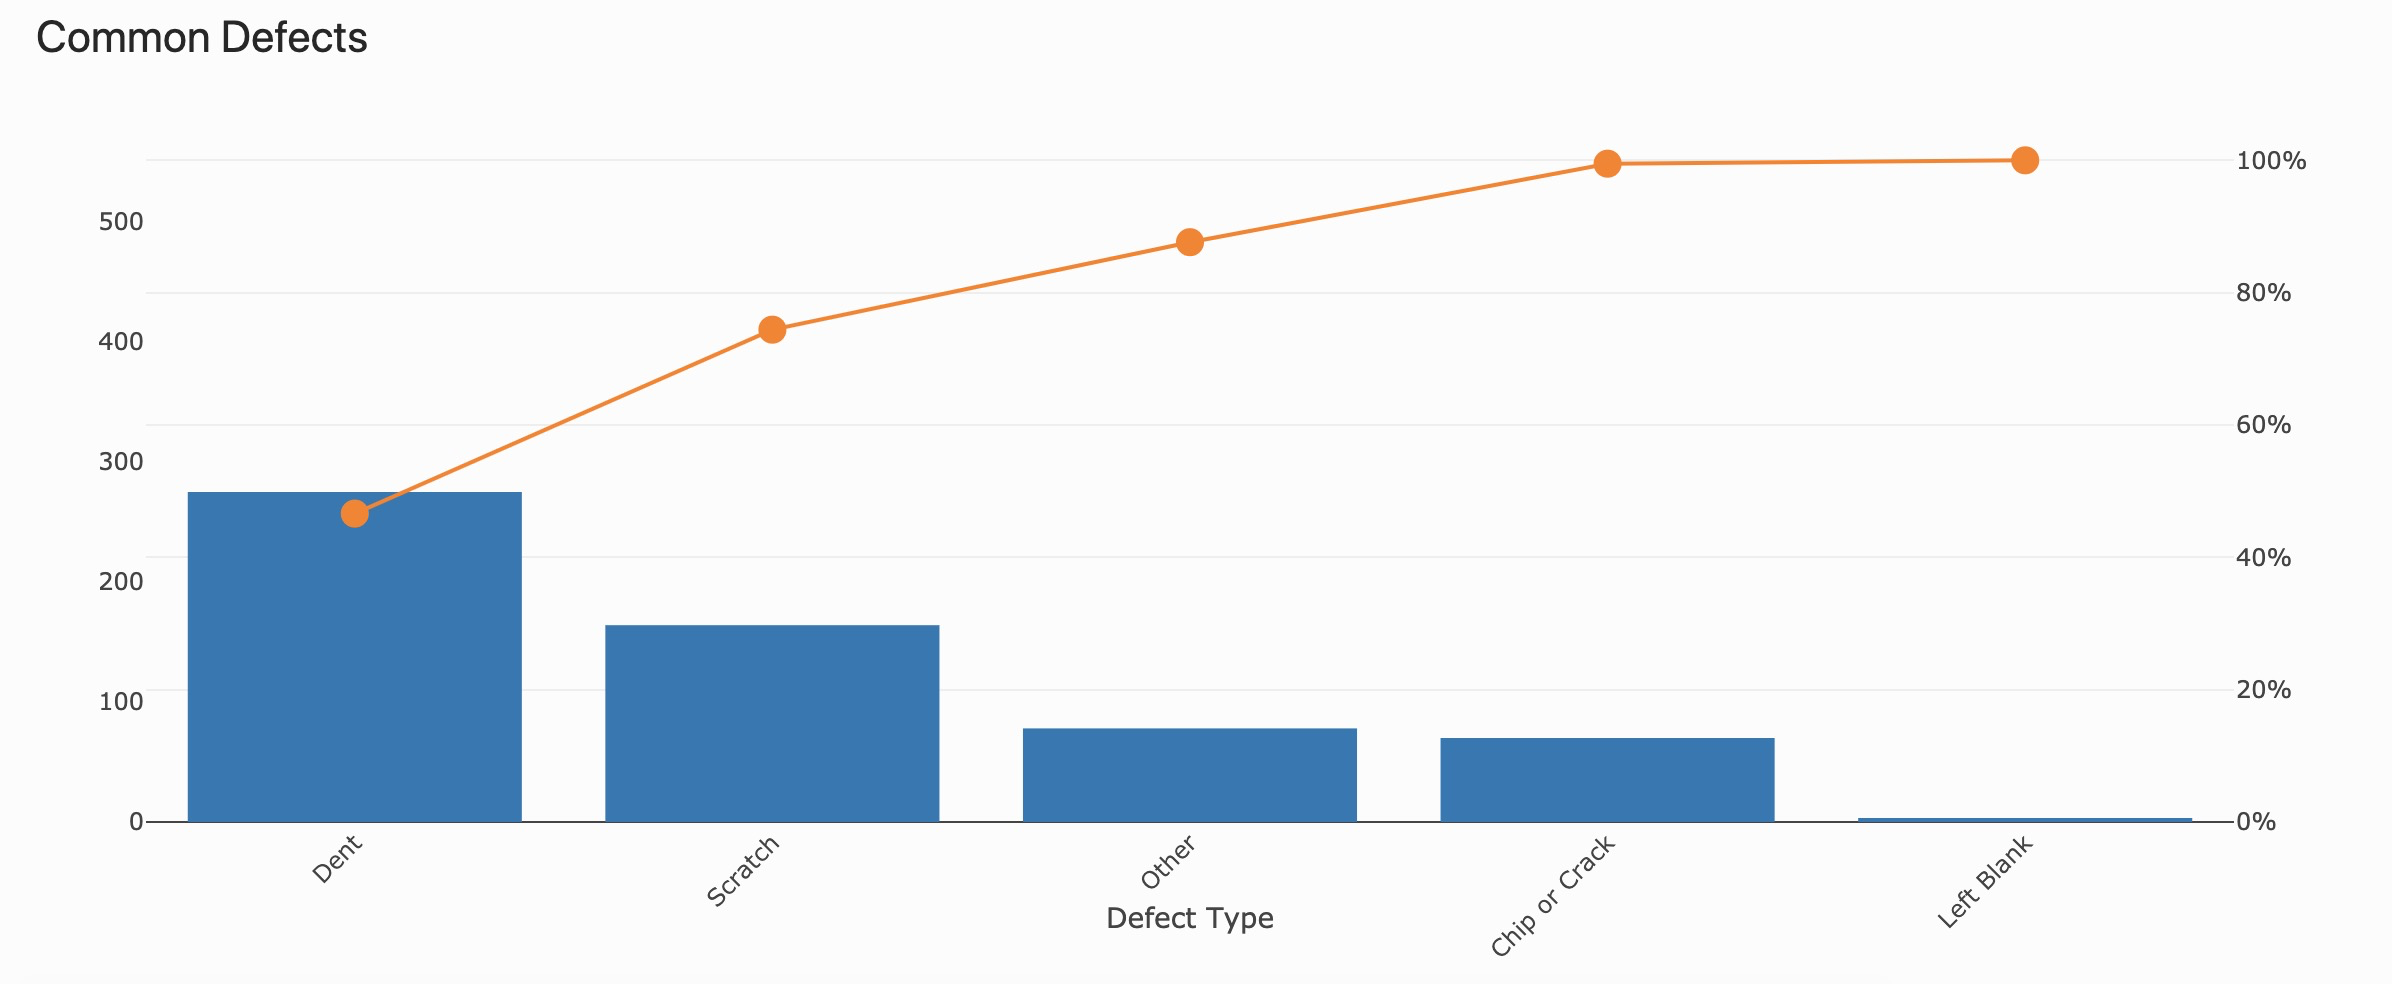
Pareto chart that shows defect rates
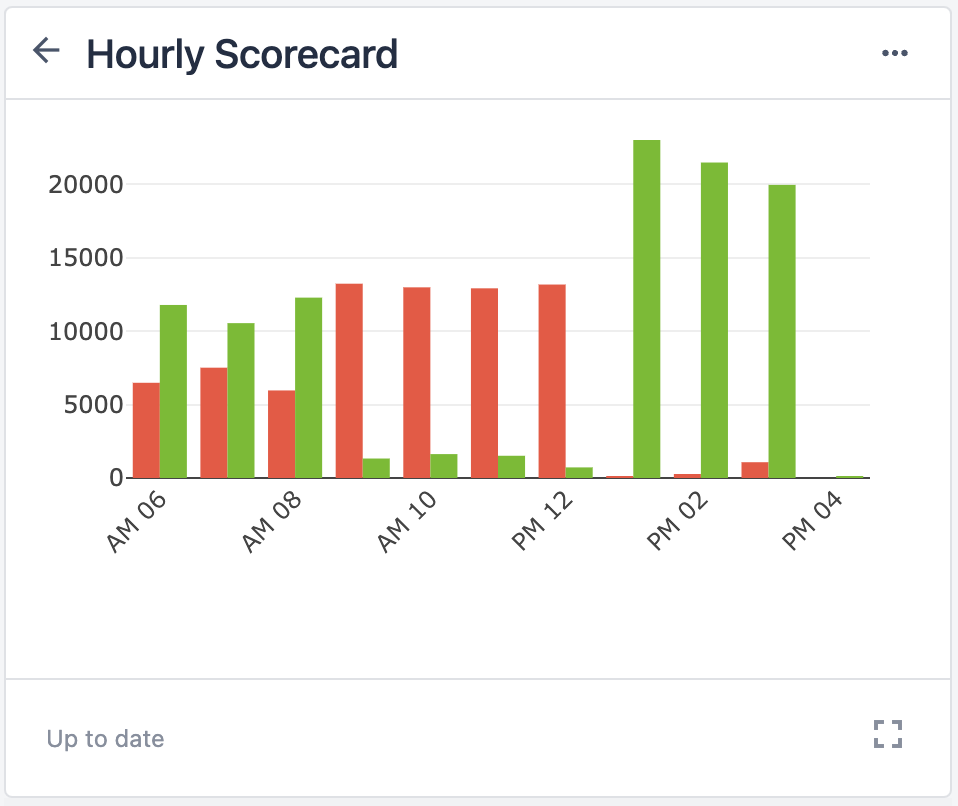
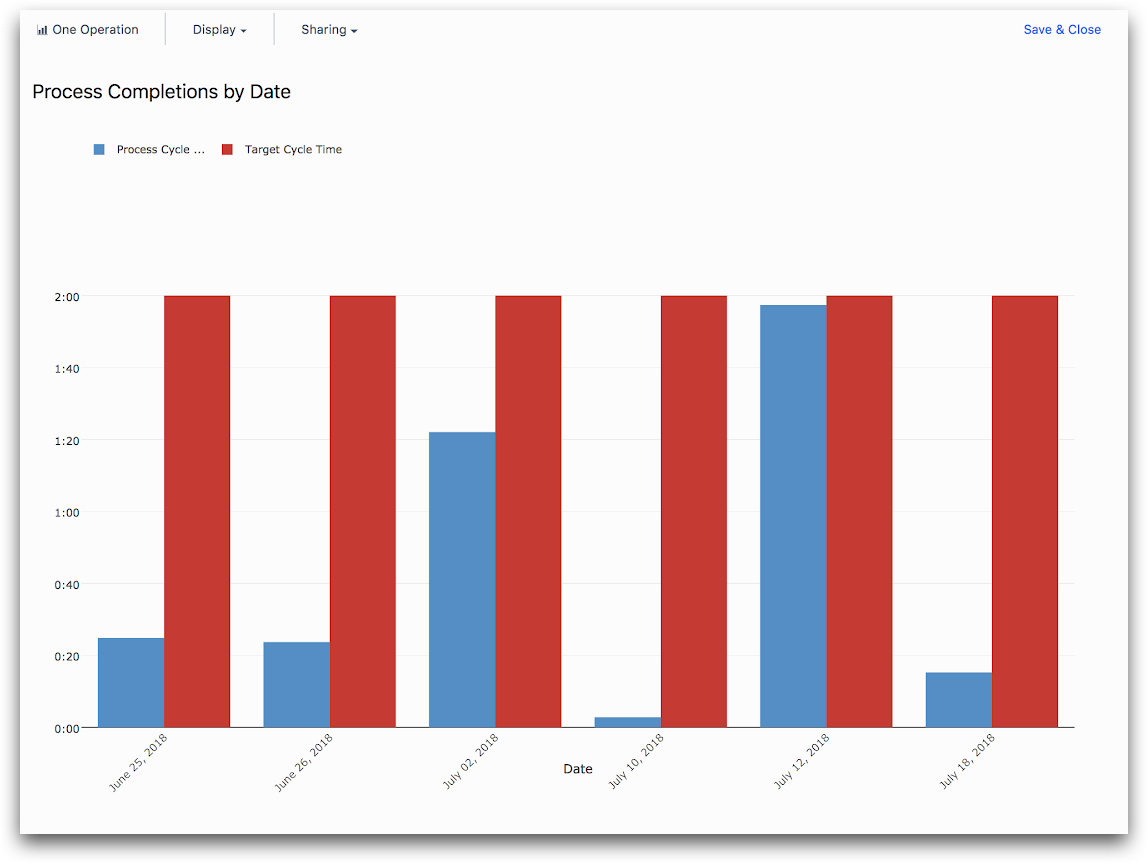
Bar chart of cycle times
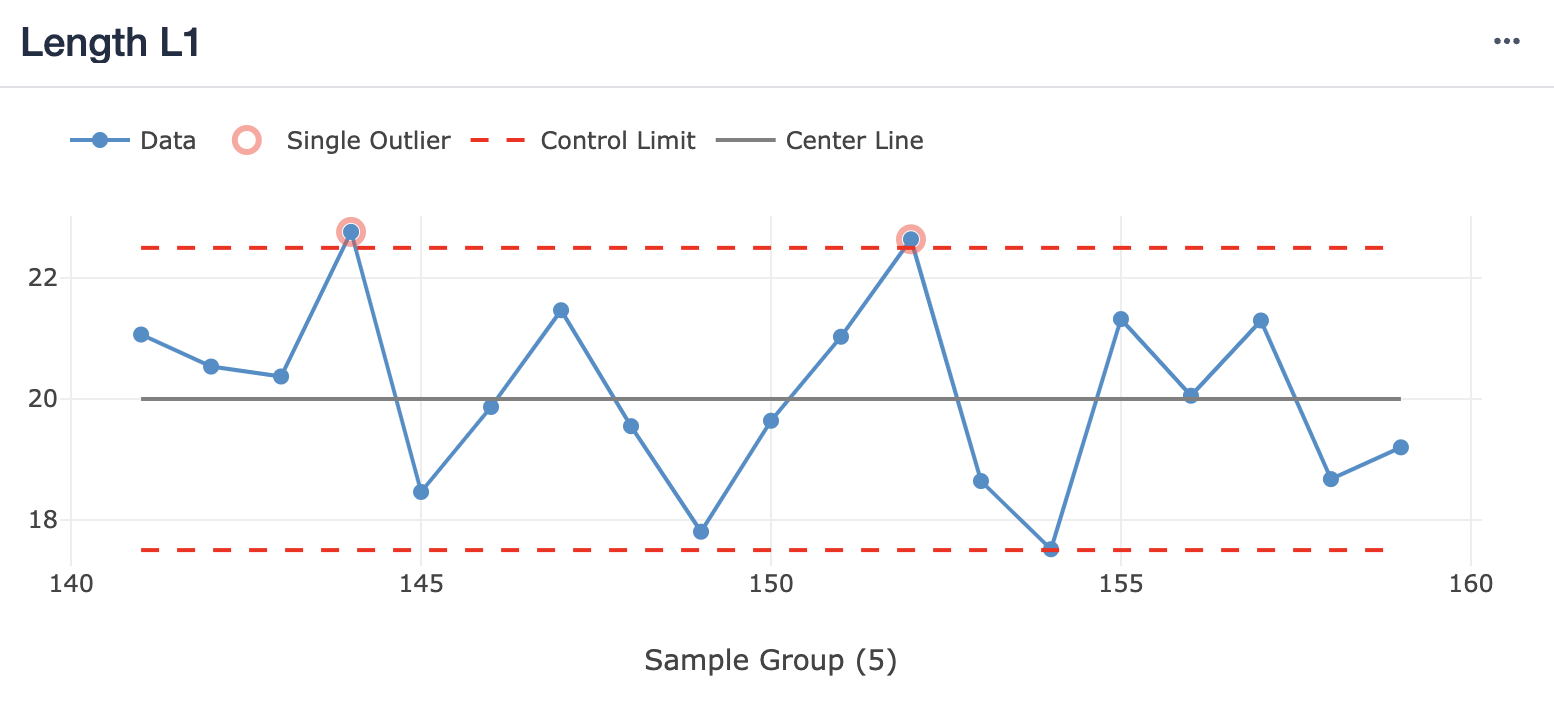
You can improve operations immediately with control chart layers. Control charts enable you to:
- Set upper and lower control limits
- Use machine learning for statistical process control
- Send notifications when outliers appear in your data
Learn more about Analytics here.
Now, let’s run through an example of continuous improvement for a 12-month scale with Tulip.
Example use-case: Addressing quality escapes
Scenario: Quality escapes are reaching customers, but you’re unsure from where they are originating. You’re expecting demand to increase next year, so you are spending this year focused on building infrastructure and driving initiatives to increase throughput.
Business goal: Enable scale-up within 12 months and build customer confidence around your quality program.
KPIs: First pass yield; quality escapes; rework time
Manufacturing goals:
-
Identify root causes of quality issues
-
Implement tools for in-line prevention of quality issues (poka-yoke)
-
Traceability & genealogy to act quickly in case of any issues
-
Programmatically improve quality via better training initiatives
-
Create a “last line of defense” to ensure to quality escapes leave the building
Sprint 1: Start gathering frontline data by implementing a simple pass/fail check at each inspection station.
-
Learn basic app building skills
-
Learn how to deploy new apps
-
Get data fast
-
Drive change management: Operators start learning & using Tulip early
Sprint 2: Lay the foundation for analysis of frontline data. When parts fail, have Operators input a failure reason from a list.
-
Build app building skills
-
Learn how to deploy new versions of apps
-
Get data fast: quickest possible route to understanding what inspection steps lead to the most issues
-
Identify pain points: Are your failure codes sufficient? Are your apps easy-to-use?
→ Identify root causes of quality issues
Sprint 3: Build a dashboard app showing which stations have the most failures.
-
Learn new app building skills
-
Drive continuous improvement: focus your resources on decreasing failures at the stations with the most failures
-
Drive change management: show the value of digital solutions to quickly drive impactful change (within 6 weeks)
Sprint 4: Enhance your dashboard app. Starting with the stations with the most failures, show which failure types are most common.
-
Drive continuous improvement: focus your resources on fixing the biggest problems
-
Show ROI: How quickly can you decrease the number of failures by each type? What impact does that have on scrap & labor costs?
Sprint 5: Build work instruction apps to provide clear guidance to Operators in the identified problem areas.
-
Prioritize pain points
-
Build for scale: Create a template that can be reused across parts and product lines
→ Implement tools & poka-yoke for in-line prevention of quality issues
Sprint 6: Use work instructions to capture data. Do not allow parts to proceed down the line if they are out of spec.
-
Implement poka-yoke
-
Build initial traceability: capture cycle times, Operators, specs, and pass/fail data
→ Traceability & genealogy to act quickly in case of any issues
Sprint 7: Refresh your quality apps as needed. Update your dashboards to show improvements over time.
-
Learn app architecture: Understand how an ecosystem of apps works together.
-
Design & iterate for usability.
Sprint 8: Set the groundwork for the next phase of your quality program.
-
Show ROI: Digital initiatives are driving KPI improvements
-
Continue developing prioritized work instructions
-
Restrict app access by Station to operators trained in the specific process
→ Programmatically improve quality via better training initiatives
Sprint 9: Set up long-term program to track ROI. Finalize traceability.
-
Show ROI: Translate KPI improvements into dollars, units, and/or hours
-
Understand completion records
Sprint 10: Design a training program.
Sprint 11: Continuously improve your apps, while building out the ecosystem.
→ Create a “last line of defense” to ensure to quality escapes leave the building
Next Steps
Identify your business objectives and start tackling what matters most to you with resources from Tulip experts:
- Agile development University course
- Pick your first use case University course
- Dashboard development University course
Did you find what you were looking for?
You can head over to community.tulip.co to post your question or see if others have faced a similar question!