

Machine data ingestion limits
Tulip enforces rate limits to ensure platform stability:
| Protocol | Rate limit per attribute | Polling interval | Notes |
|---|---|---|---|
| MQTT | 1 Hz (1 message/sec) | N/A (event-driven) | Events report immediately when published to broker |
| OPC UA | 1 Hz (1 tag/sec) | Tags poll every 1 second | Tulip polls tags every 1 second |
| Machine Attribute API | No per-attribute limit | N/A | Limited by OPCH-wide 500 Hz cap |
| Instance Total | 500 Hz per On-Premise Connector Host | N/A | Sum of all machine attributes across all protocols |
Example calculations
Scenario 1: 50 machines, each with 5 attributes (MQTT)
- 50 machines × 5 attributes = 250 attributes
- 250 attributes × 1 Hz = 250 Hz (under 500 Hz limit)
Scenario 2: 100 machines, each with 10 attributes (OPC UA)
- 100 machines × 10 attributes = 1000 attributes
- 1000 attributes × 1 Hz = 1000 Hz (exceeds 500 Hz limit)
- Solution Options:
- Reduce to 5 critical attributes per machine
- Use an external data ops platform (e.g. to downsample to 500 Hz total)
- Balance the Machine monitoring load: add another OPCH and Data Source.
Scenario 3: High-frequency machine (100 Hz data output)
- 1 machine outputting at 100 Hz exceeds the per-attribute 1 Hz limit
- Solution: Use a data ops platform (e.g., Litmus, HighByte) with a time-series database OR use an edge device to buffer and downsample to 1 Hz
Optimization strategies
1. Attribute pruning
Problem: OPC UA servers often expose hundreds of tags per machine. Mapping all tags exceeds rate limits and creates noise.
Solution: Map only attributes that drive business decisions.
Do map
- State indicators (running, stopped)
- Part counters
- Alarms that trigger notifications
- Quality metrics (temperature, pressure)
Don't map
- Diagnostic codes not used in Tulip
- Low-level PLC registers
- Attributes that never change
2. Machine type standardization
Problem: Every machine has unique attributes, leading to complex maintenance.
Solution: Create standardized machine types with common attributes, even if not all machines use all attributes.
Example
Attributes:
- Machine current (used for state detection)
- Spindle speed (tracked for all)
- Part count (tracked for all)
- Tool number (optional, not all machines support)
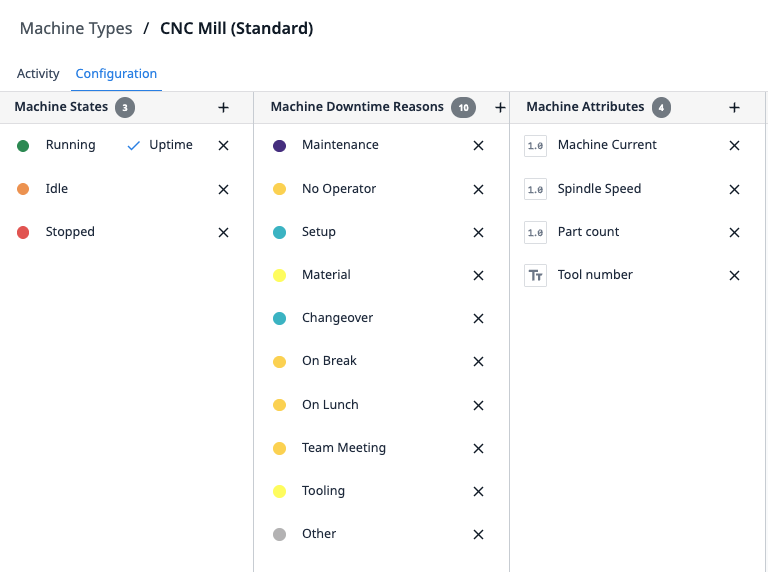
This approach allows you to reuse machine triggers and scale horizontally without recreating logic.
3. Trigger consolidation
Problem: Multiple machine triggers on the same attribute create redundant executions.
Solution: Consolidate logic into fewer triggers with multiple actions.
Don't do the following:
- Trigger 1: When machine current > 10 → Set state to Running
- Trigger 2: When machine current > 10 → Increment run counter
- Trigger 3: When machine current > 10 → Log timestamp
Best practice
- Trigger 1: When machine current > 10
- → Set state to Running
- → Increment run counter
- → Log timestamp
4. Copy machine triggers across types
You can copy and paste machine triggers from one machine type to another.
Copy machine triggers:
- Go to the source machine type and select the Triggers tab.
- Click the Copy icon next to the trigger.
- Go to the target machine type and select the Triggers tab.
- Paste the trigger.
This approach improves scalability when you deploy similar machine types.
Scale beyond 100 machines
When you exceed ~100 machines with complex logic, consider these approaches:
Approach 1: Tiered monitoring
- Tier 1 (critical machines): Full monitoring with Tulip (10-20 machines)
- Tier 2 (standard machines): Basic OEE only with machine triggers (50-80 machines)
- Tier 3 (low priority): Manual logging via apps (20+ machines)
Approach 2: External DataOps platform
- Aggregate all machine data in a DataOps platform (e.g., Litmus, HighByte).
- Use the data ops platform for high-frequency data capture, high-frequency monitoring workflows, and time-series storage.
- Push summarized data to Tulip tables via API for operator workflows.
- Reserve Tulip machine monitoring for human-interactive machines.
Approach 3: Hybrid EdgeIO and cloud
- Deploy edge devices (e.g., Node-RED on EdgeIO) for high-frequency local buffering.
- Downsample data at the edge (100 Hz → 1 Hz average).
- Send downsampled data to Tulip via the machine attributes API.
- Store raw high-frequency data locally or in a separate time-series database.
Further reading
- Platform limits and best practices
- Machines' ingestion limits
- Best practices for high performance apps
API documentation
- Use the machine attributes API - Write machine attribute values
- Table API guide - Read and write Tulip Tables
Did you find what you were looking for?
You can also head to community.tulip.co to post your question or see if others have solved a similar topic!