A common decision in machine monitoring is when to use Tulip tables instead of the machine activity table.
In this article, you will learn:
- When to use Tulip tables
- When to use the machine activity table
- The strengths and limitations of each
Machine activity table: Built-in OEE tracking
A system table that machine triggers automatically populate and that logs:
- State (Running, Stopped, Offline)
- Start time, end time, and duration
- Downtime reason
- Part count and defect count
- Ideal run rate
- Custom activity fields (user-defined)
Strengths
- Minimal configuration - automatically associated with Tulip machines
- Optimized for OEE calculations (Availability, Performance, Quality)
- Works seamlessly with machine triggers (headless)
- Analytics can directly query machine activity data
Limitations
- No Tulip Table API access - you cannot programmatically read or write to the Machine Activity table via API
- No table record ID - difficult to link to other tables
- Export only via CSV archive (not real-time integration)
Use machine activity table for OEE only
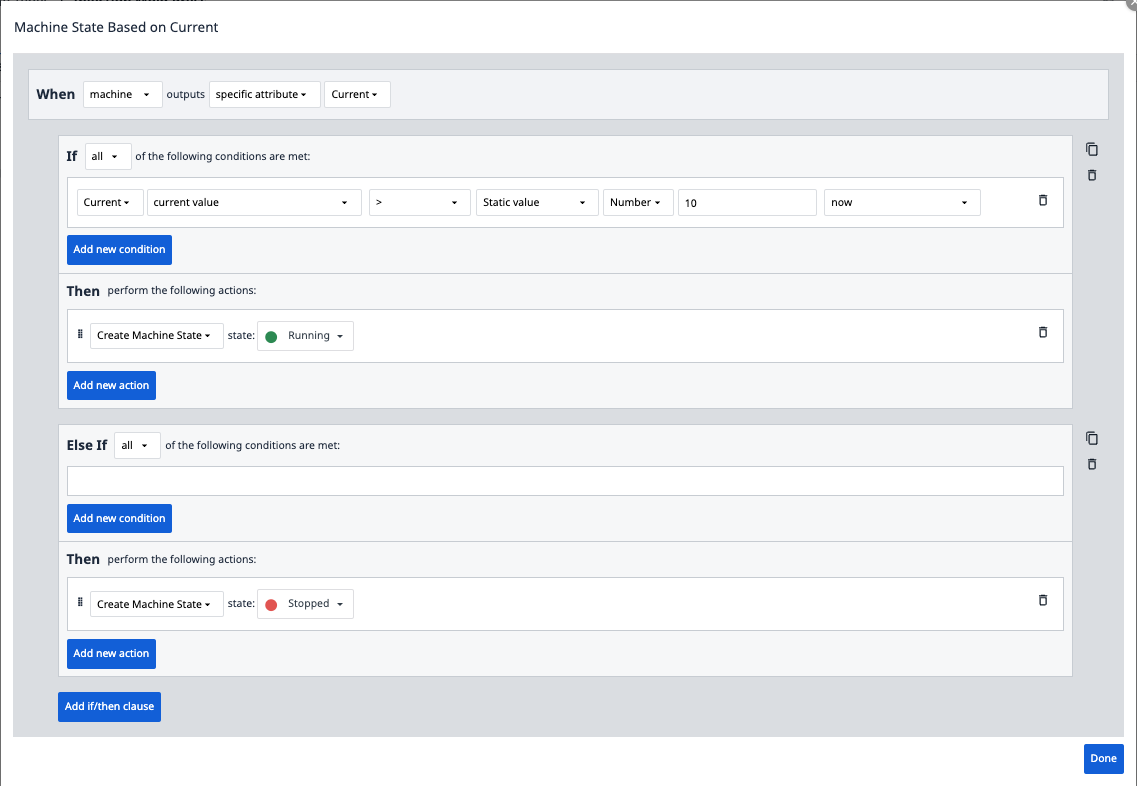
If your only goal is to track machine uptime and downtime and calculate OEE, use machine triggers with the Machine Activity Table. This is the simplest, most cost-effective solution.
Example

Tulip tables: Flexible data model for complex use cases
When to use Tulip Tables
- You need custom data fields not available in Machine Activity Table (for example, Work Order ID, Operator Badge, SKU)
- You need CRUD operations (Create, Read, Update, Delete) via APIs
- You integrate machine data with other business processes (quality, inventory, maintenance)
- You want to contextualize machine data with work orders, batches, or production schedules
Use both machine activity table and Tulip tables
Machine Activity Table (via machine triggers):
- Capture raw state changes
- Calculate OEE metrics
Tulip Table (via automations or app triggers):
- Enrich machine data with business context
- Enable API-based integrations
- Link to work orders, quality records, and other data
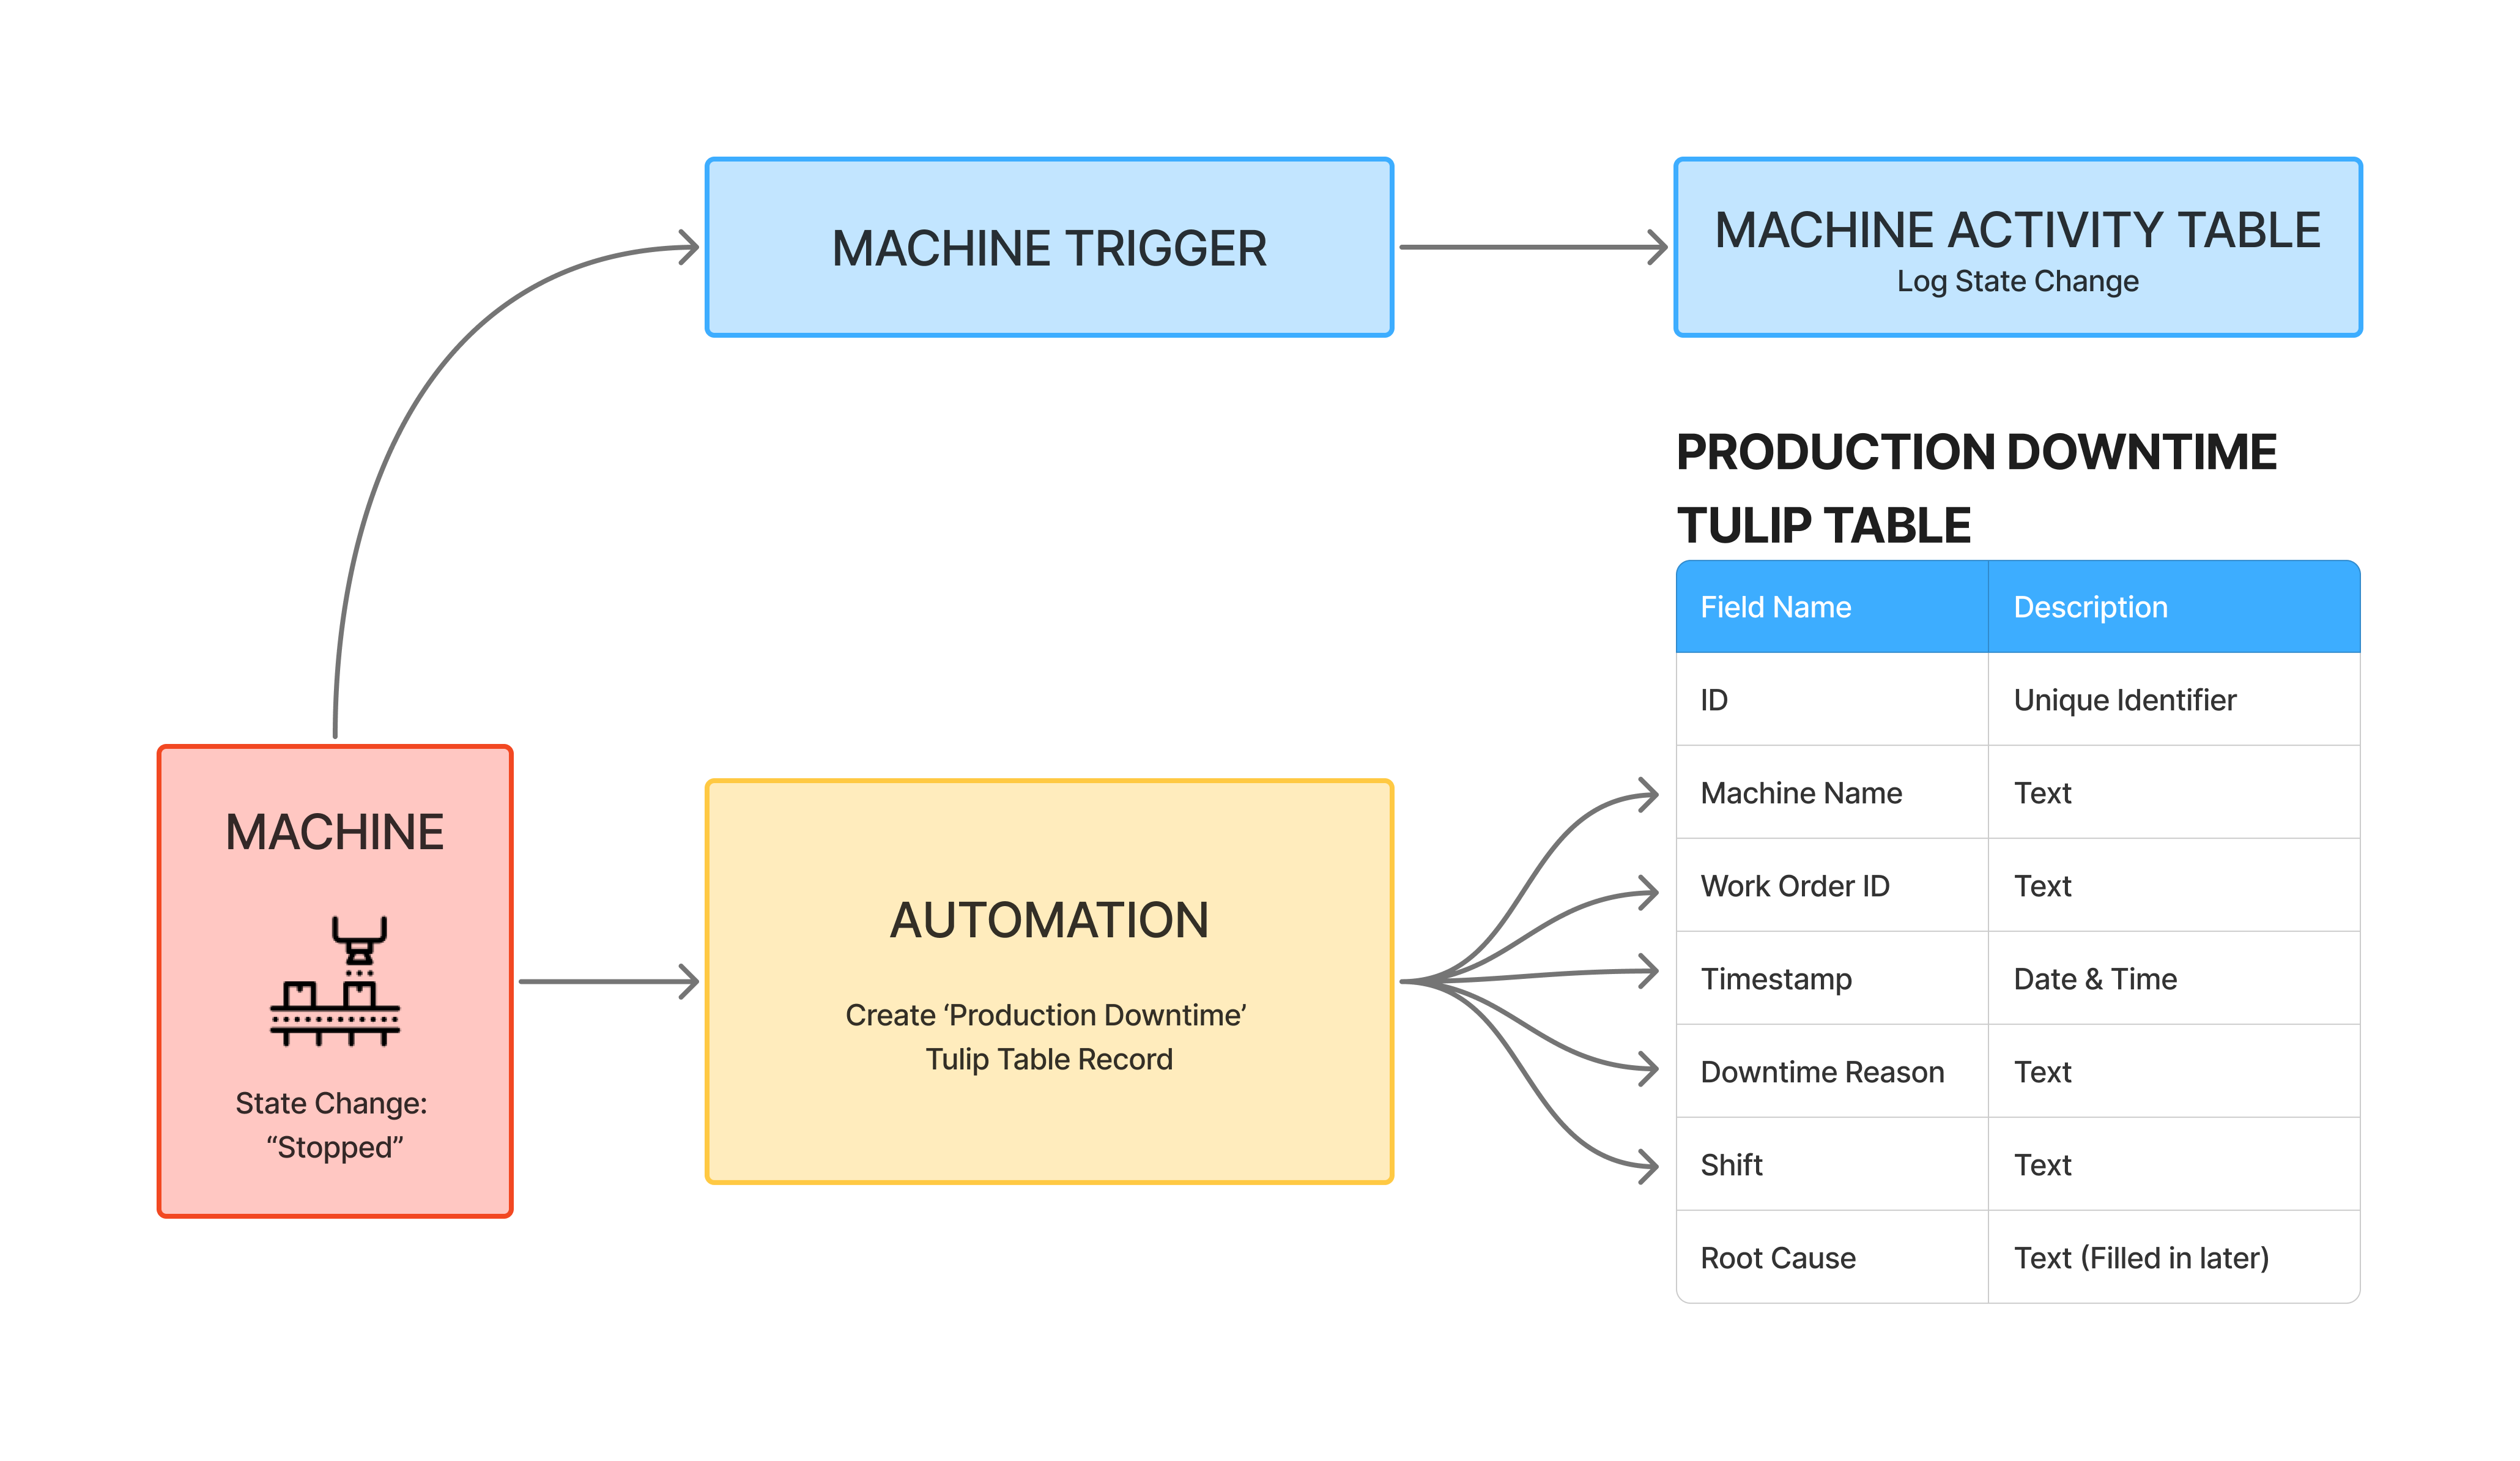
Example architecture
Note: 'Automation' refers to Tulip Automations.

This hybrid model provides:
- OEE dashboards from Machine Activity Table
- Root cause analysis from Tulip Table with API access for external BI tools
Handle manual data with rework and scrap patterns
Challenge: Machines automatically report part counts, but human context (rework, scrap, manual adjustments) requires manual input. How do you reconcile automated machine counts with manual corrections?
Avoid corrupting machine data
Do not attempt to decrement machine part count when an operator logs rework.
Why this fails: The machine does not understand human context. If you write back to the machine, you corrupt the raw data source.
Separate truth sources
- Let the machine report raw counts.
- Use a separate table for manual adjustments.
- Calculate net production via expressions.
Example data model
Machine Activity Table (automatic):
- Part Count: 104 (raw machine output)
- Defects: 0 (machine does not track)
Production Log Table (Tulip Table, via app):
- ID: 12345
- Work Order: WO-5678
- Machine ID: CNC-001
- Gross Parts: 104 (copied from machine at run end)
- Rework Count: 4 (operator input)
- Scrap Count: 0
- Net Parts: 100 (calculated: Gross - Rework - Scrap)
- Timestamp
App workflow:
- Operator starts a run and selects a work order
- Machine runs and increments part count automatically
- Operator notices 4 parts need rework and passes them back through
- Machine increments to 104 (the machine counts 104 parts)
- Operator ends the run, and the app creates a Production Log record
- App copies machine part count (104) to the Gross Parts field
- Operator manually enters Rework Count: 4
- App calculates Net Parts = 104 - 4 = 100
Analytics:
- Machine OEE: Uses raw part count (104) for performance calculation
- Production Reports: Uses Net Parts (100) for actual output
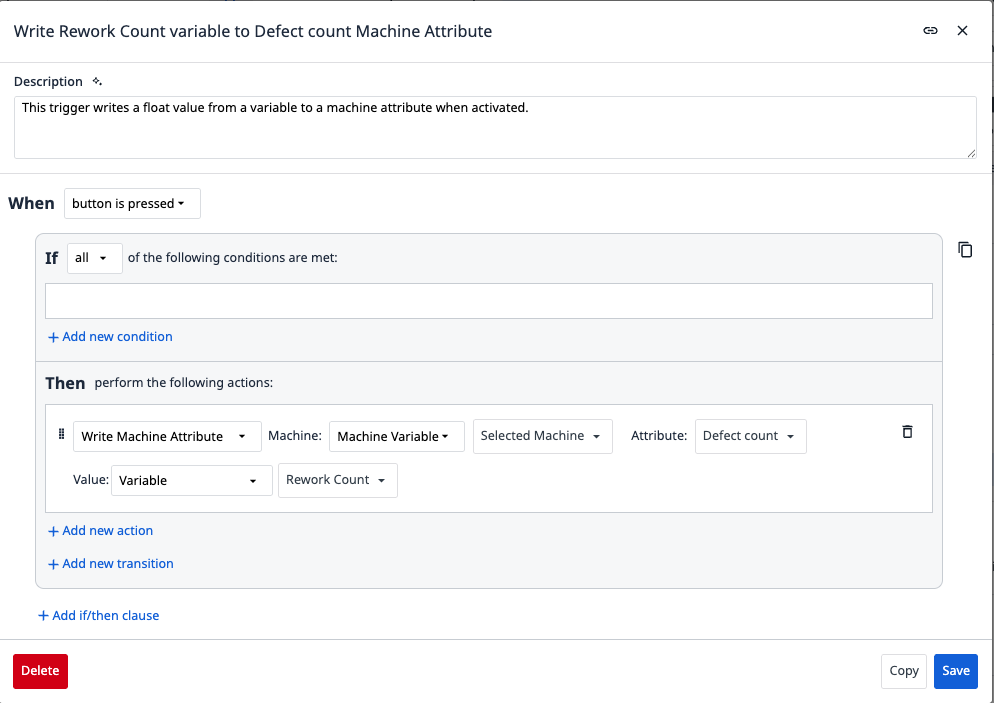
Optional enhancement: Log defects to a Machine Activity Field for OEE Quality calculation:

This allows OEE Quality % to reflect the actual defect rate while preserving raw machine counts.
Further reading
Did you find what you were looking for?
You can also head to community.tulip.co to post your question or see if others have solved a similar topic!

