Learn how to create a table analysis in Tulip to count completed lots for each oven over the last 30 days. This guide will walk you through setting up the necessary groupings and filters to gain valuable insights into your production data.
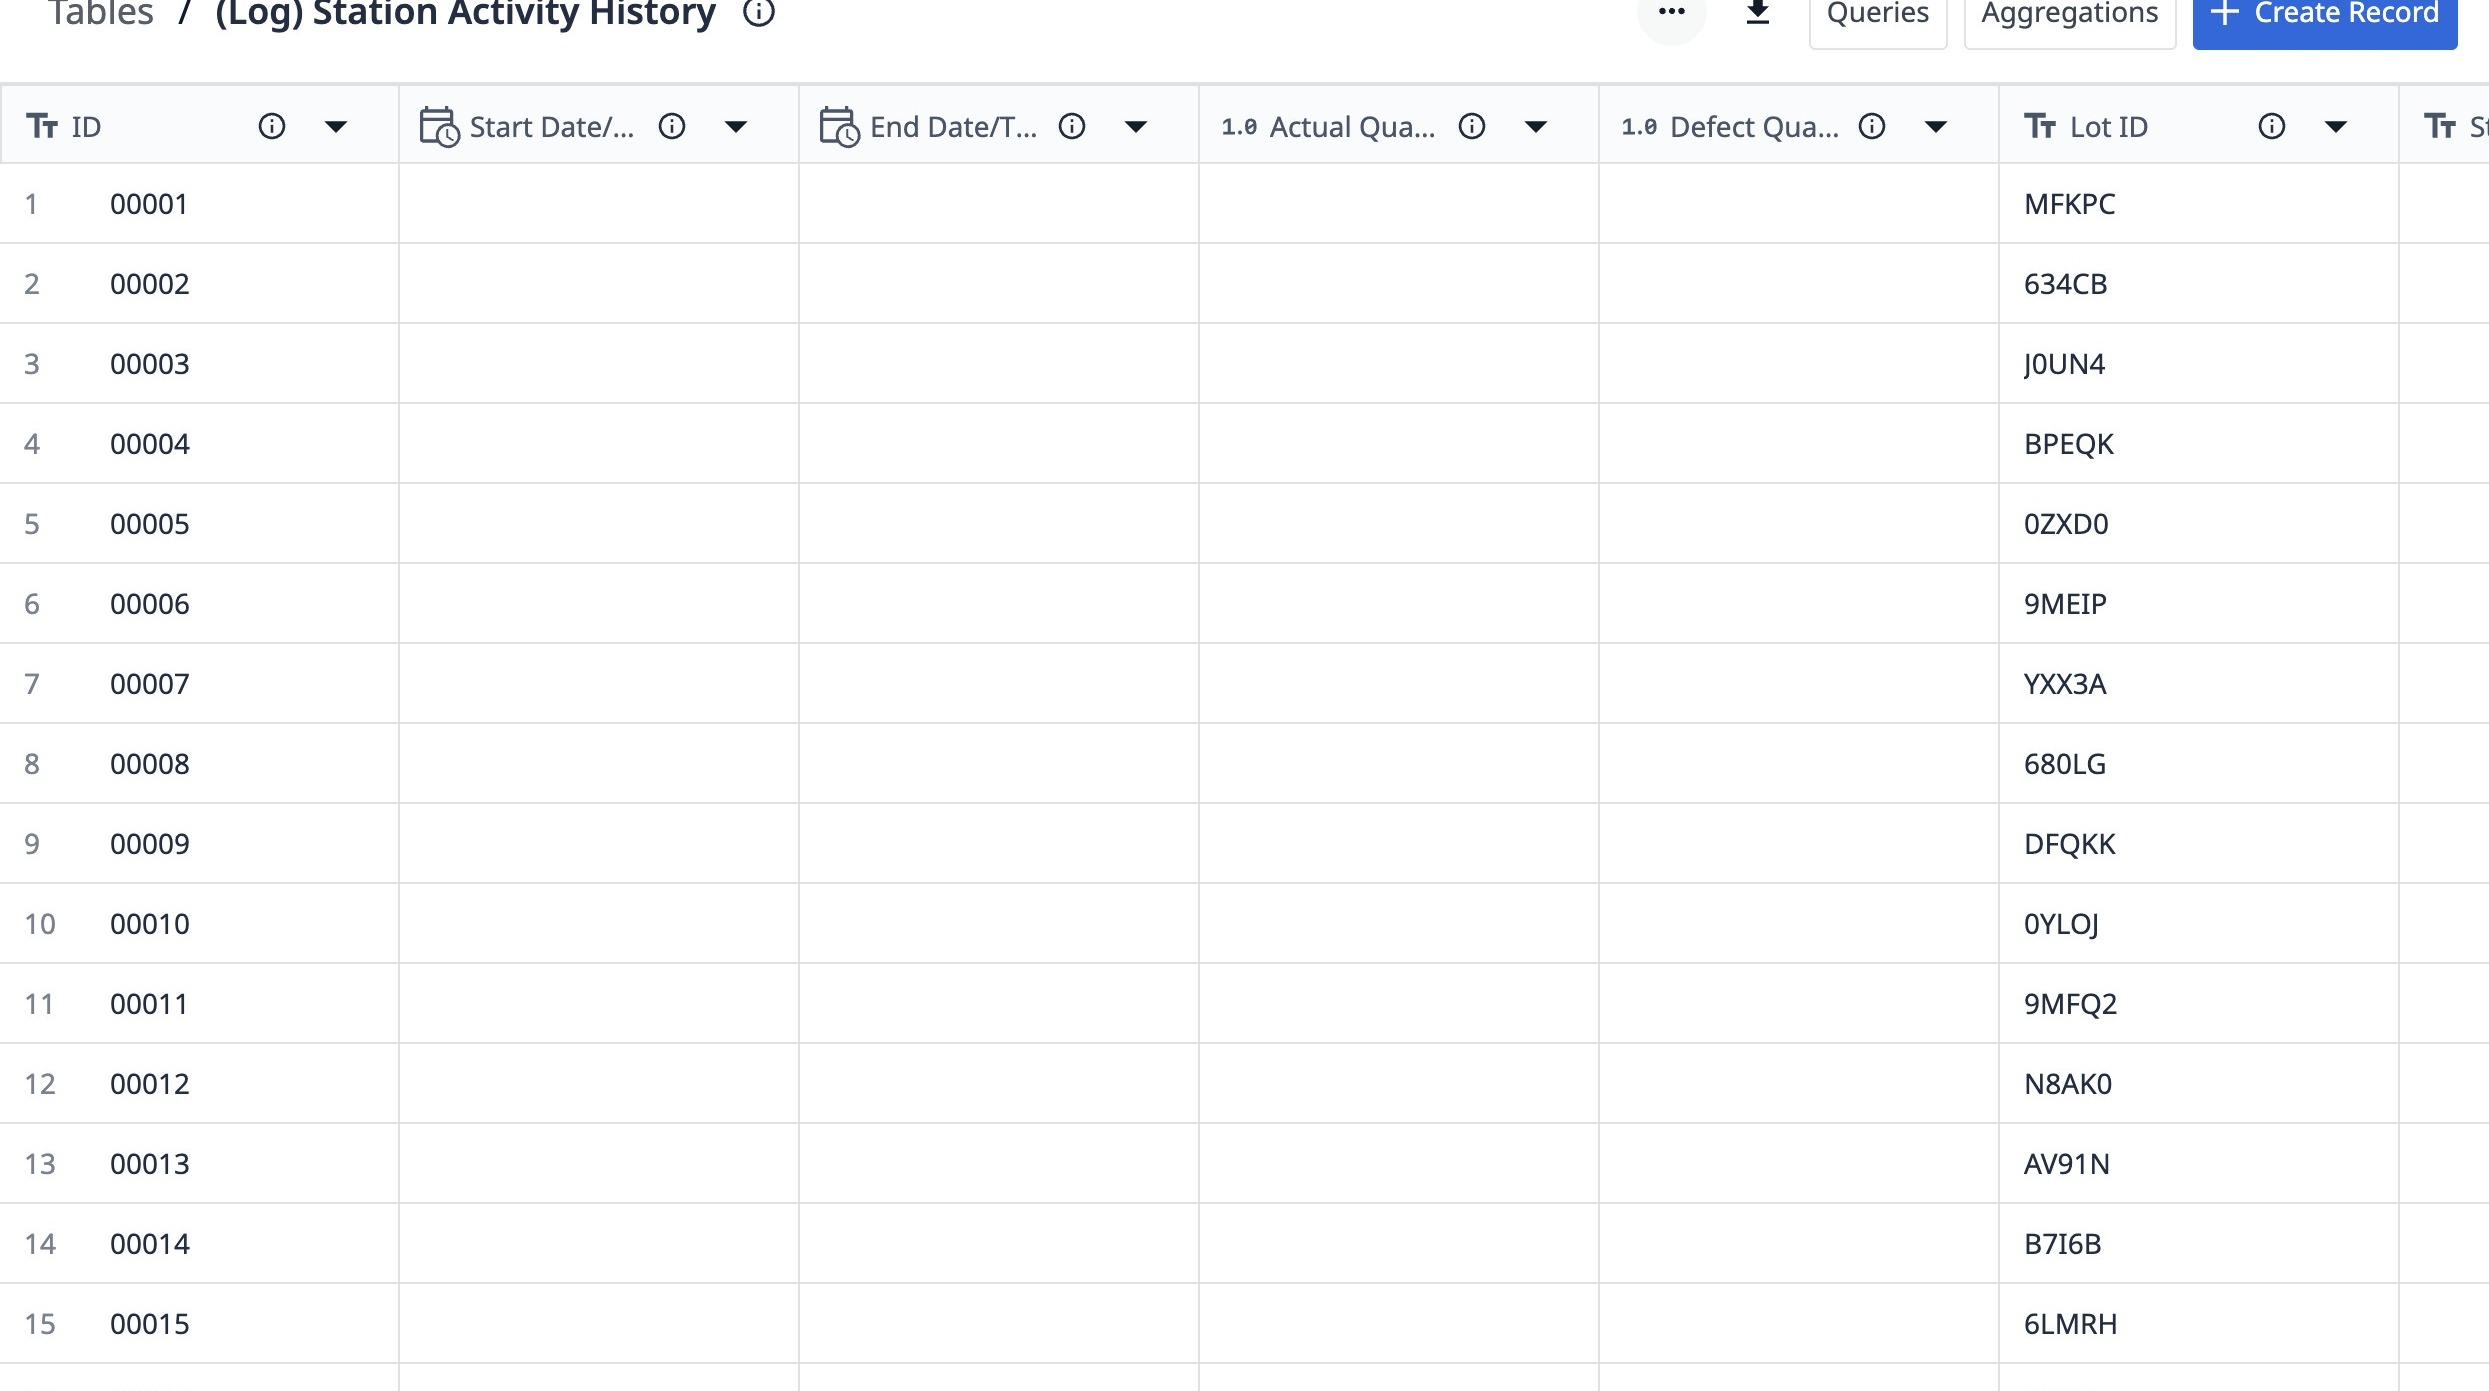
1. Navigate to a station activity history table.
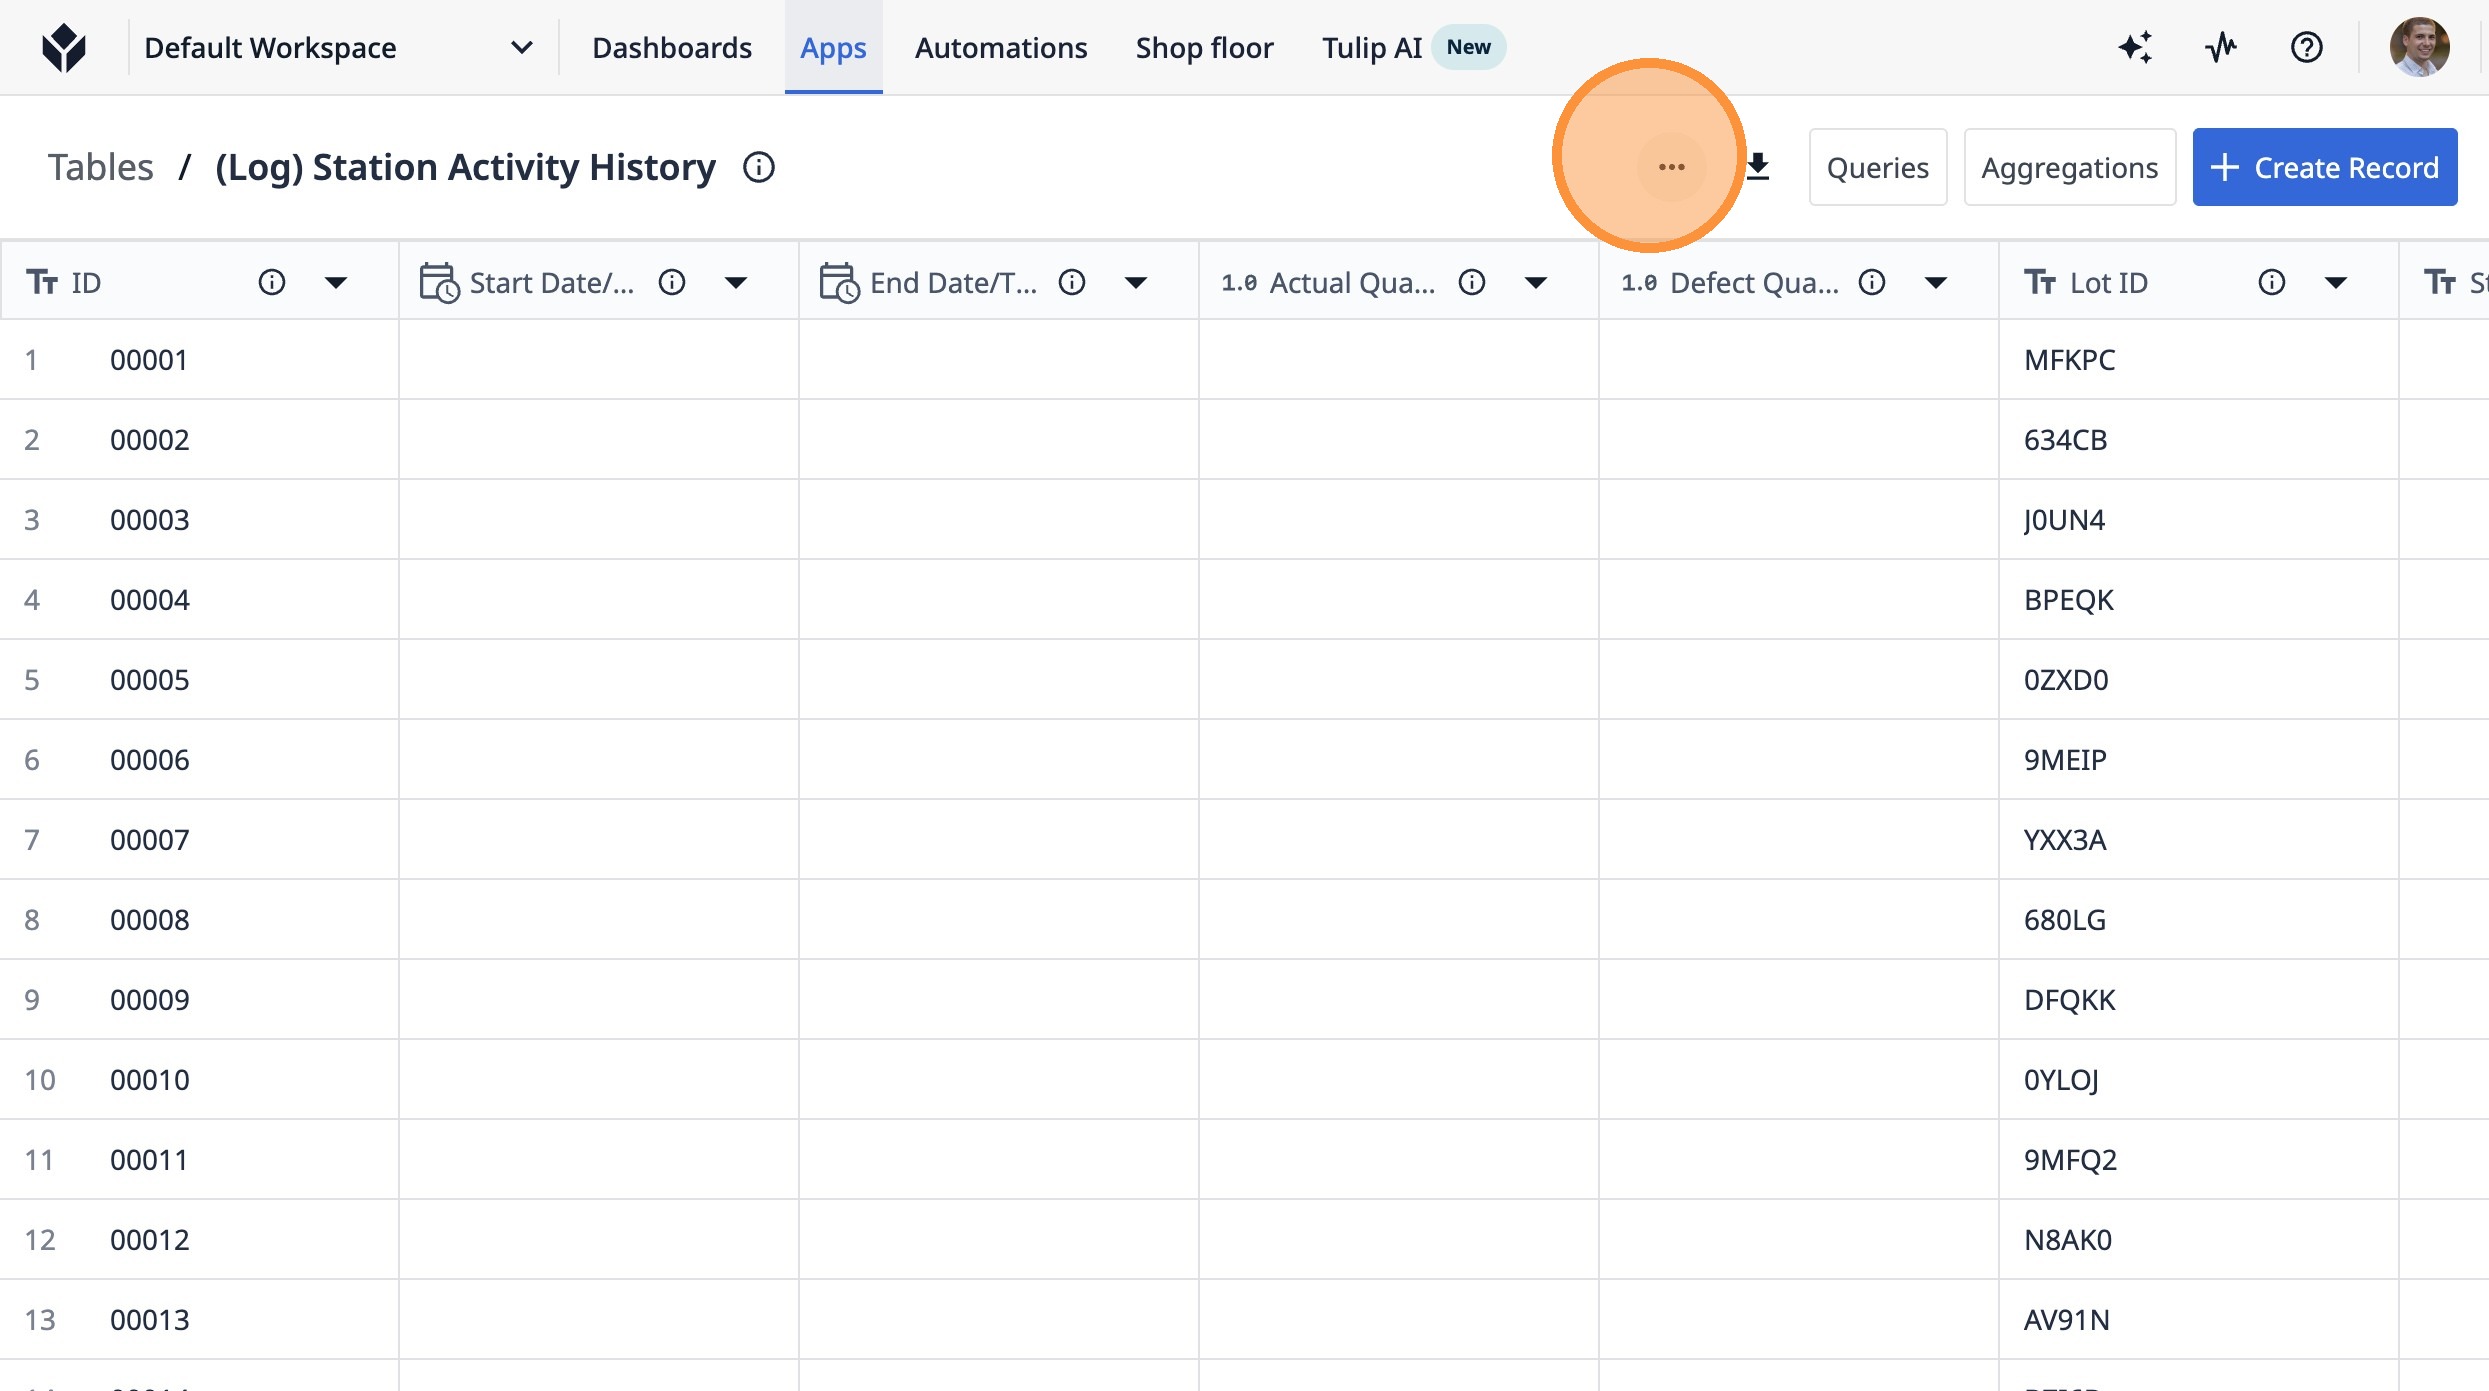
2. Click this button.
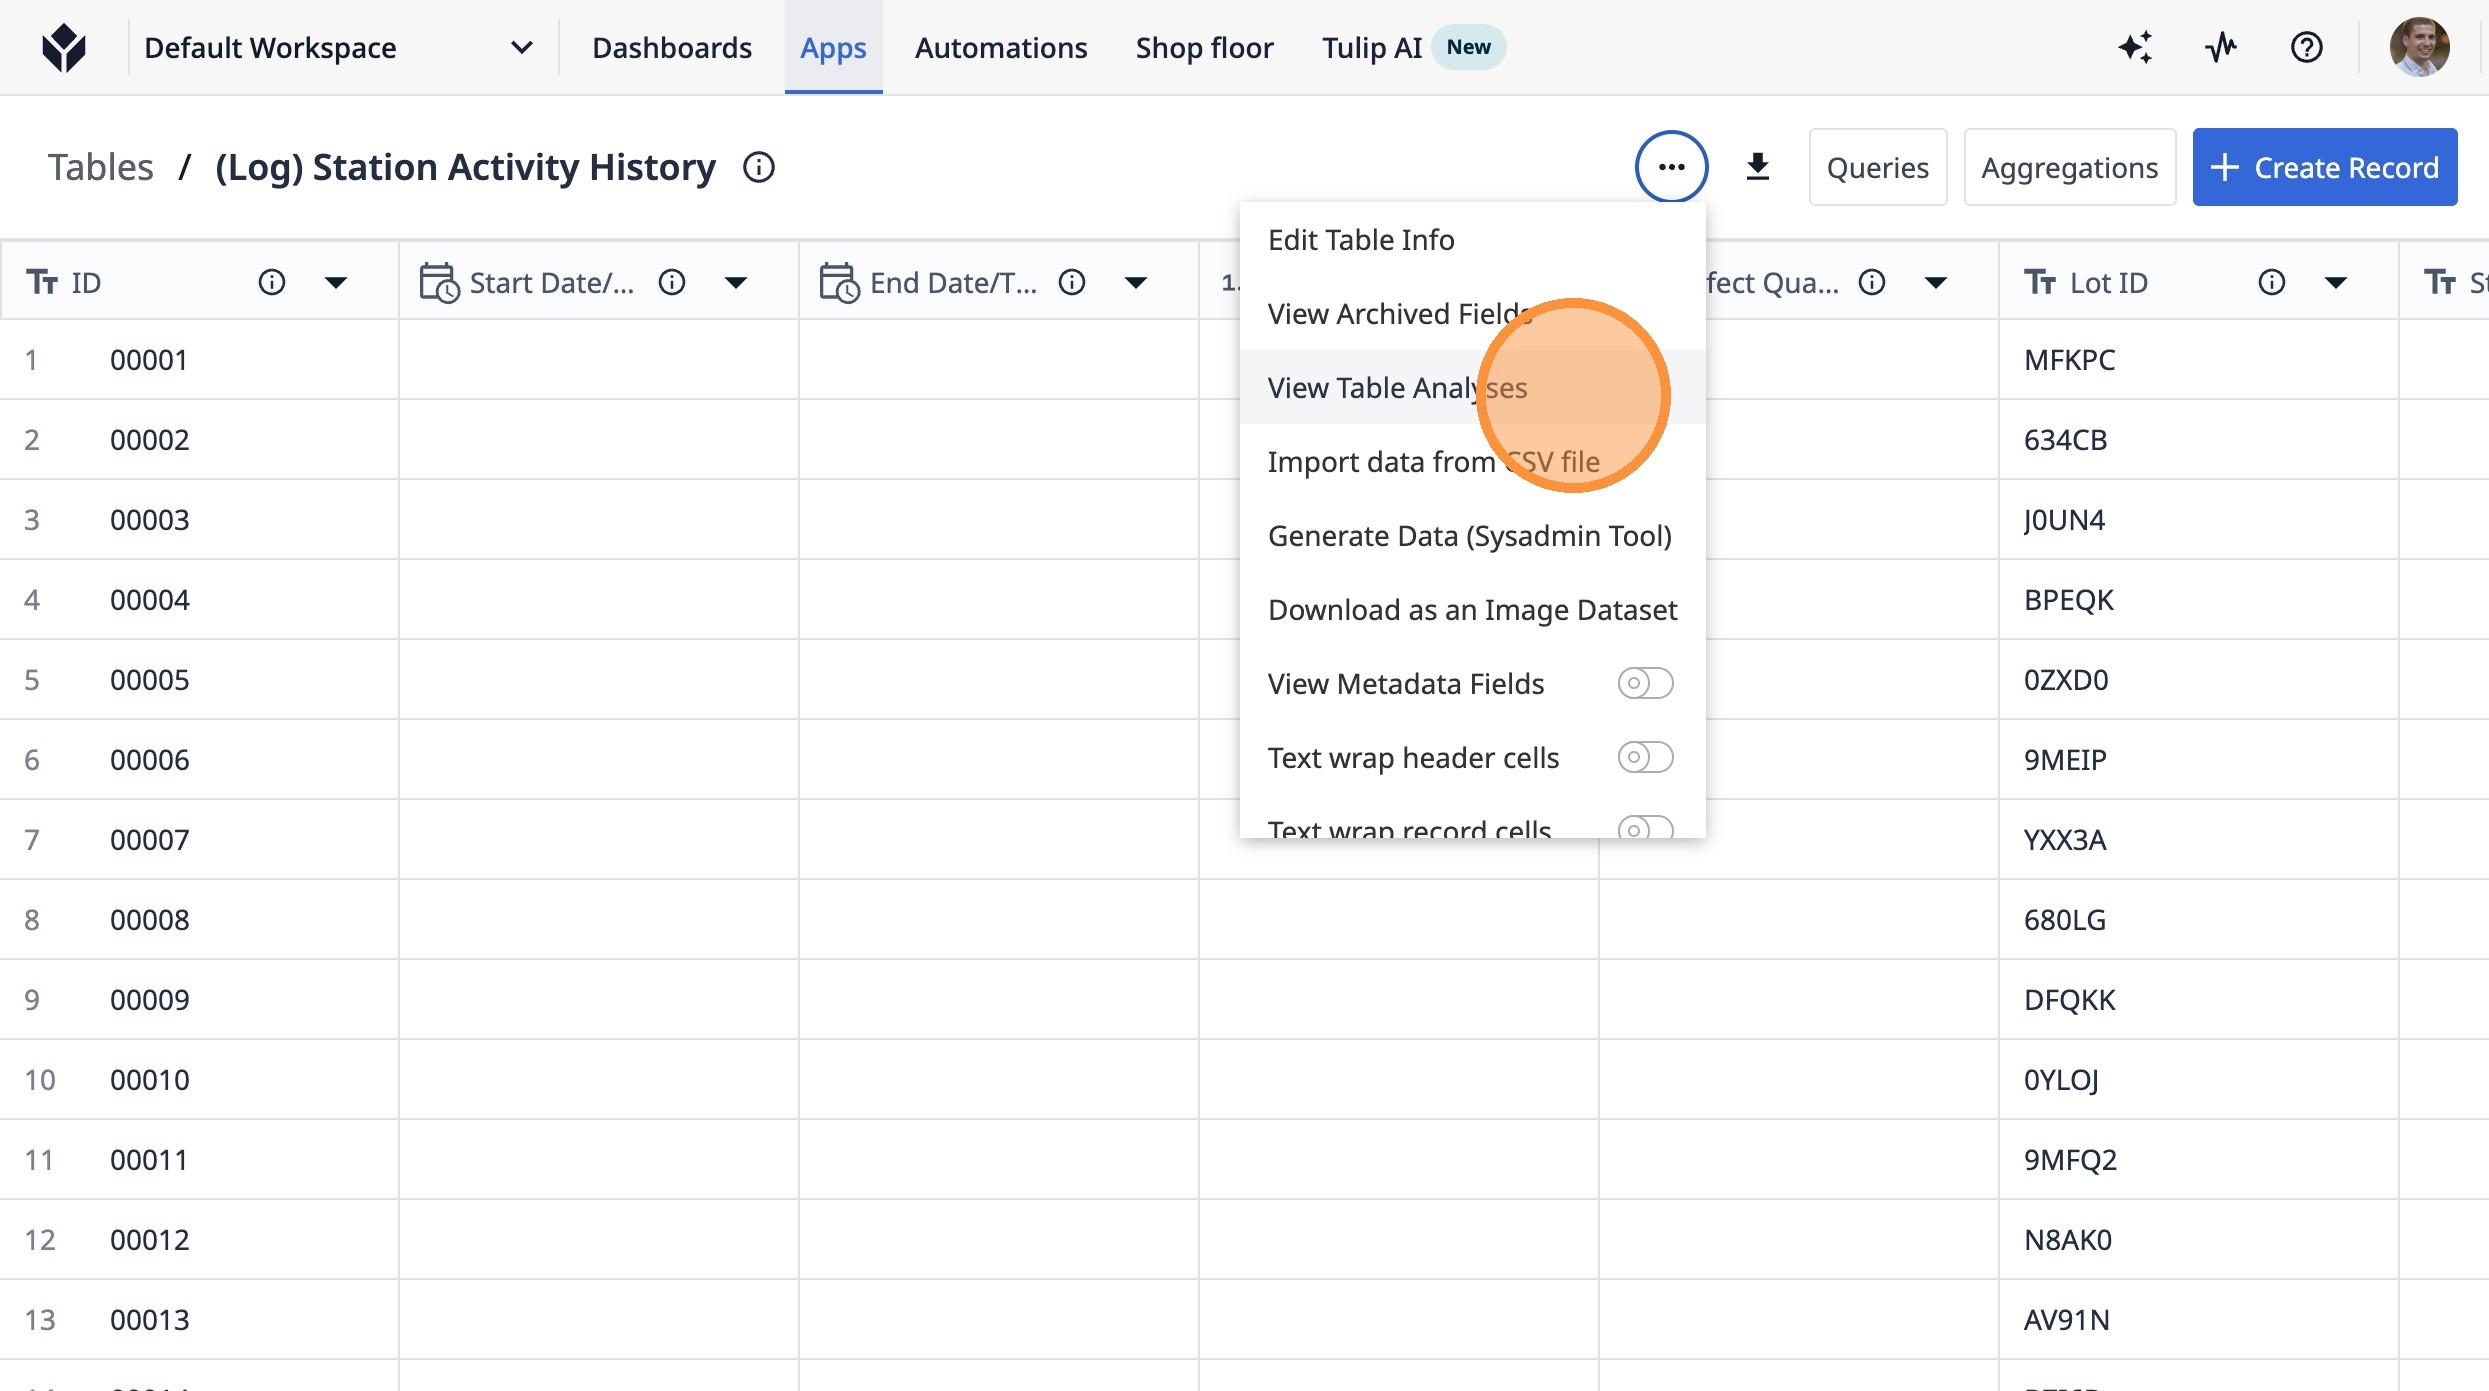
3. Click "View Table Analyses"
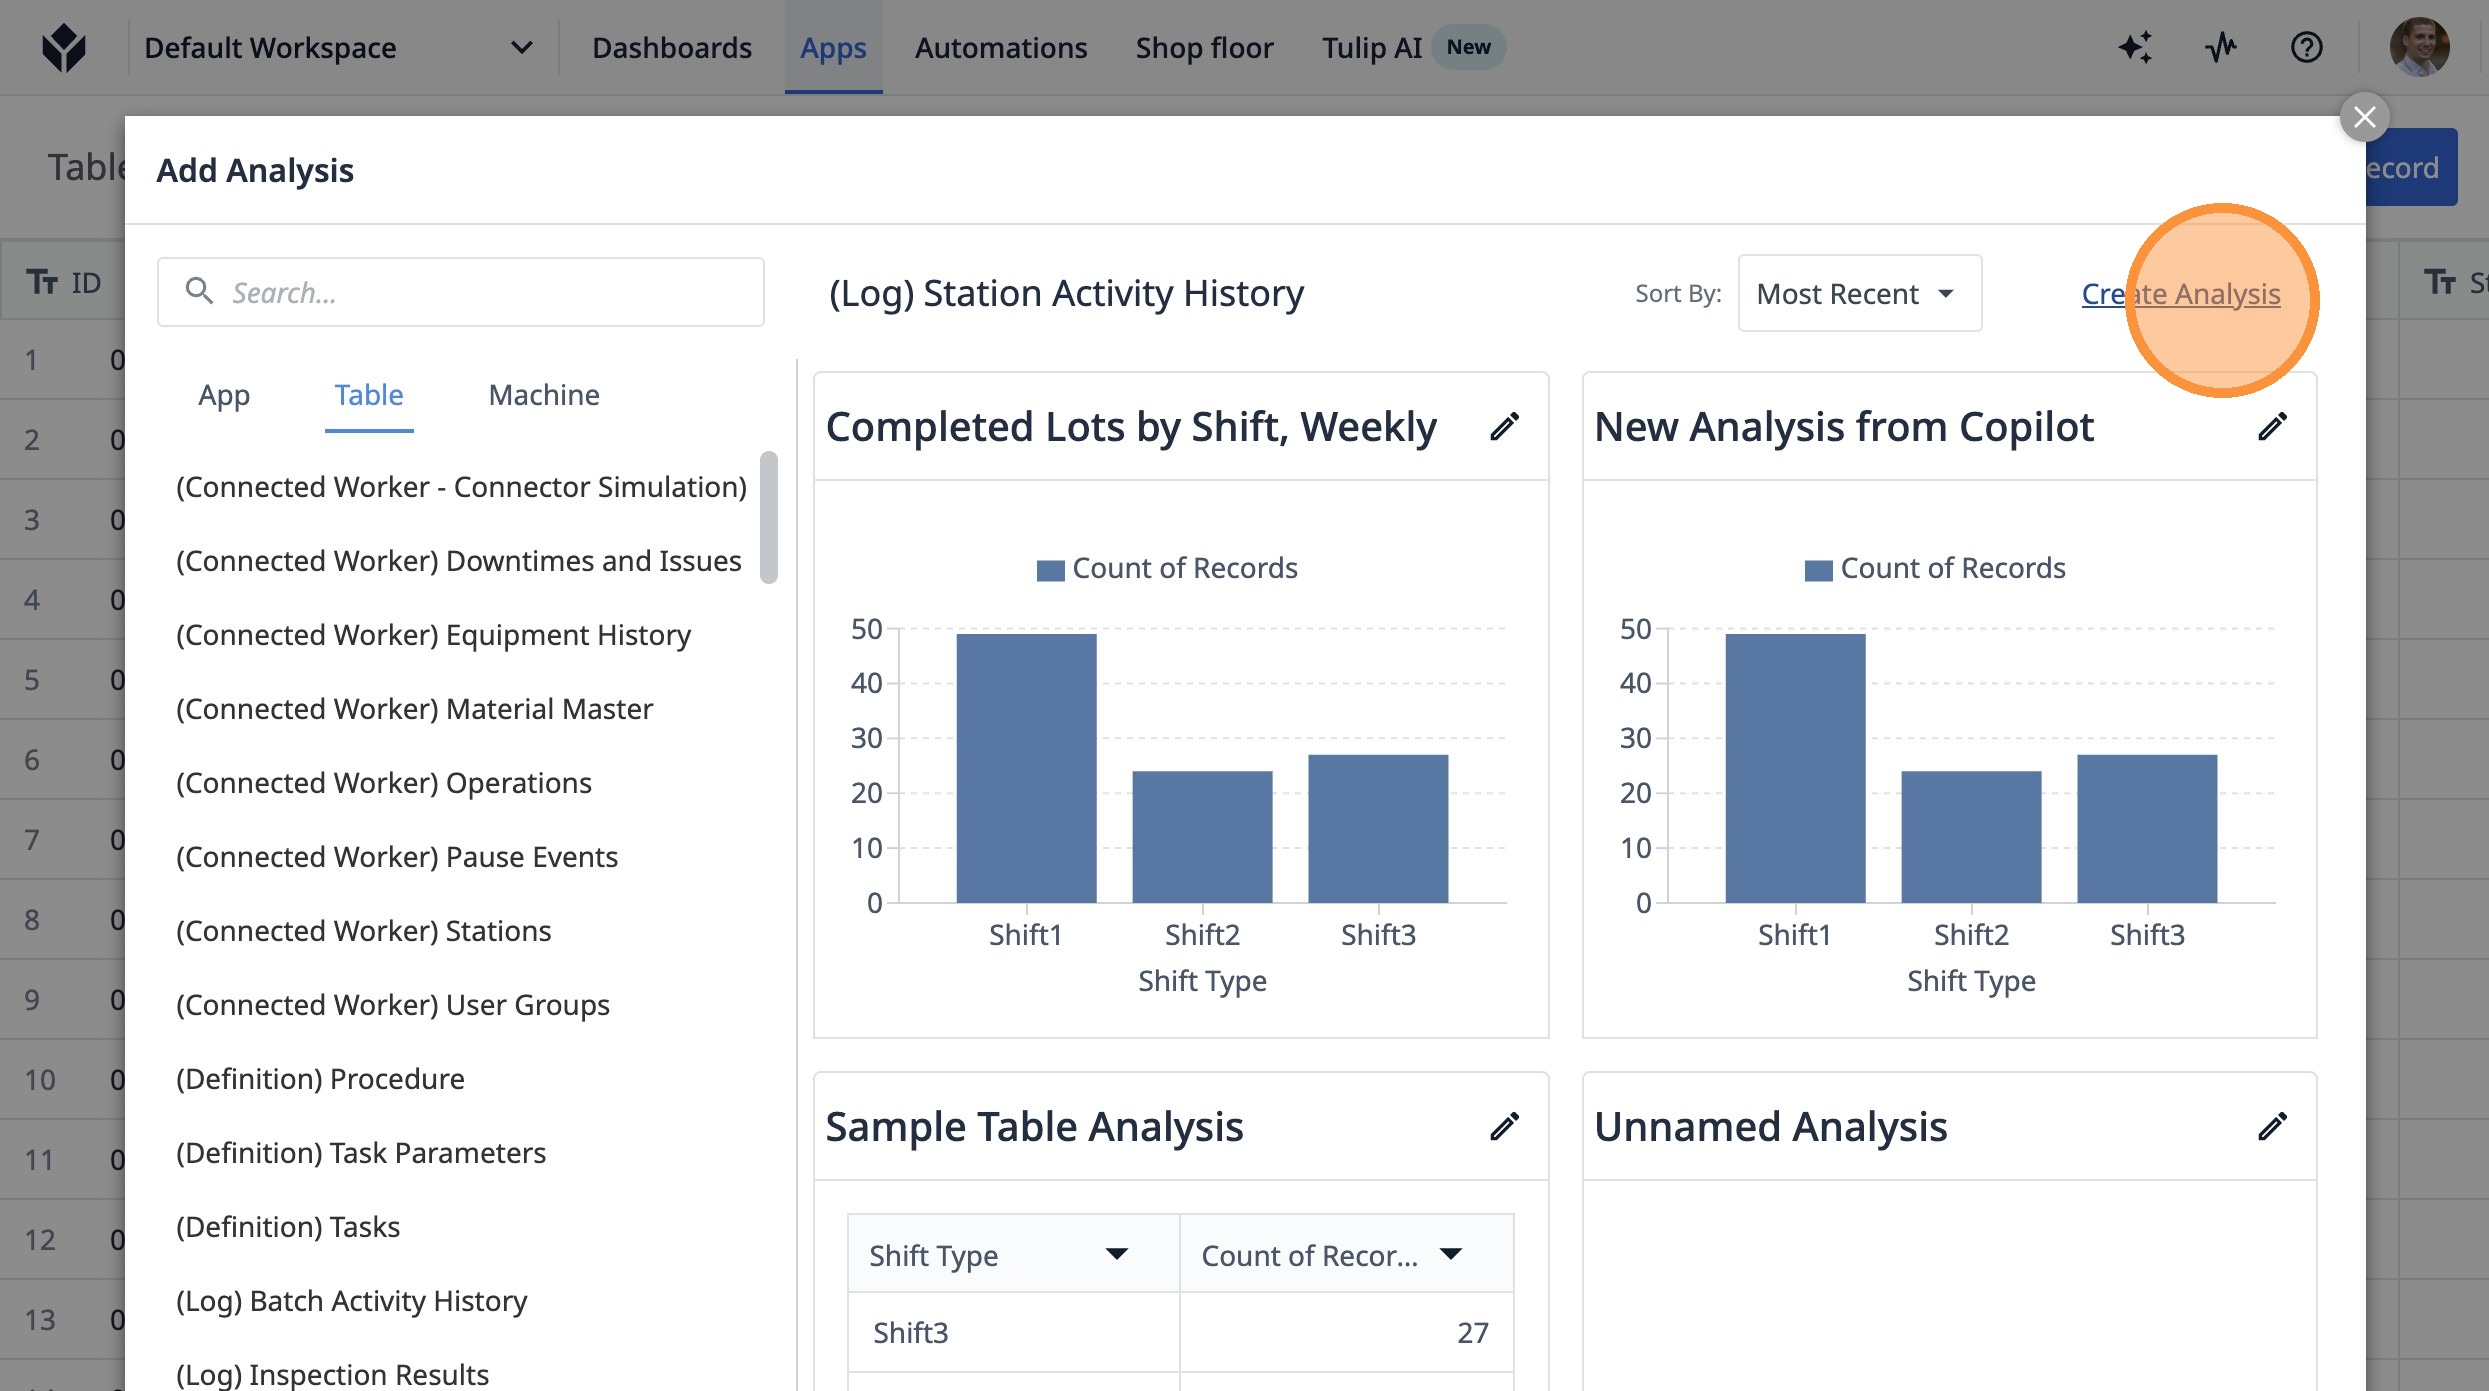
4. Click "Create Analysis"
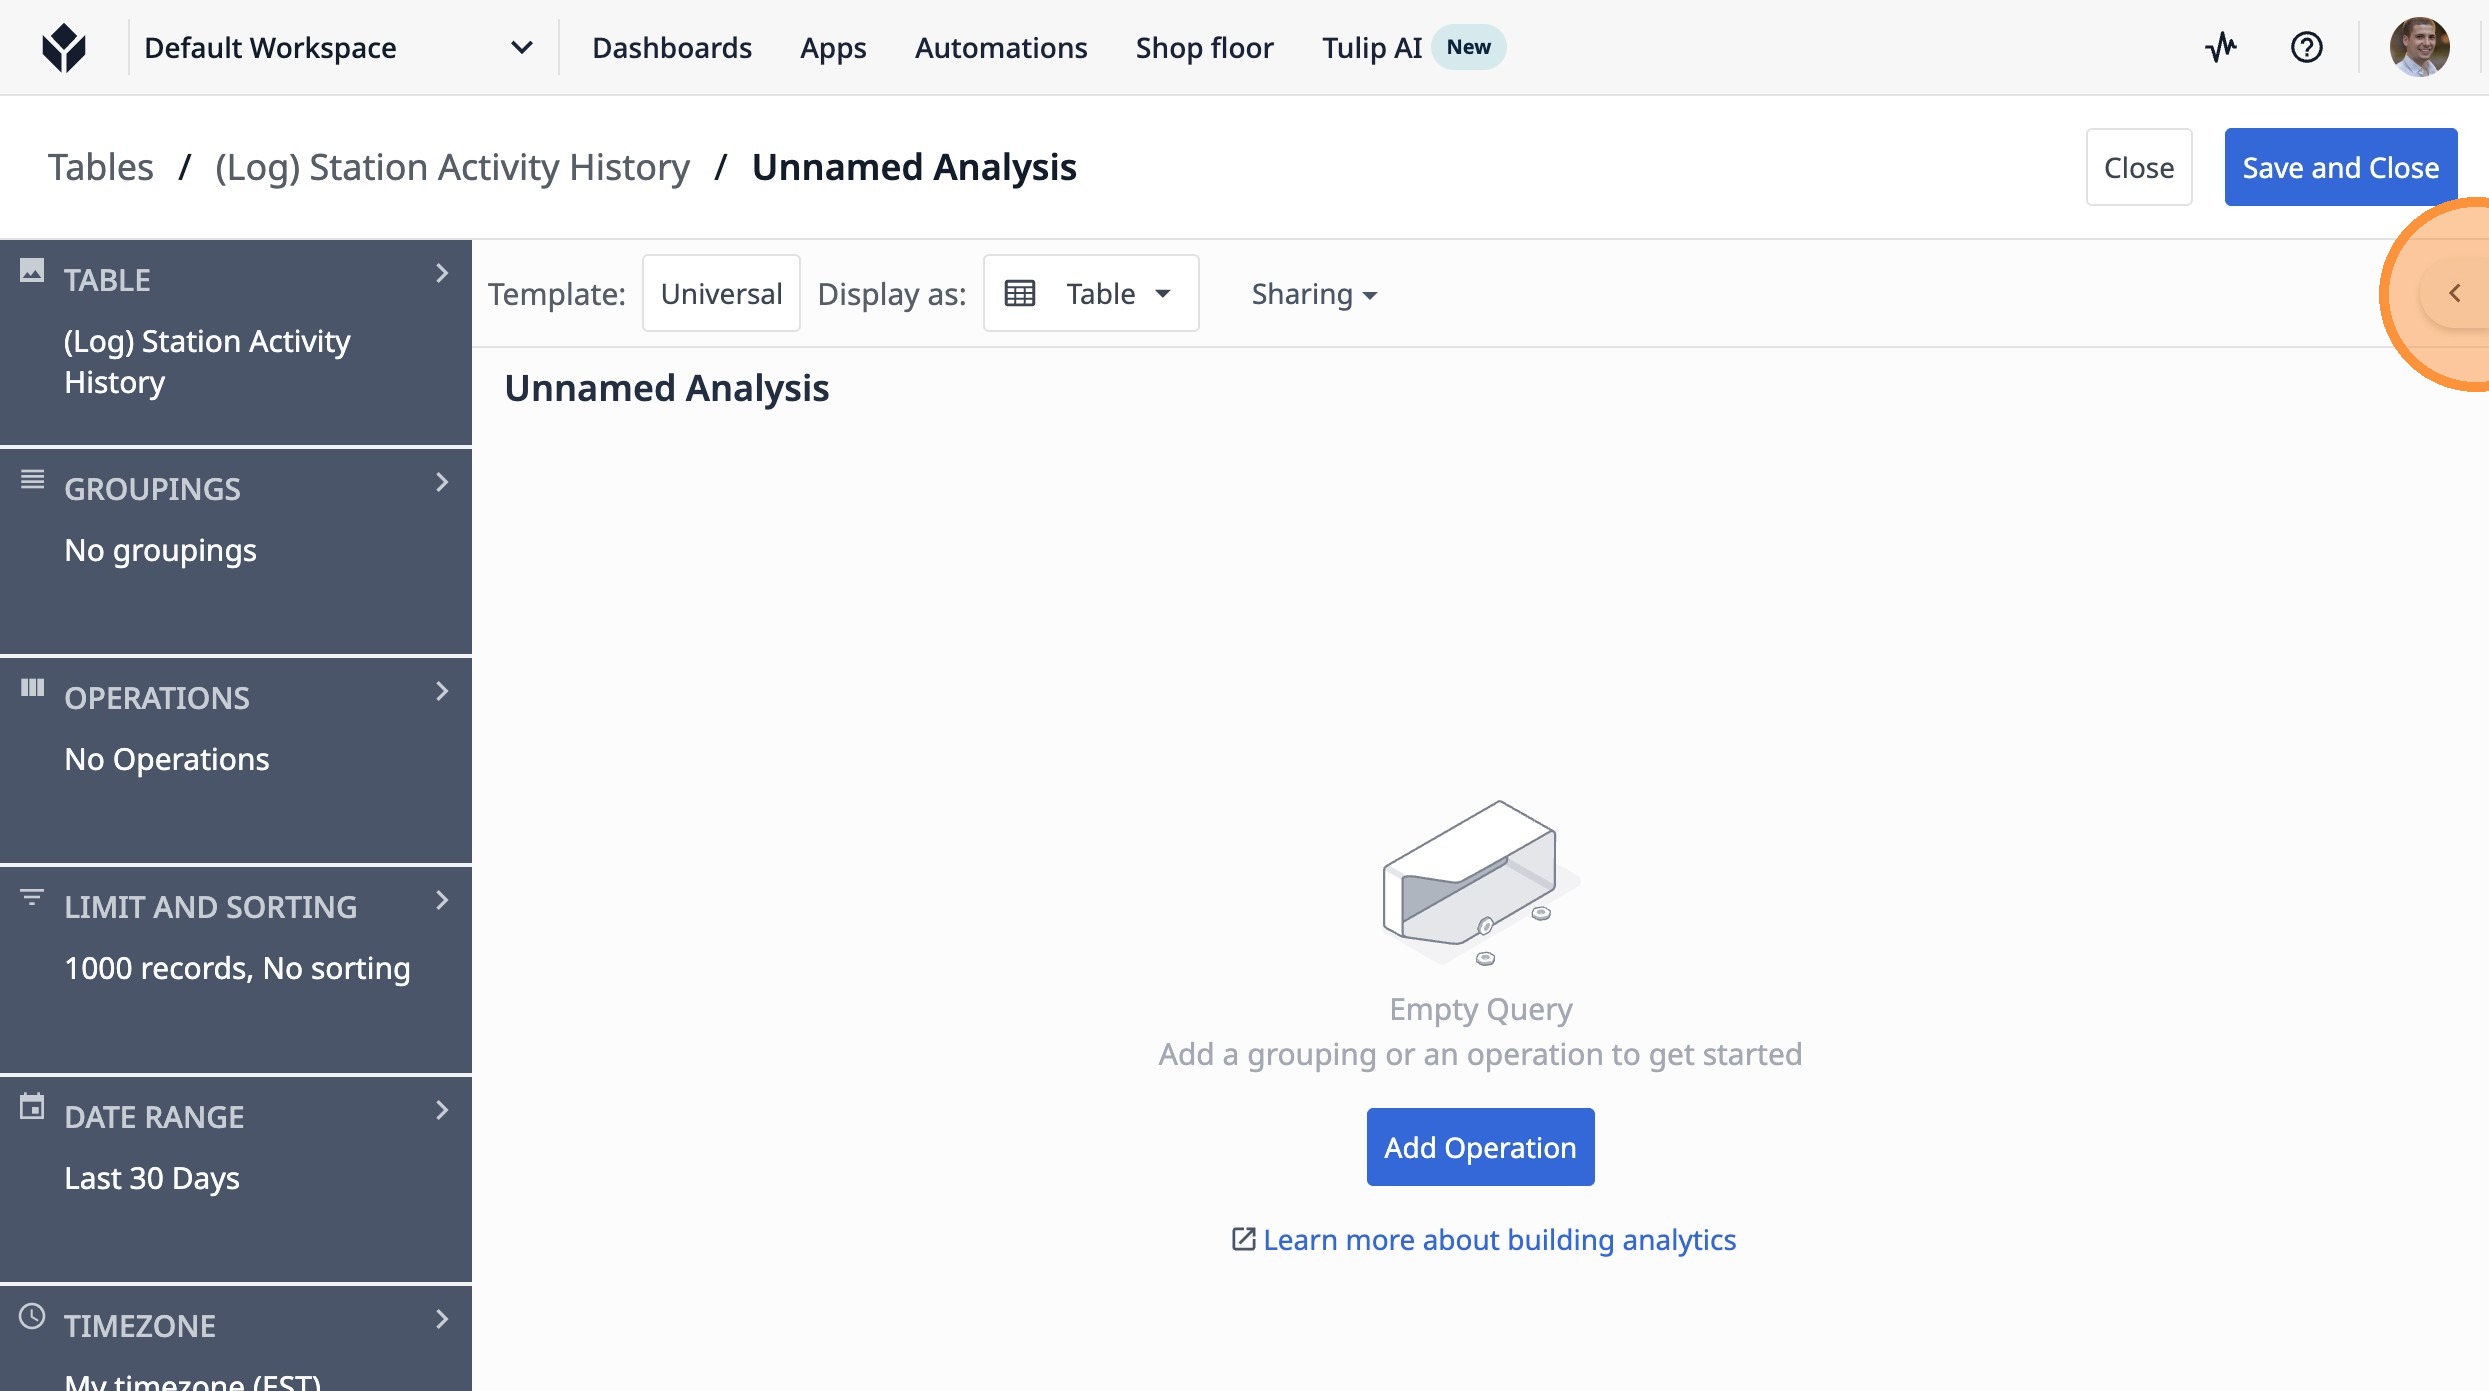
5. Click this button.
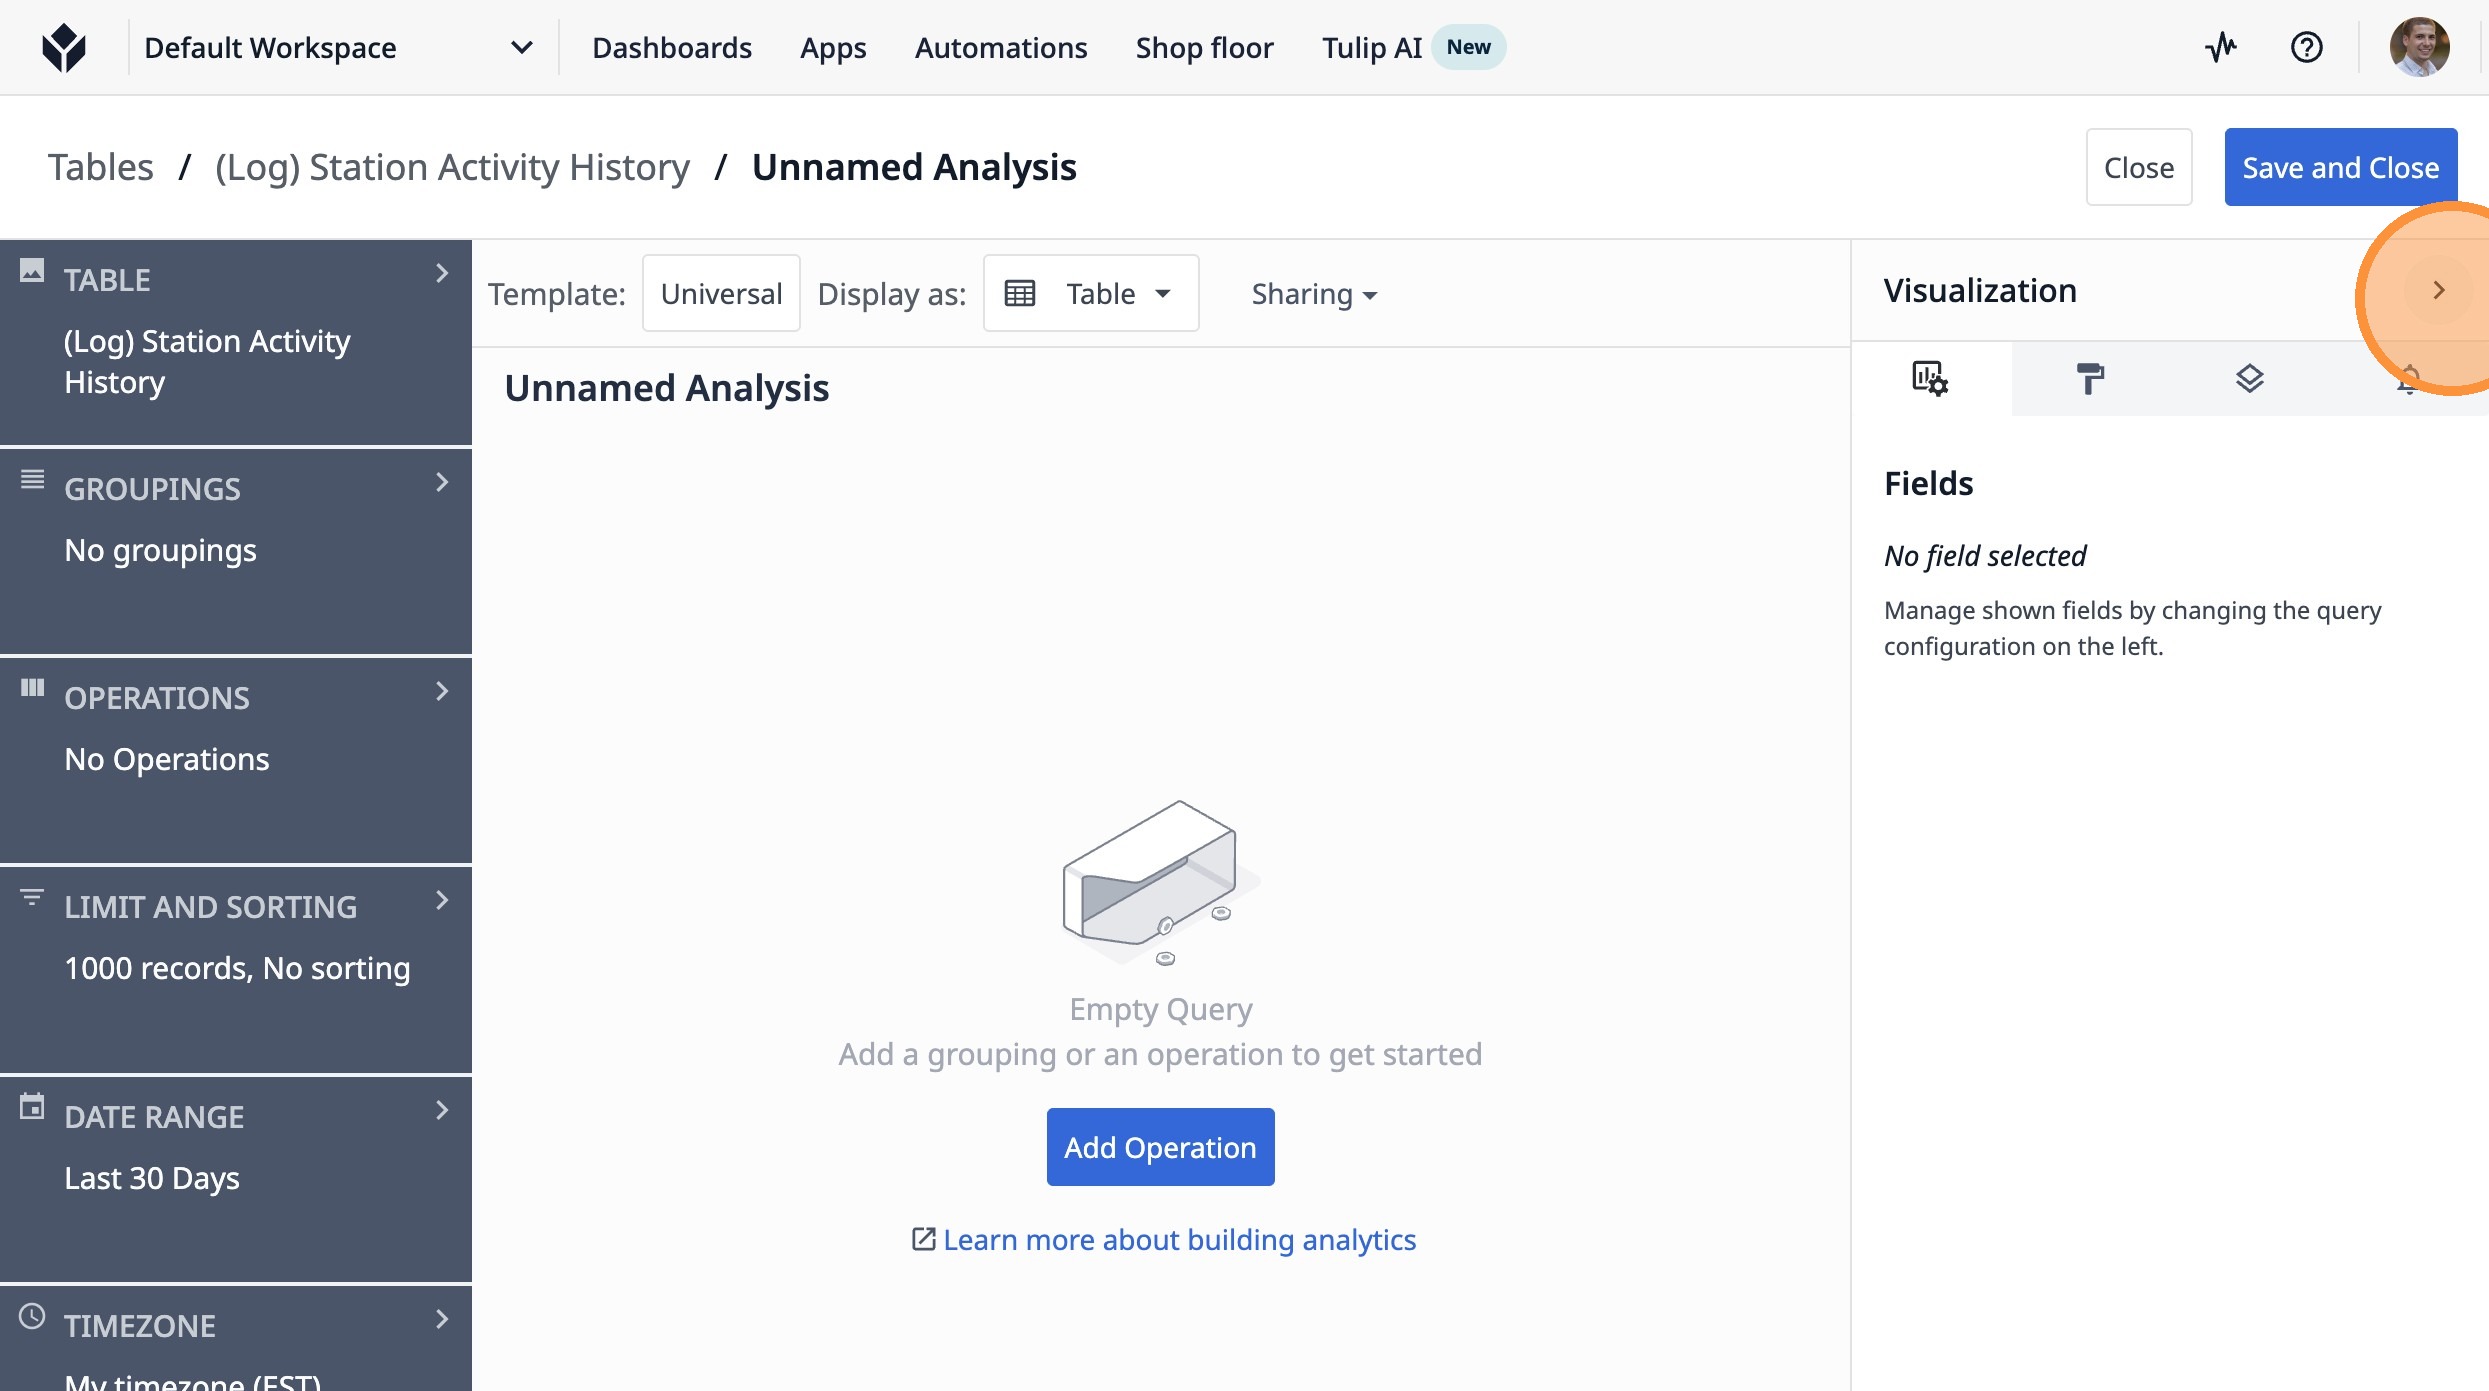
6. Click this icon.
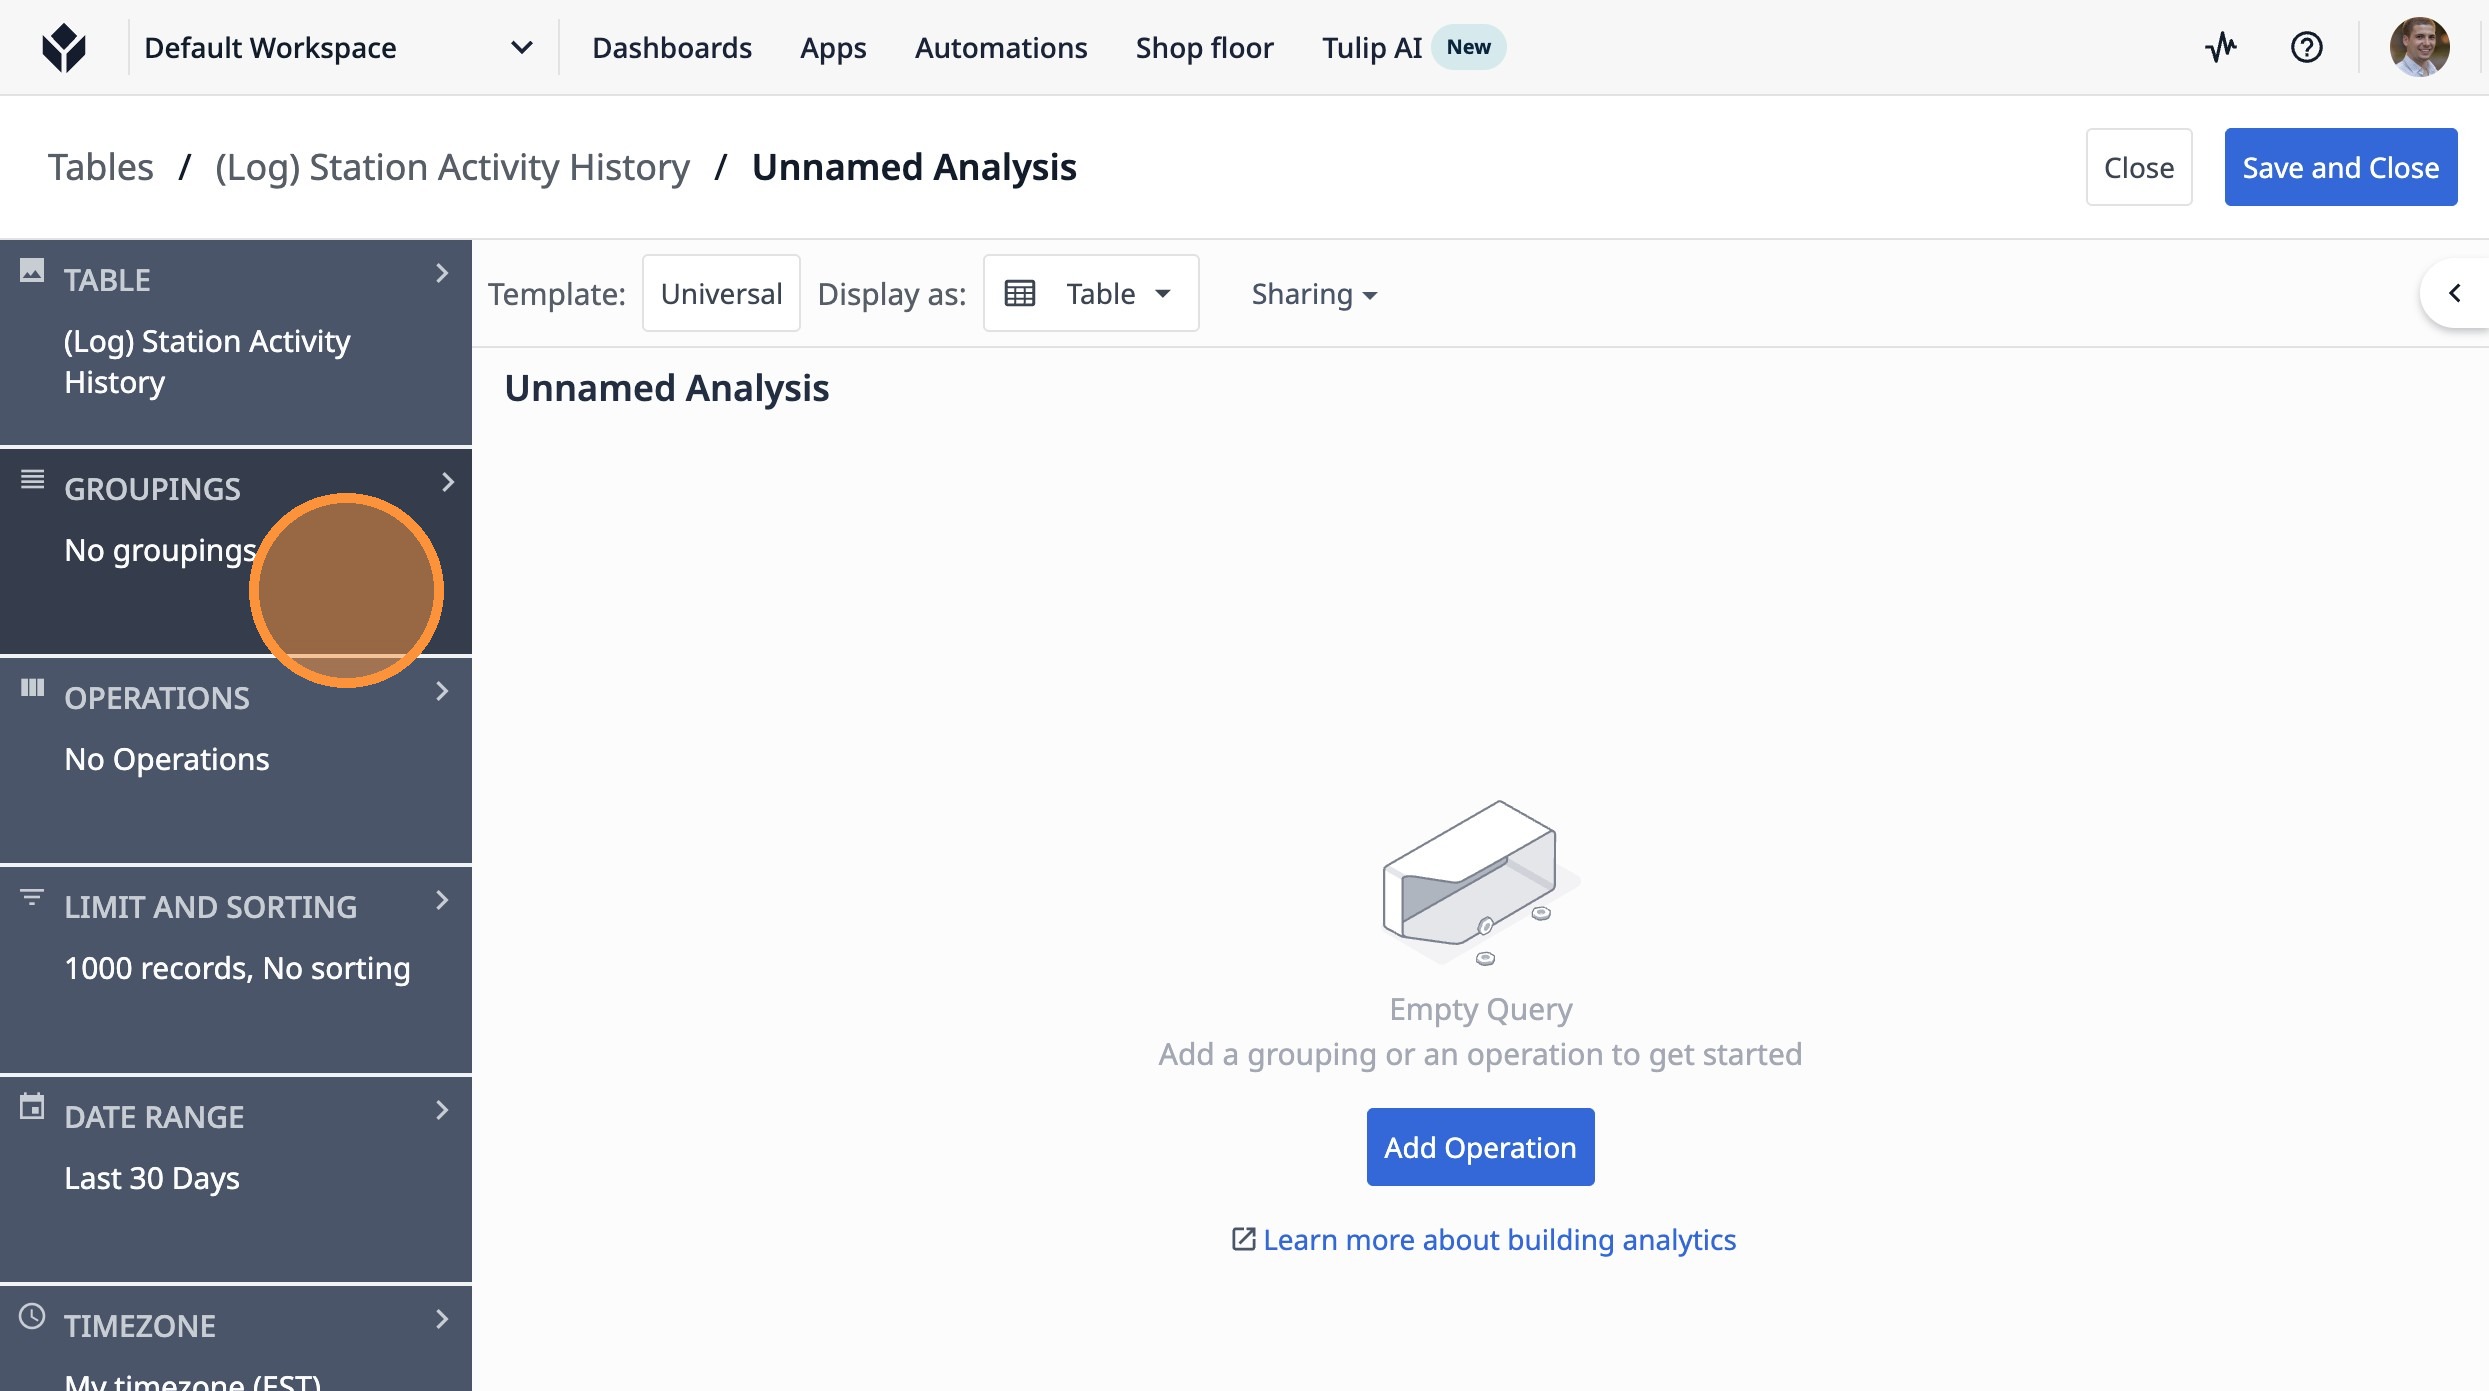
7. Click "No groupings"
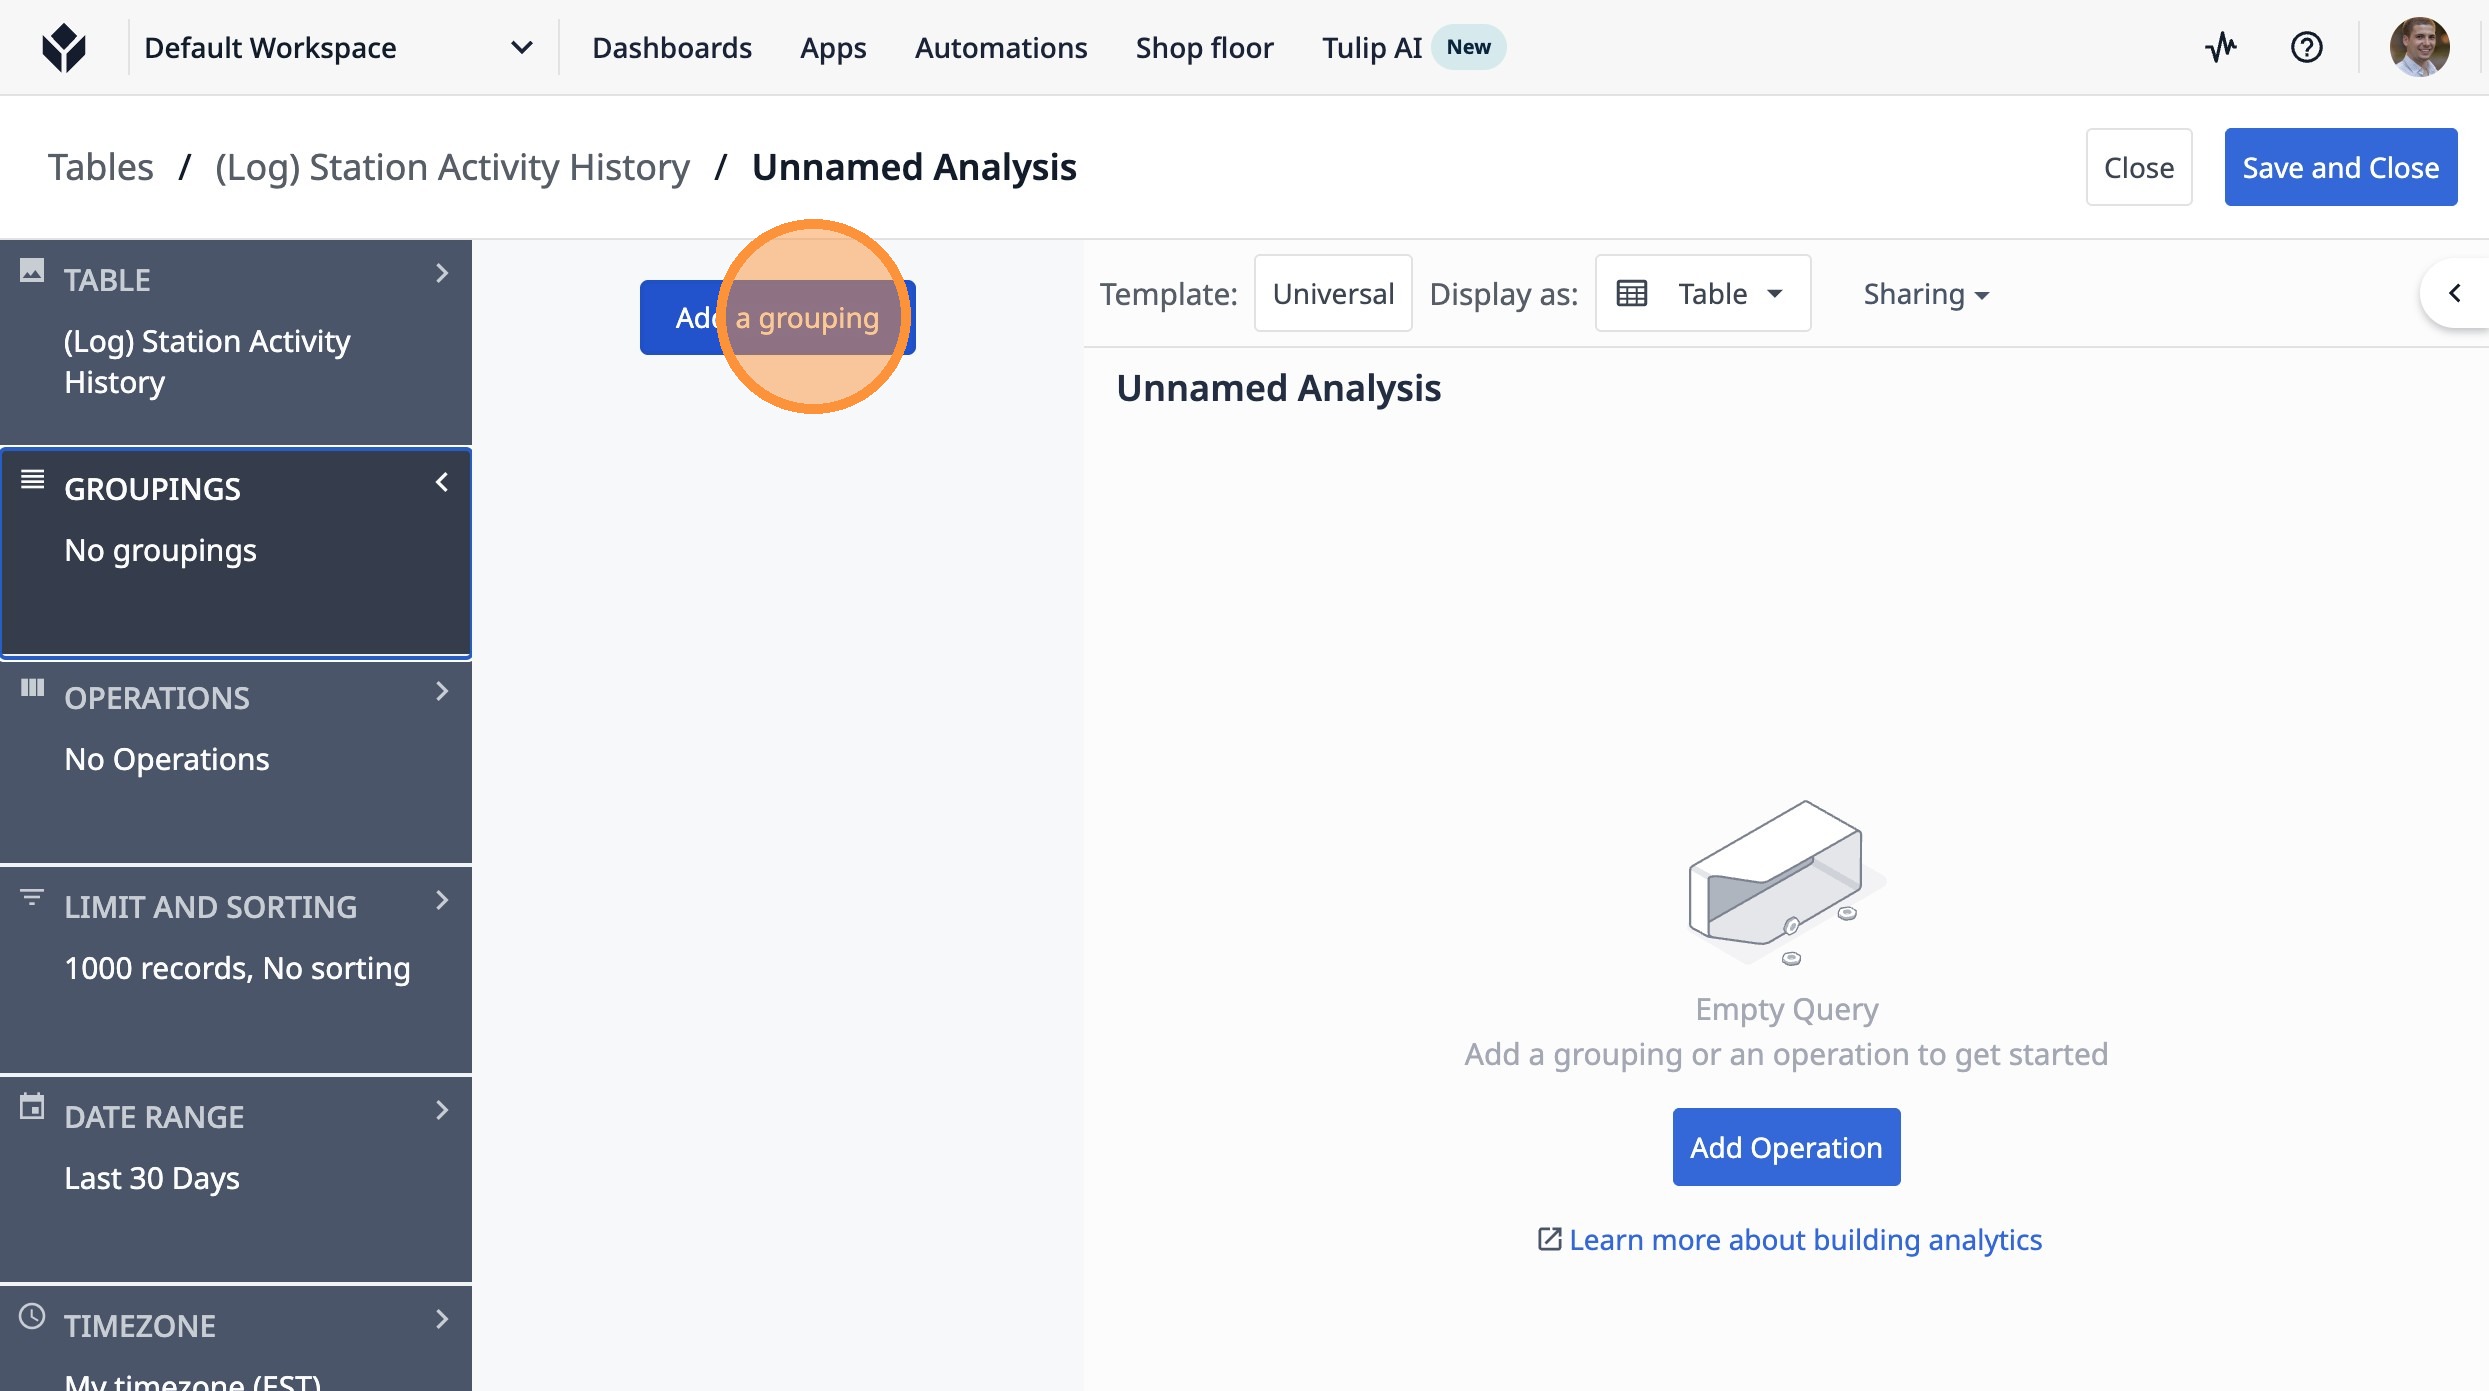
8. Click "Add a grouping"
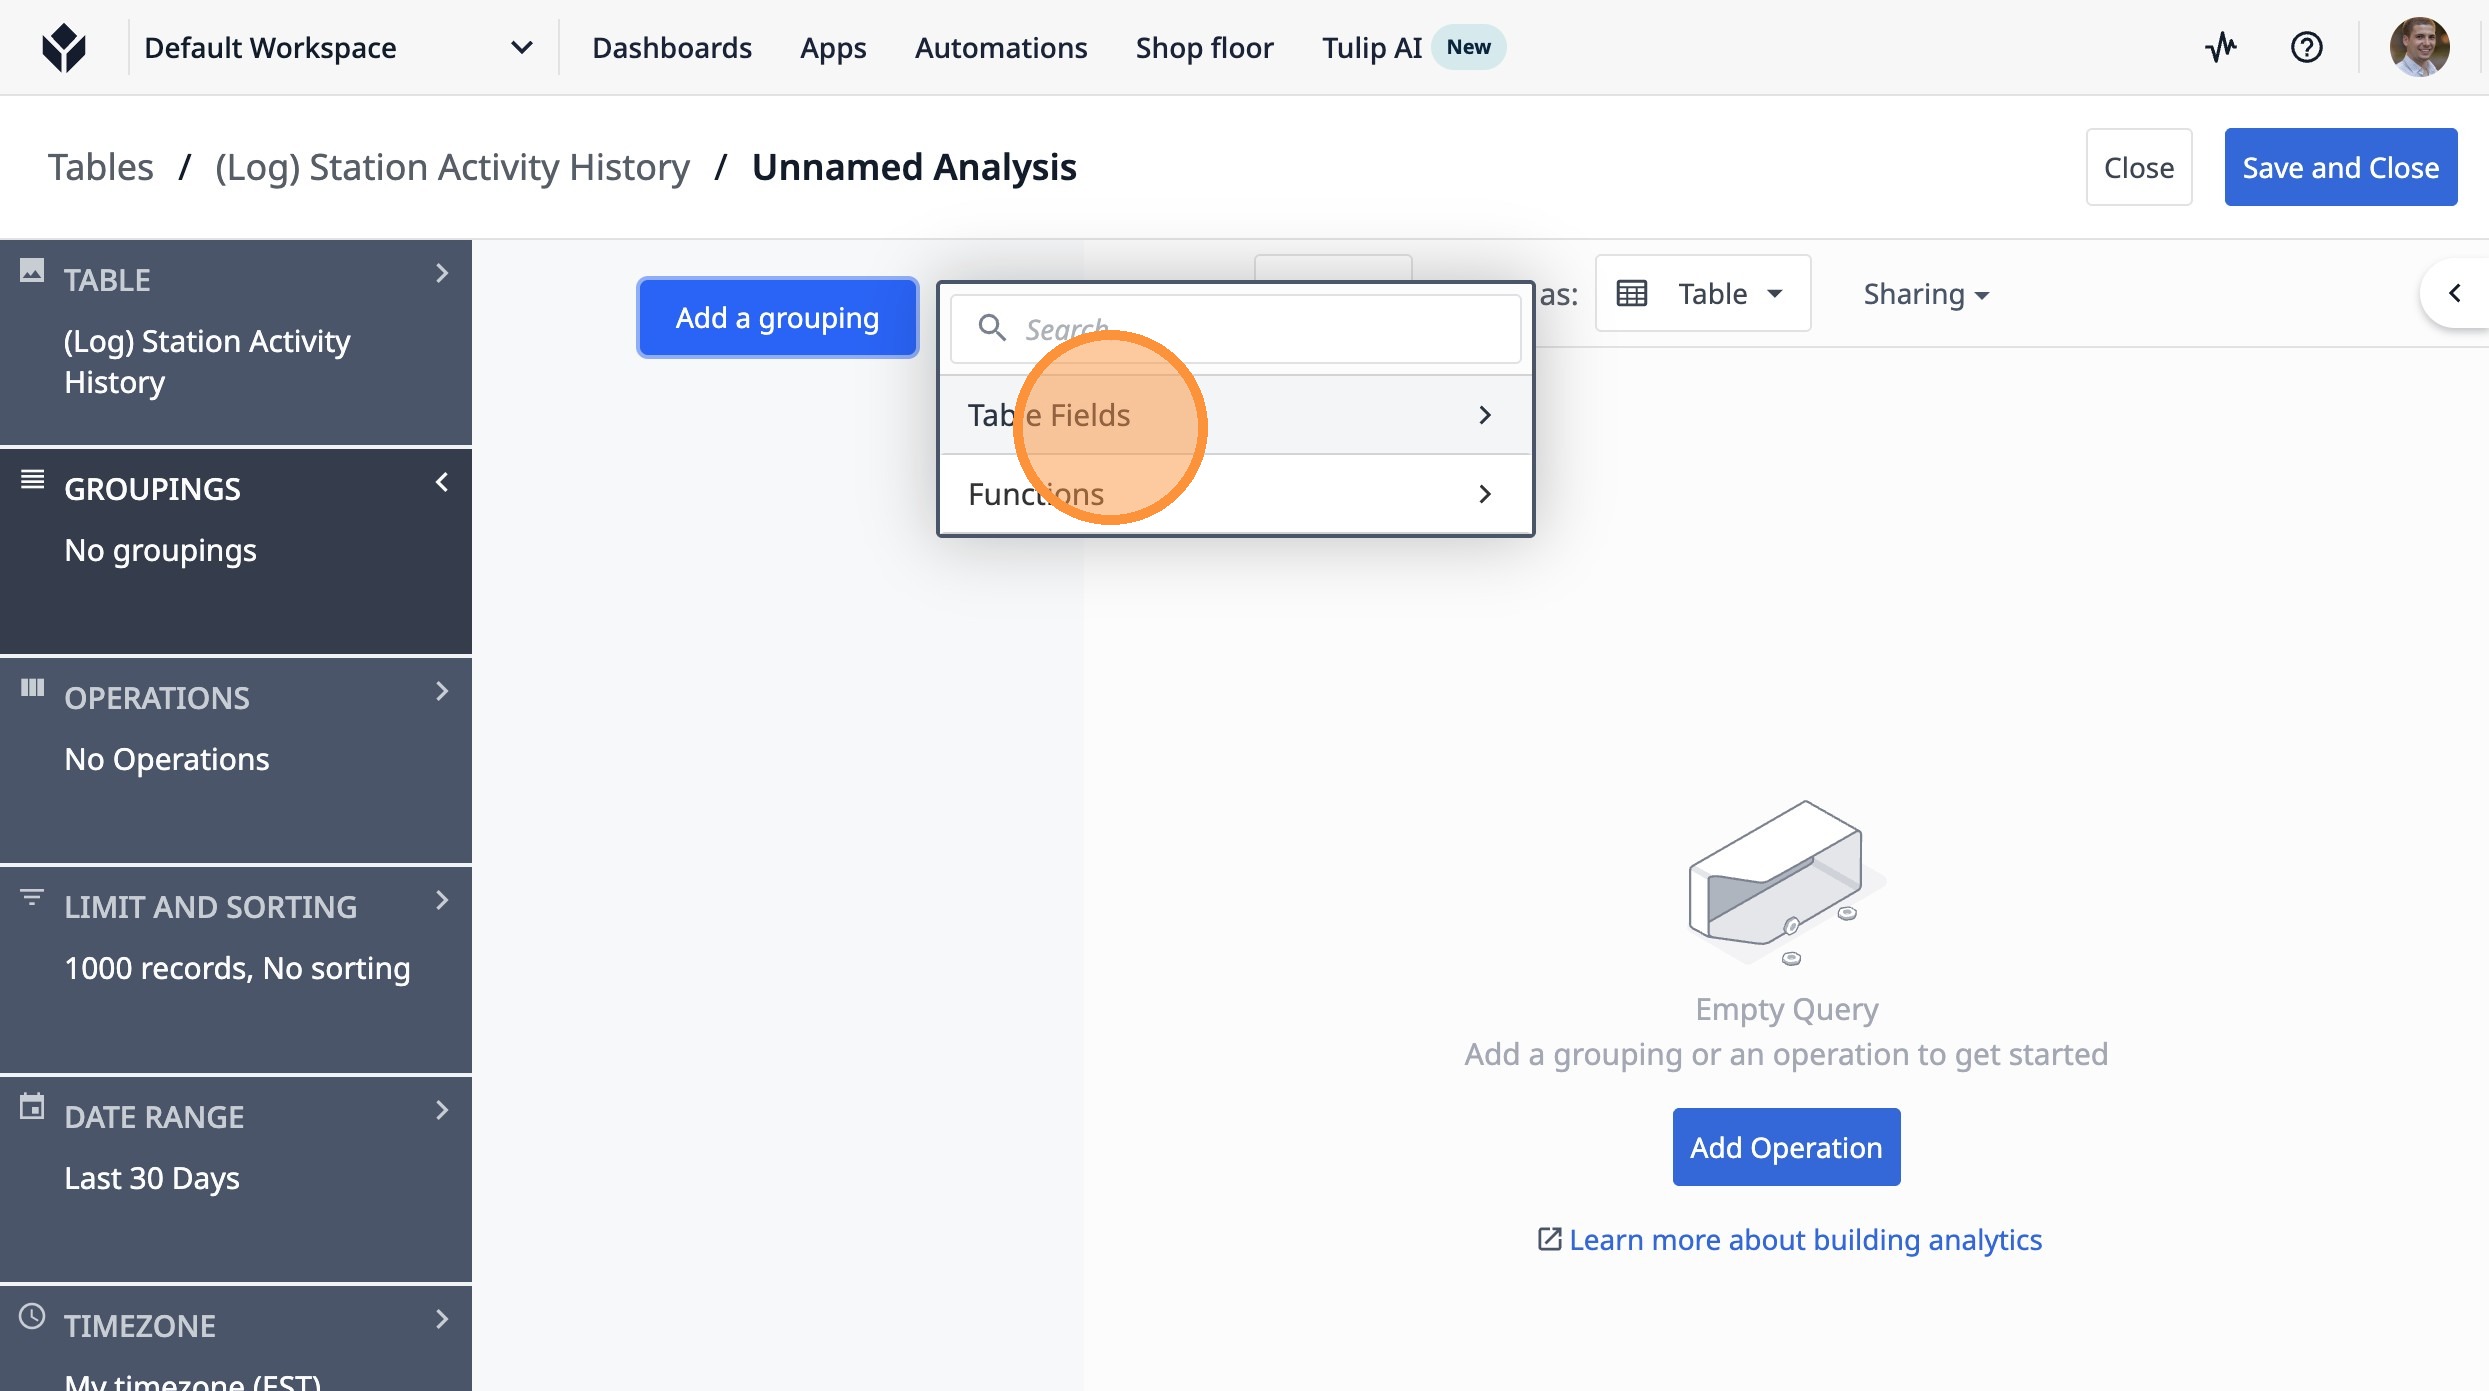
9. Click "Table Fields"
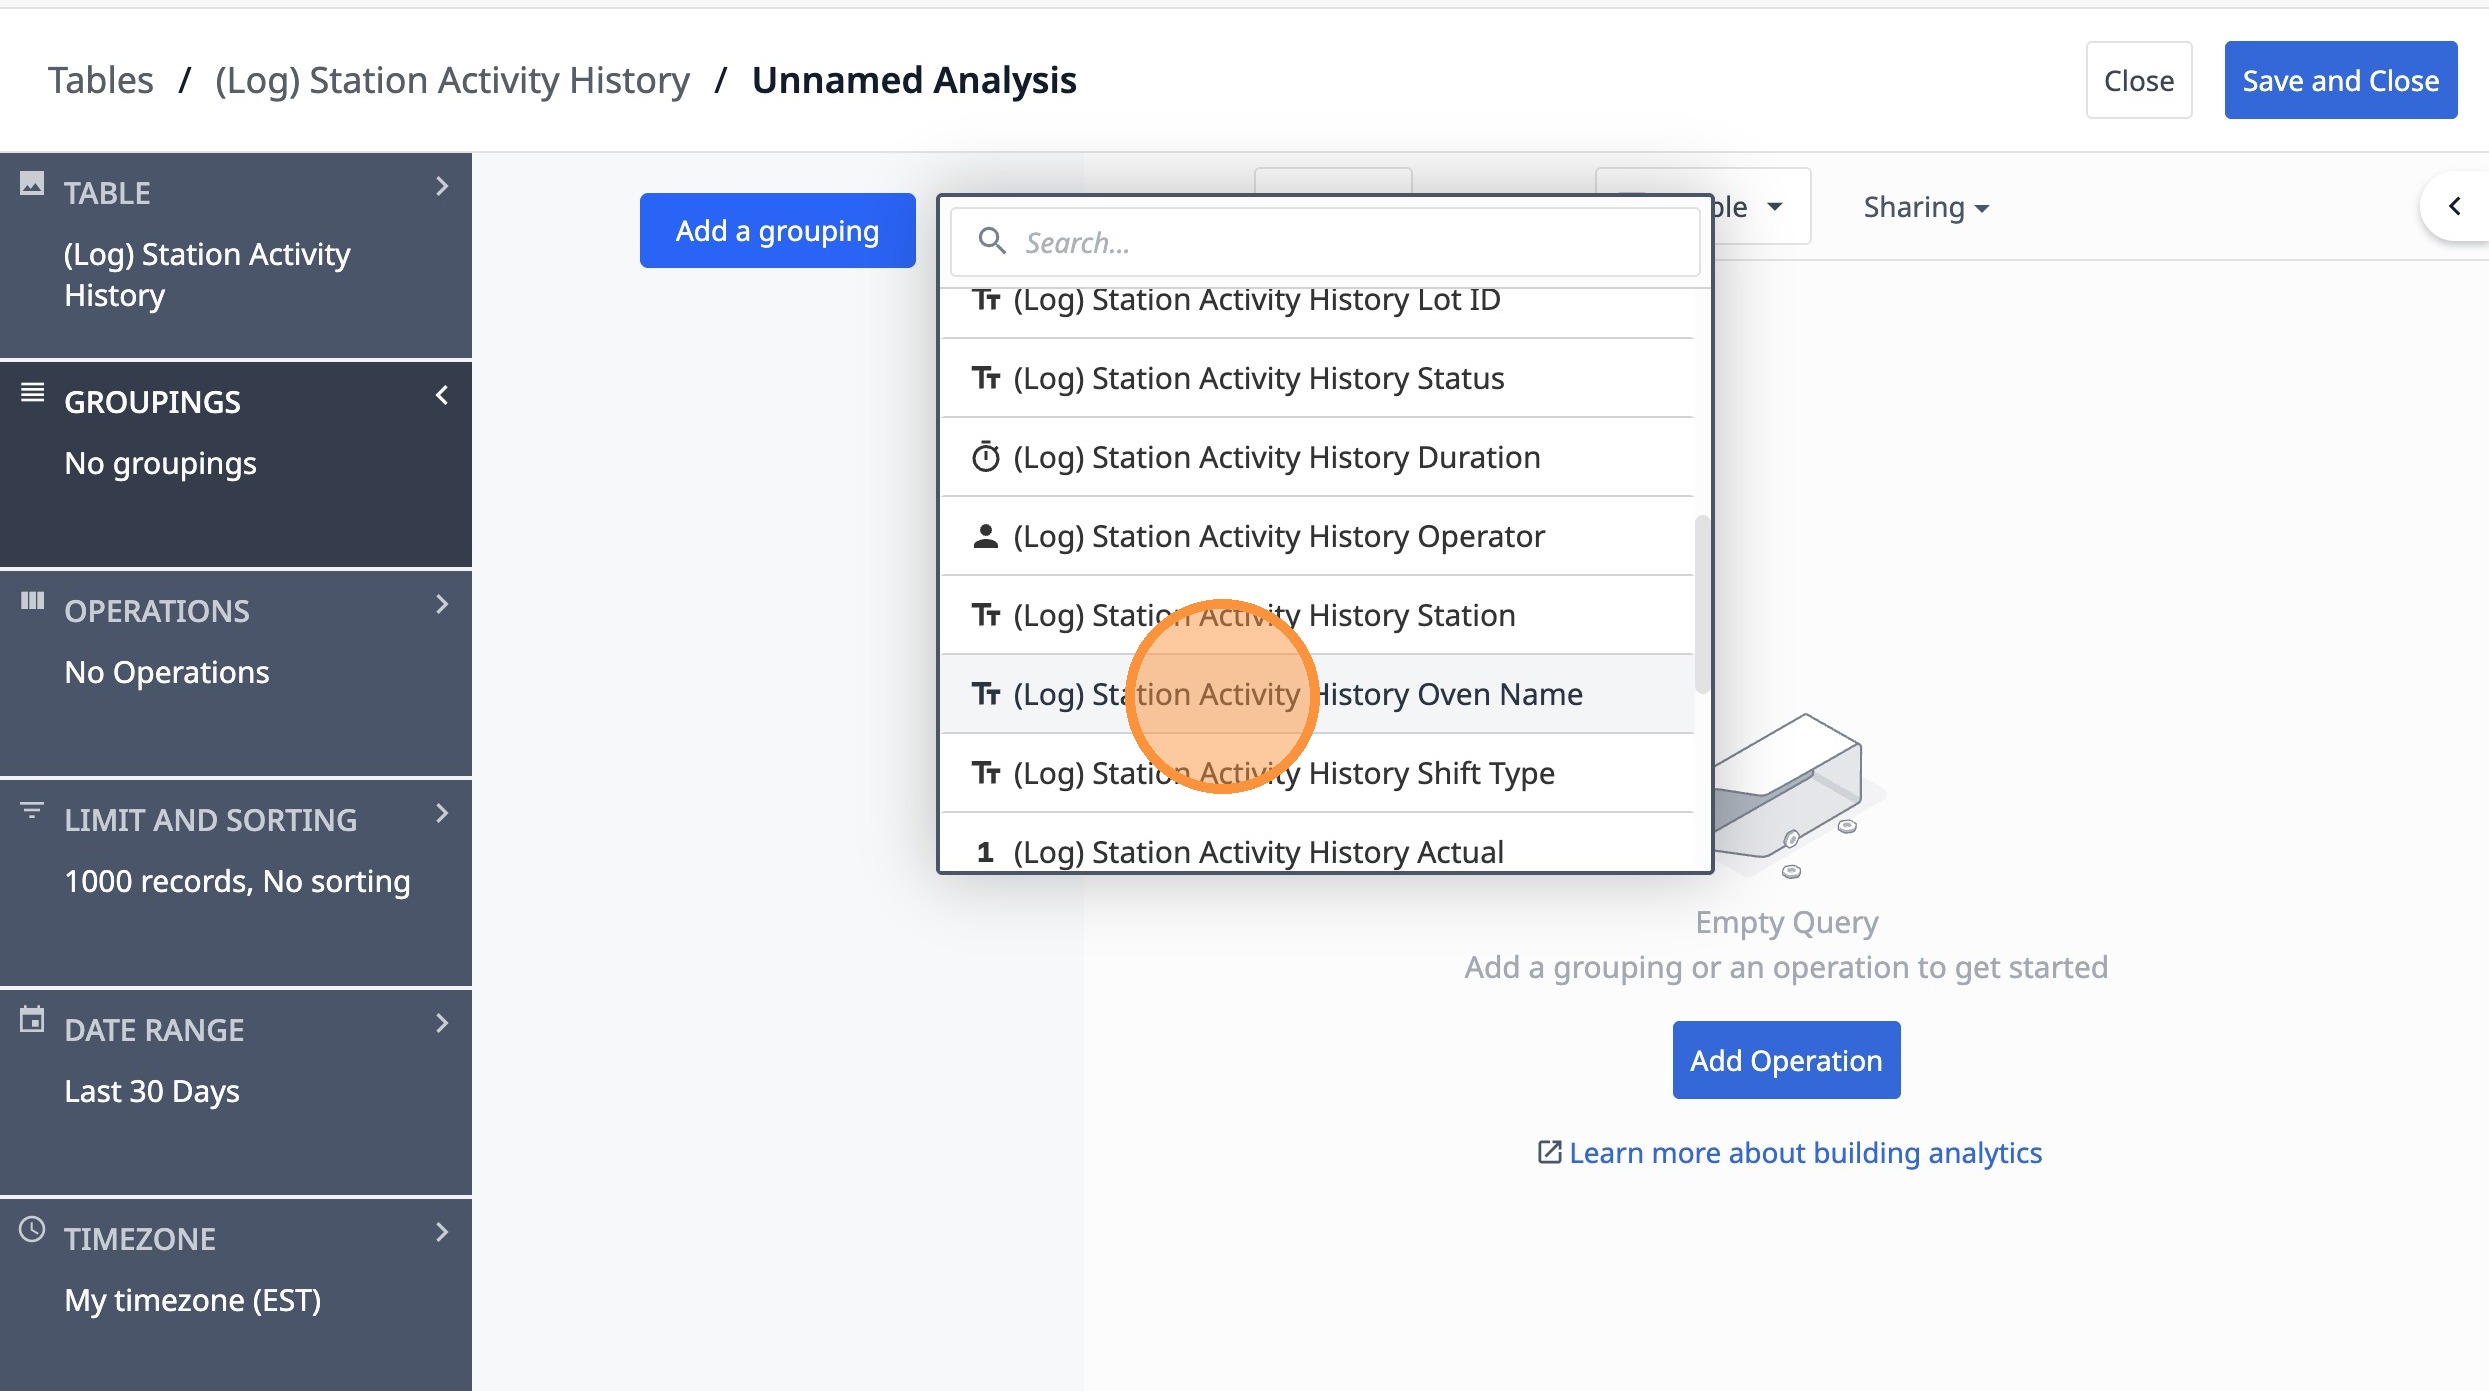
10. Click "(Log) Station Activity History Oven Name"
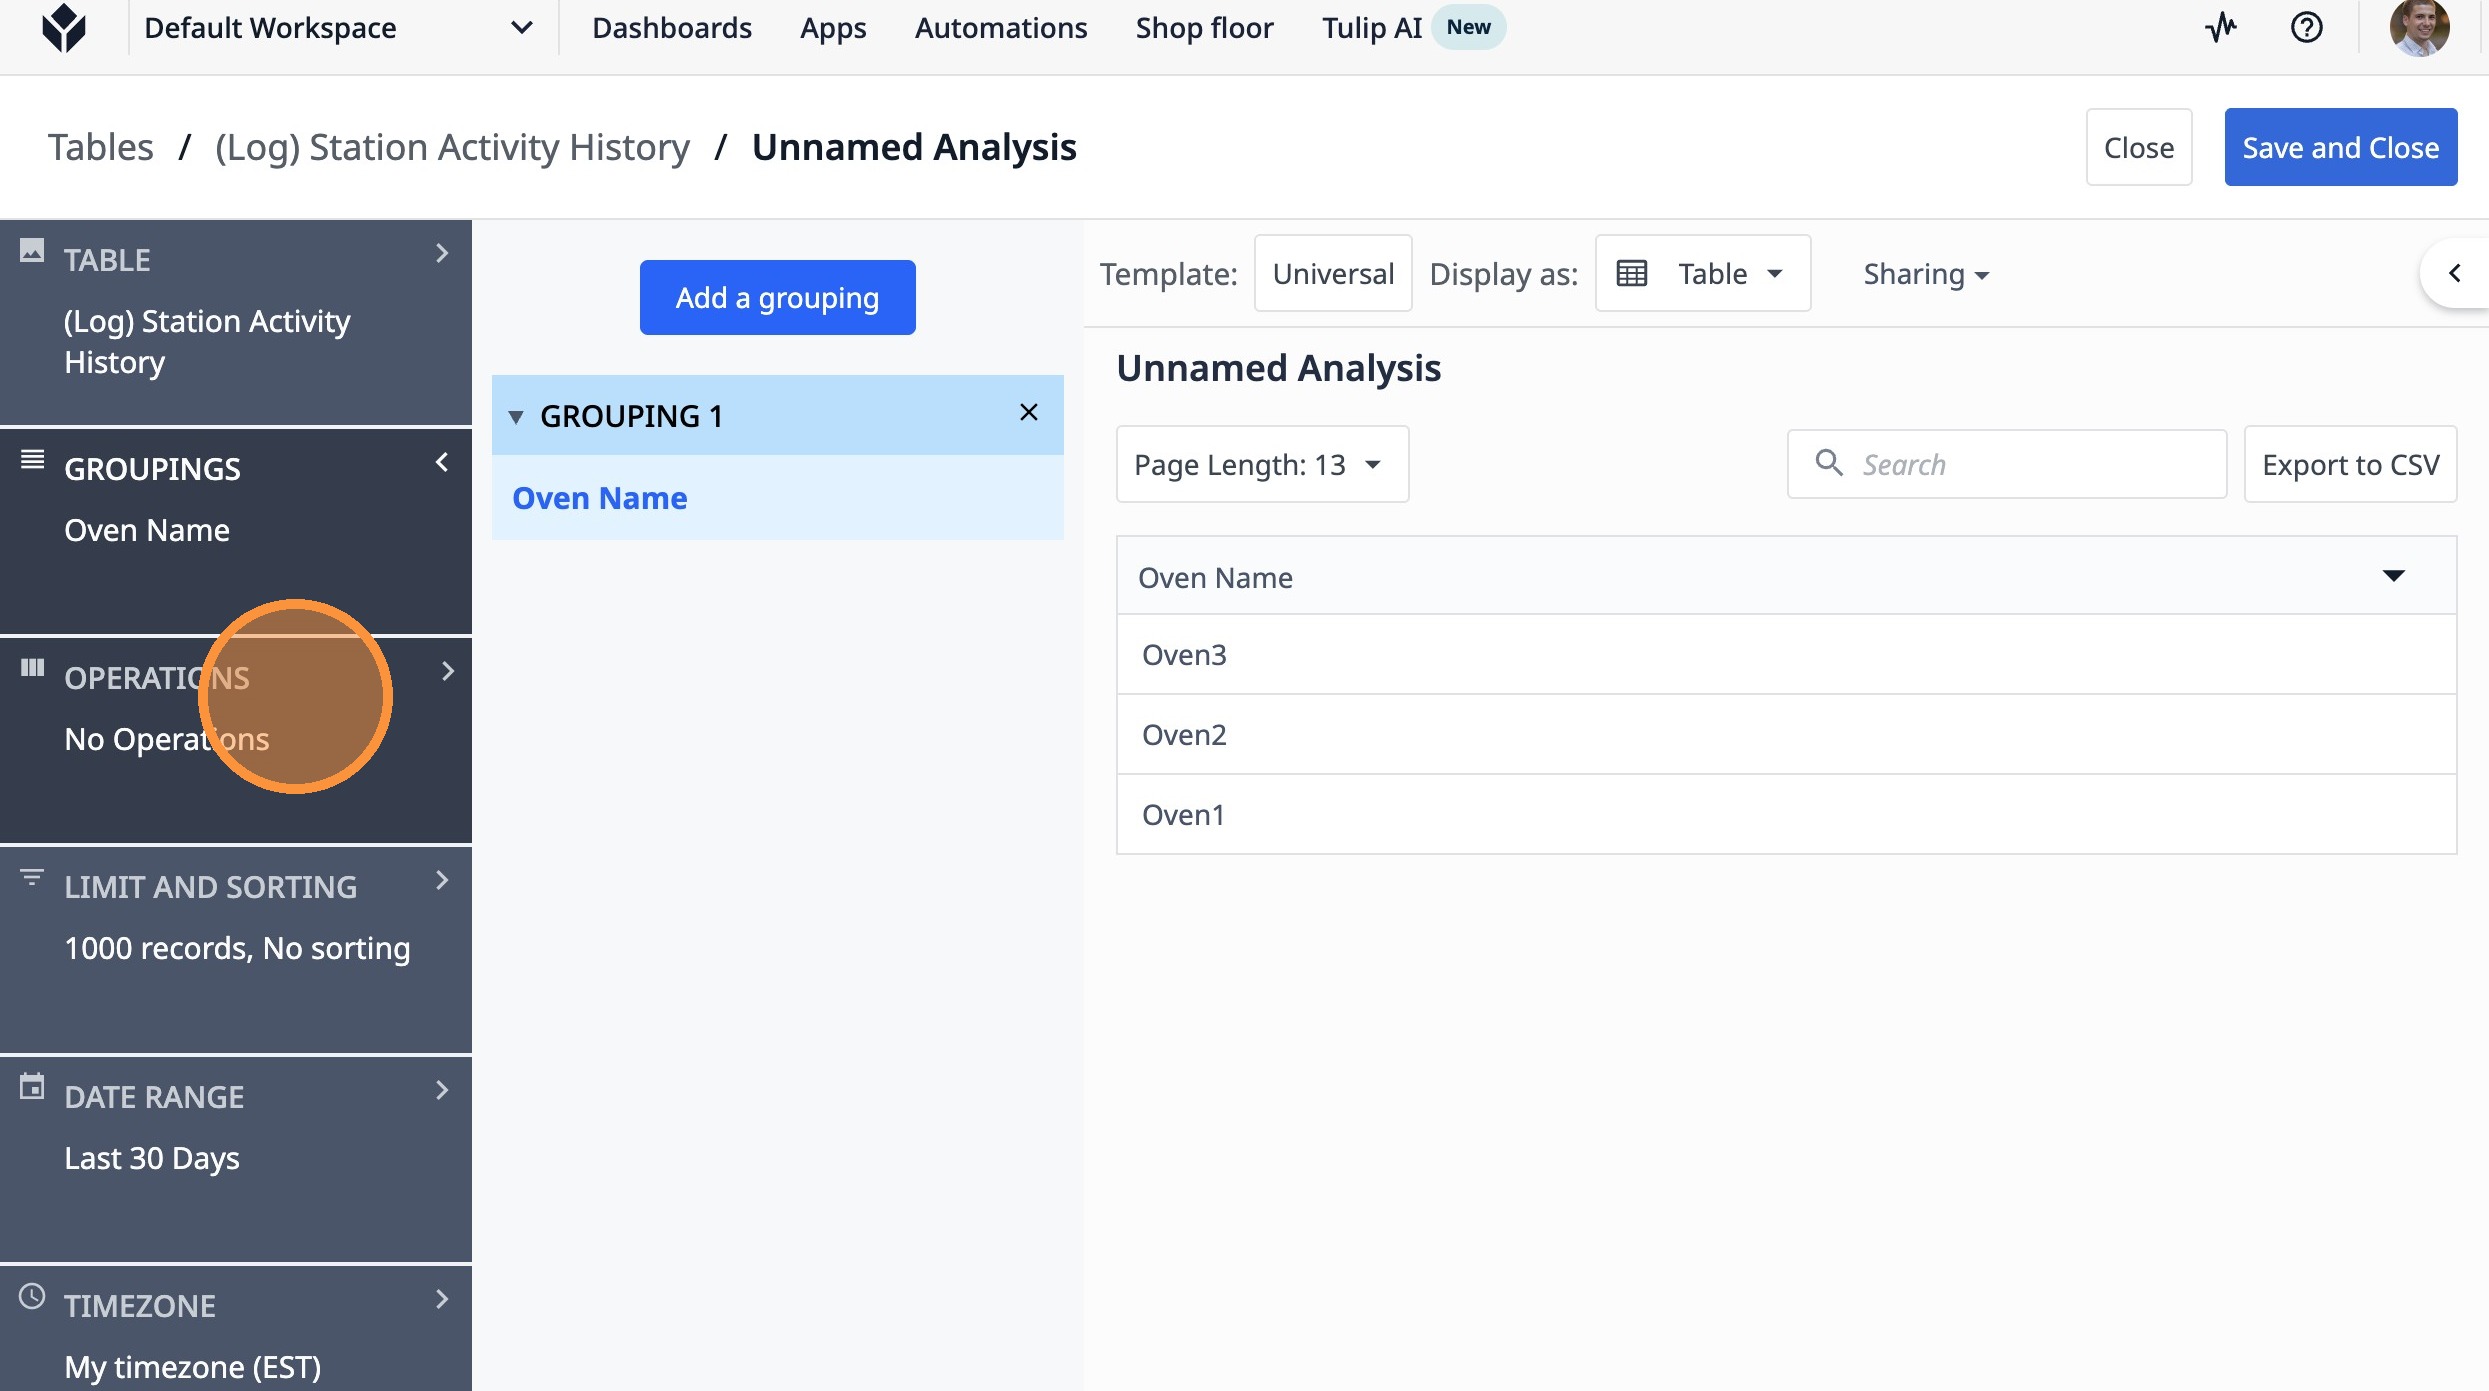
11. Click "operations"
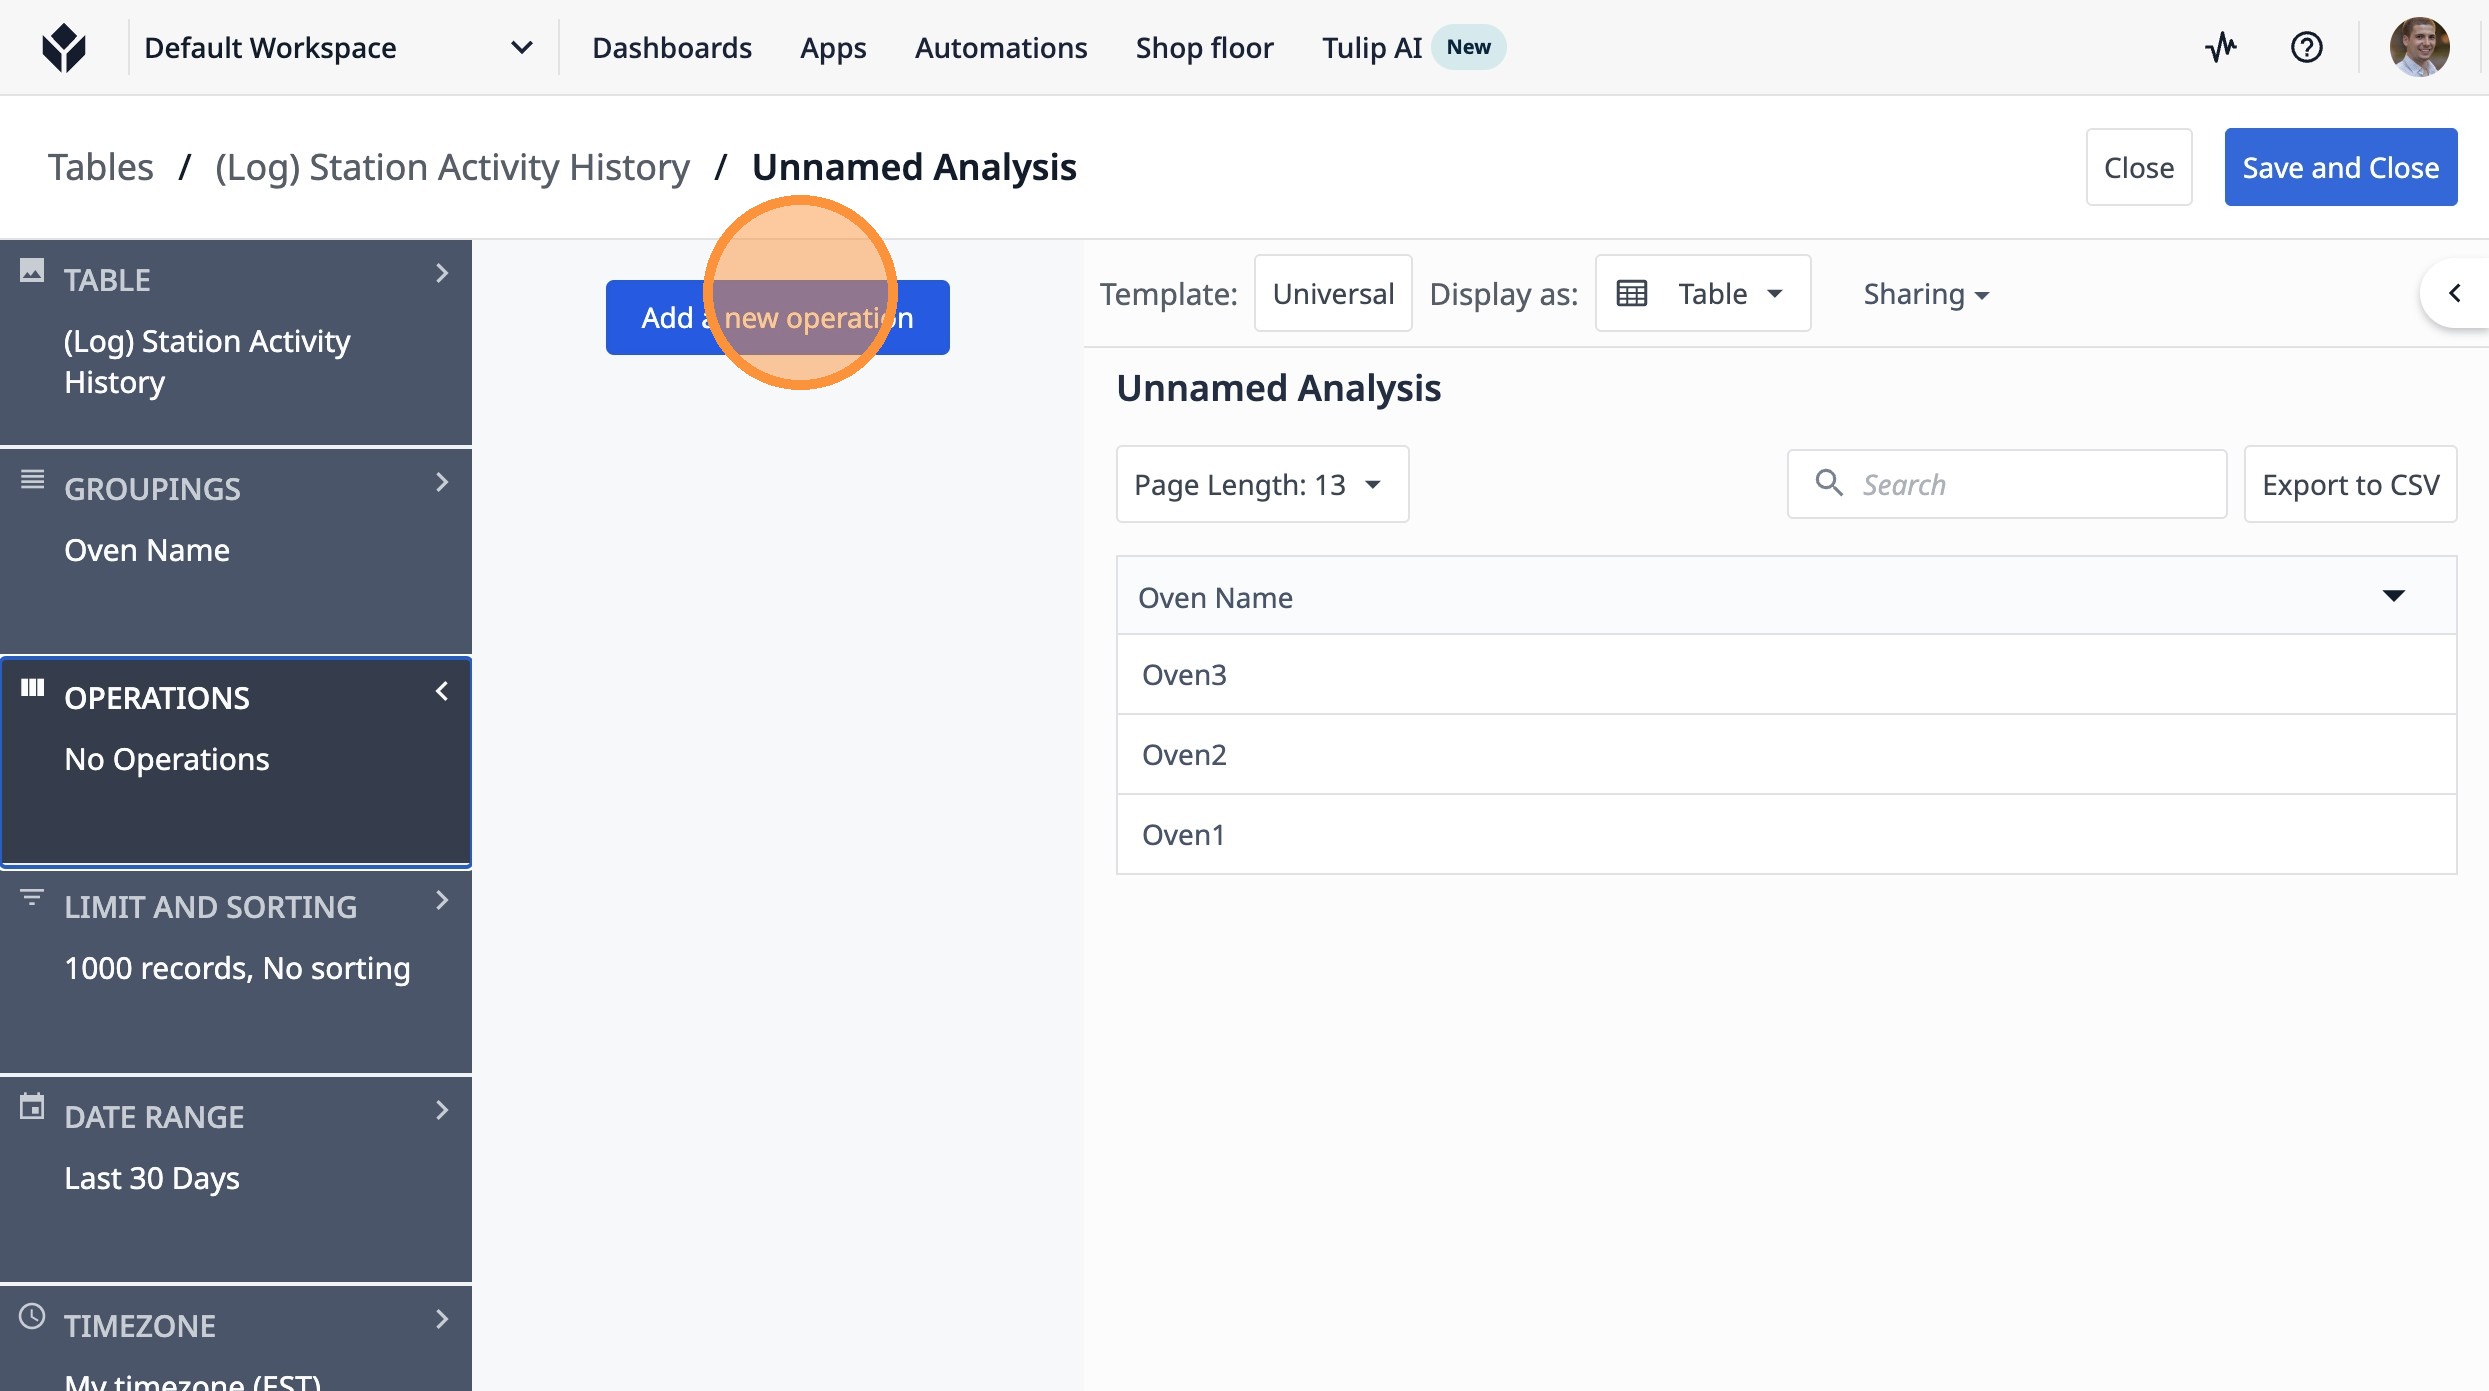
12. Click "Add a new operation"
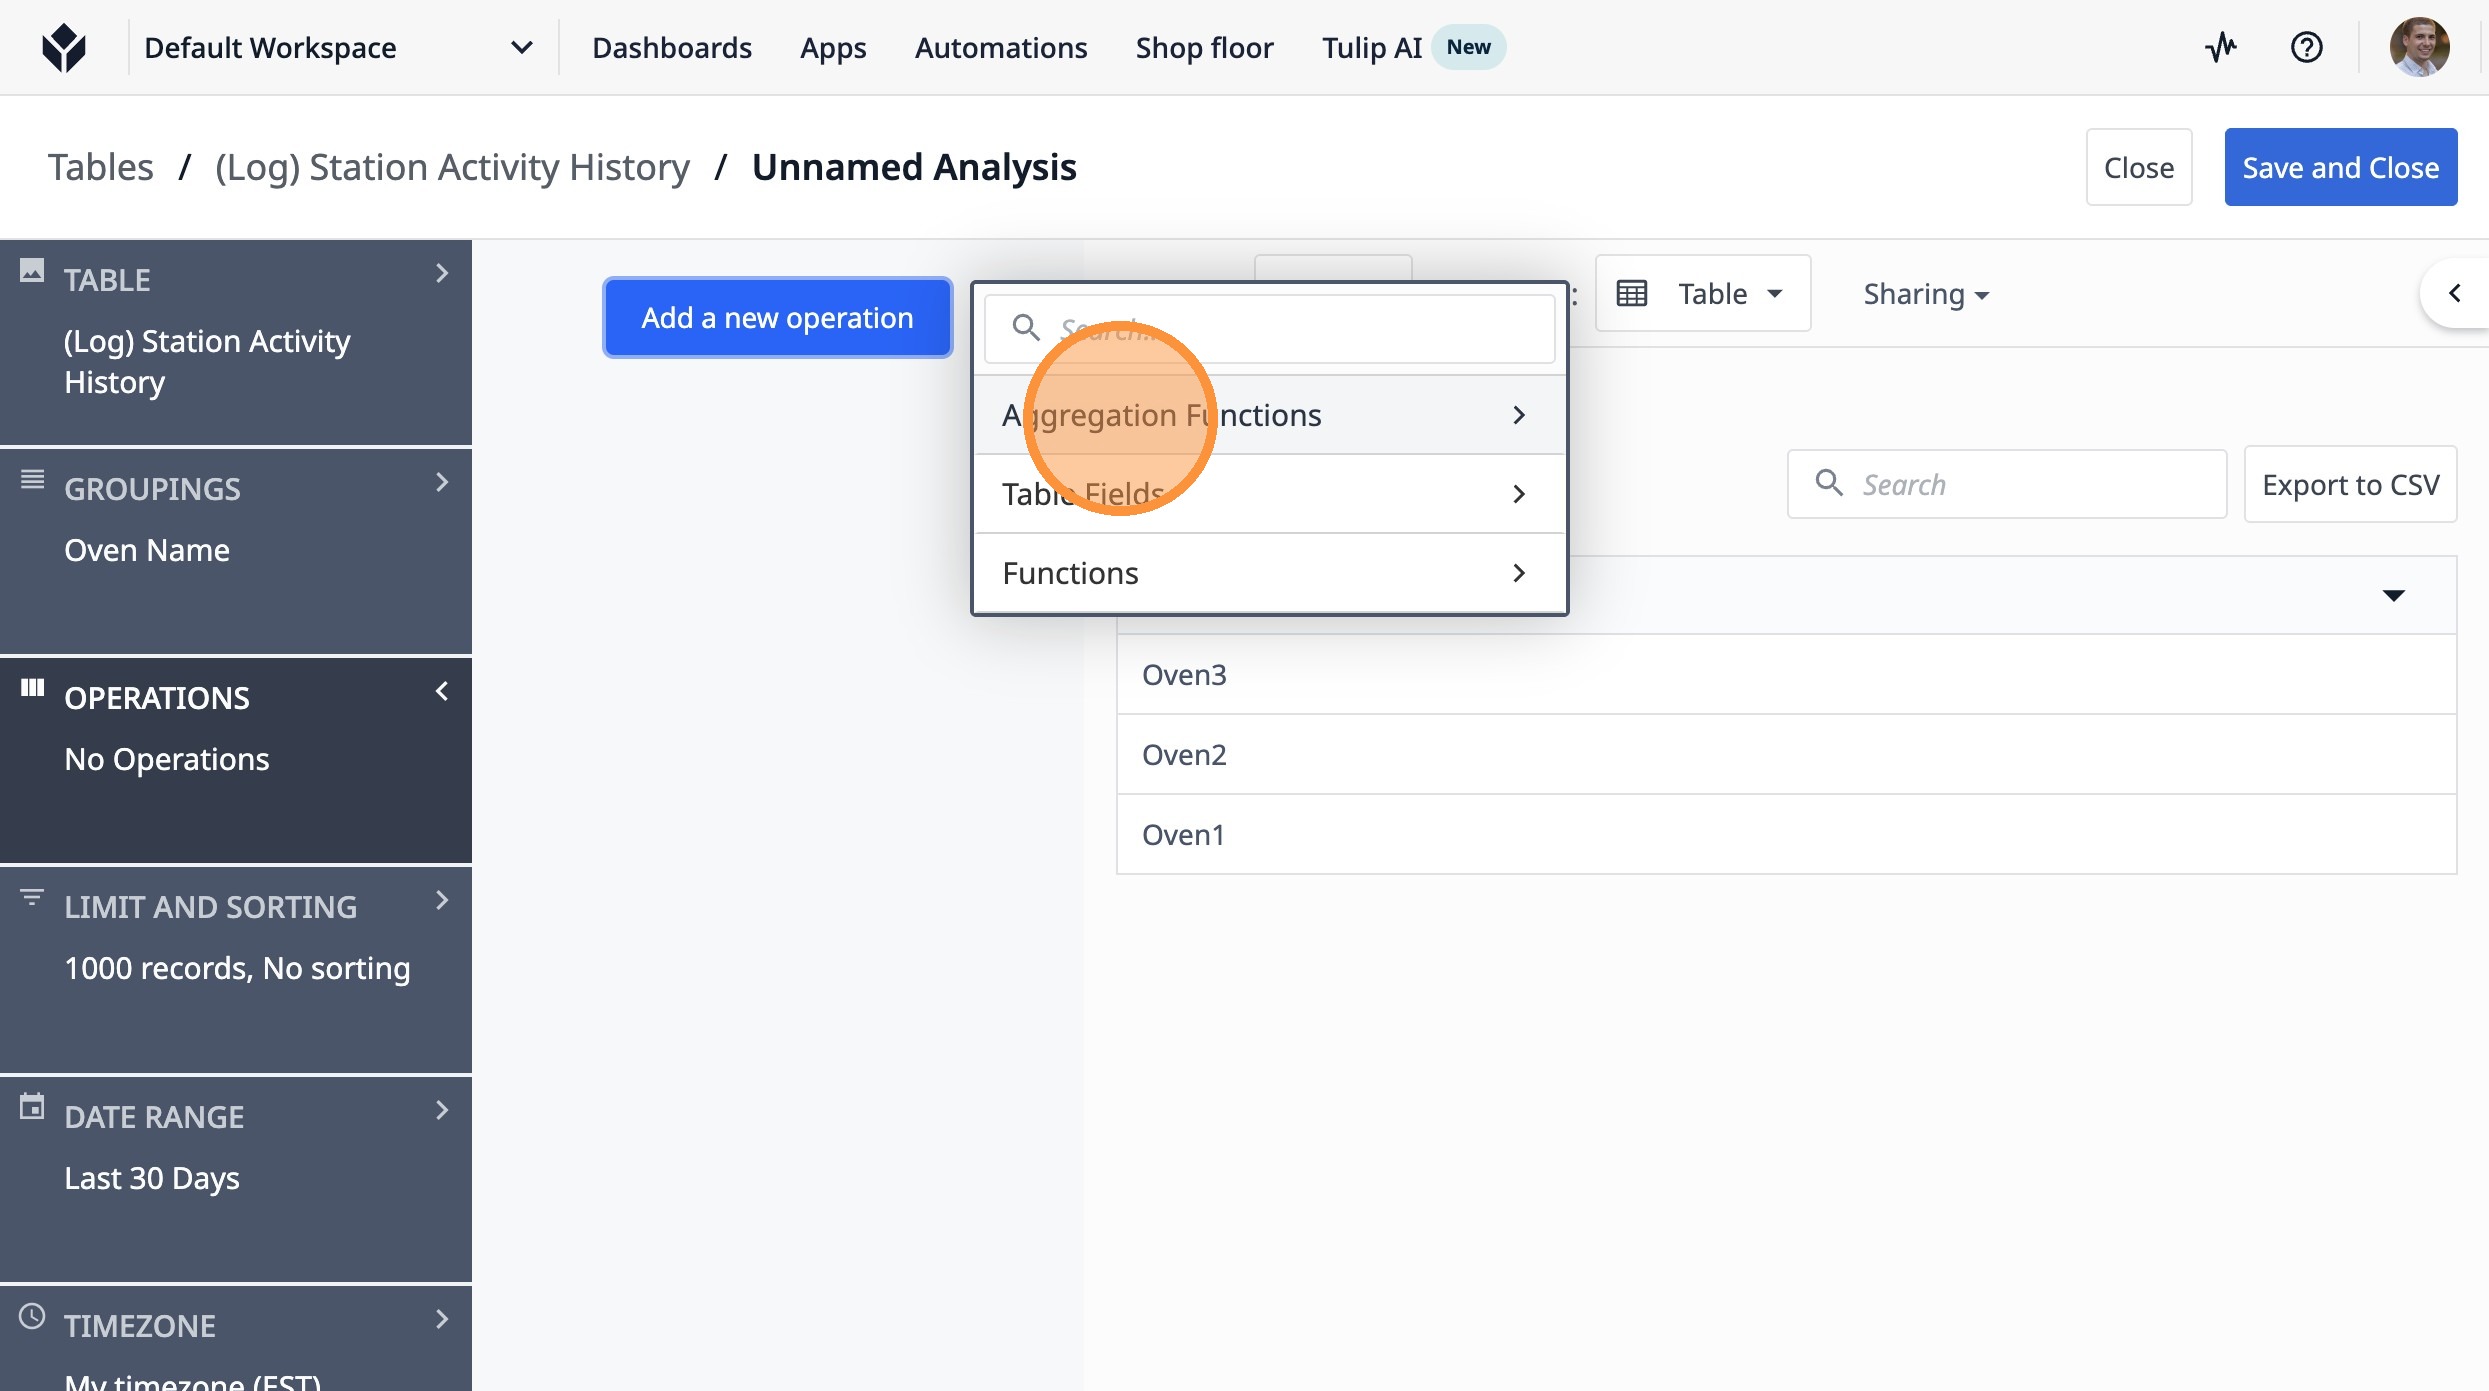
13. Click "Aggregation Functions"
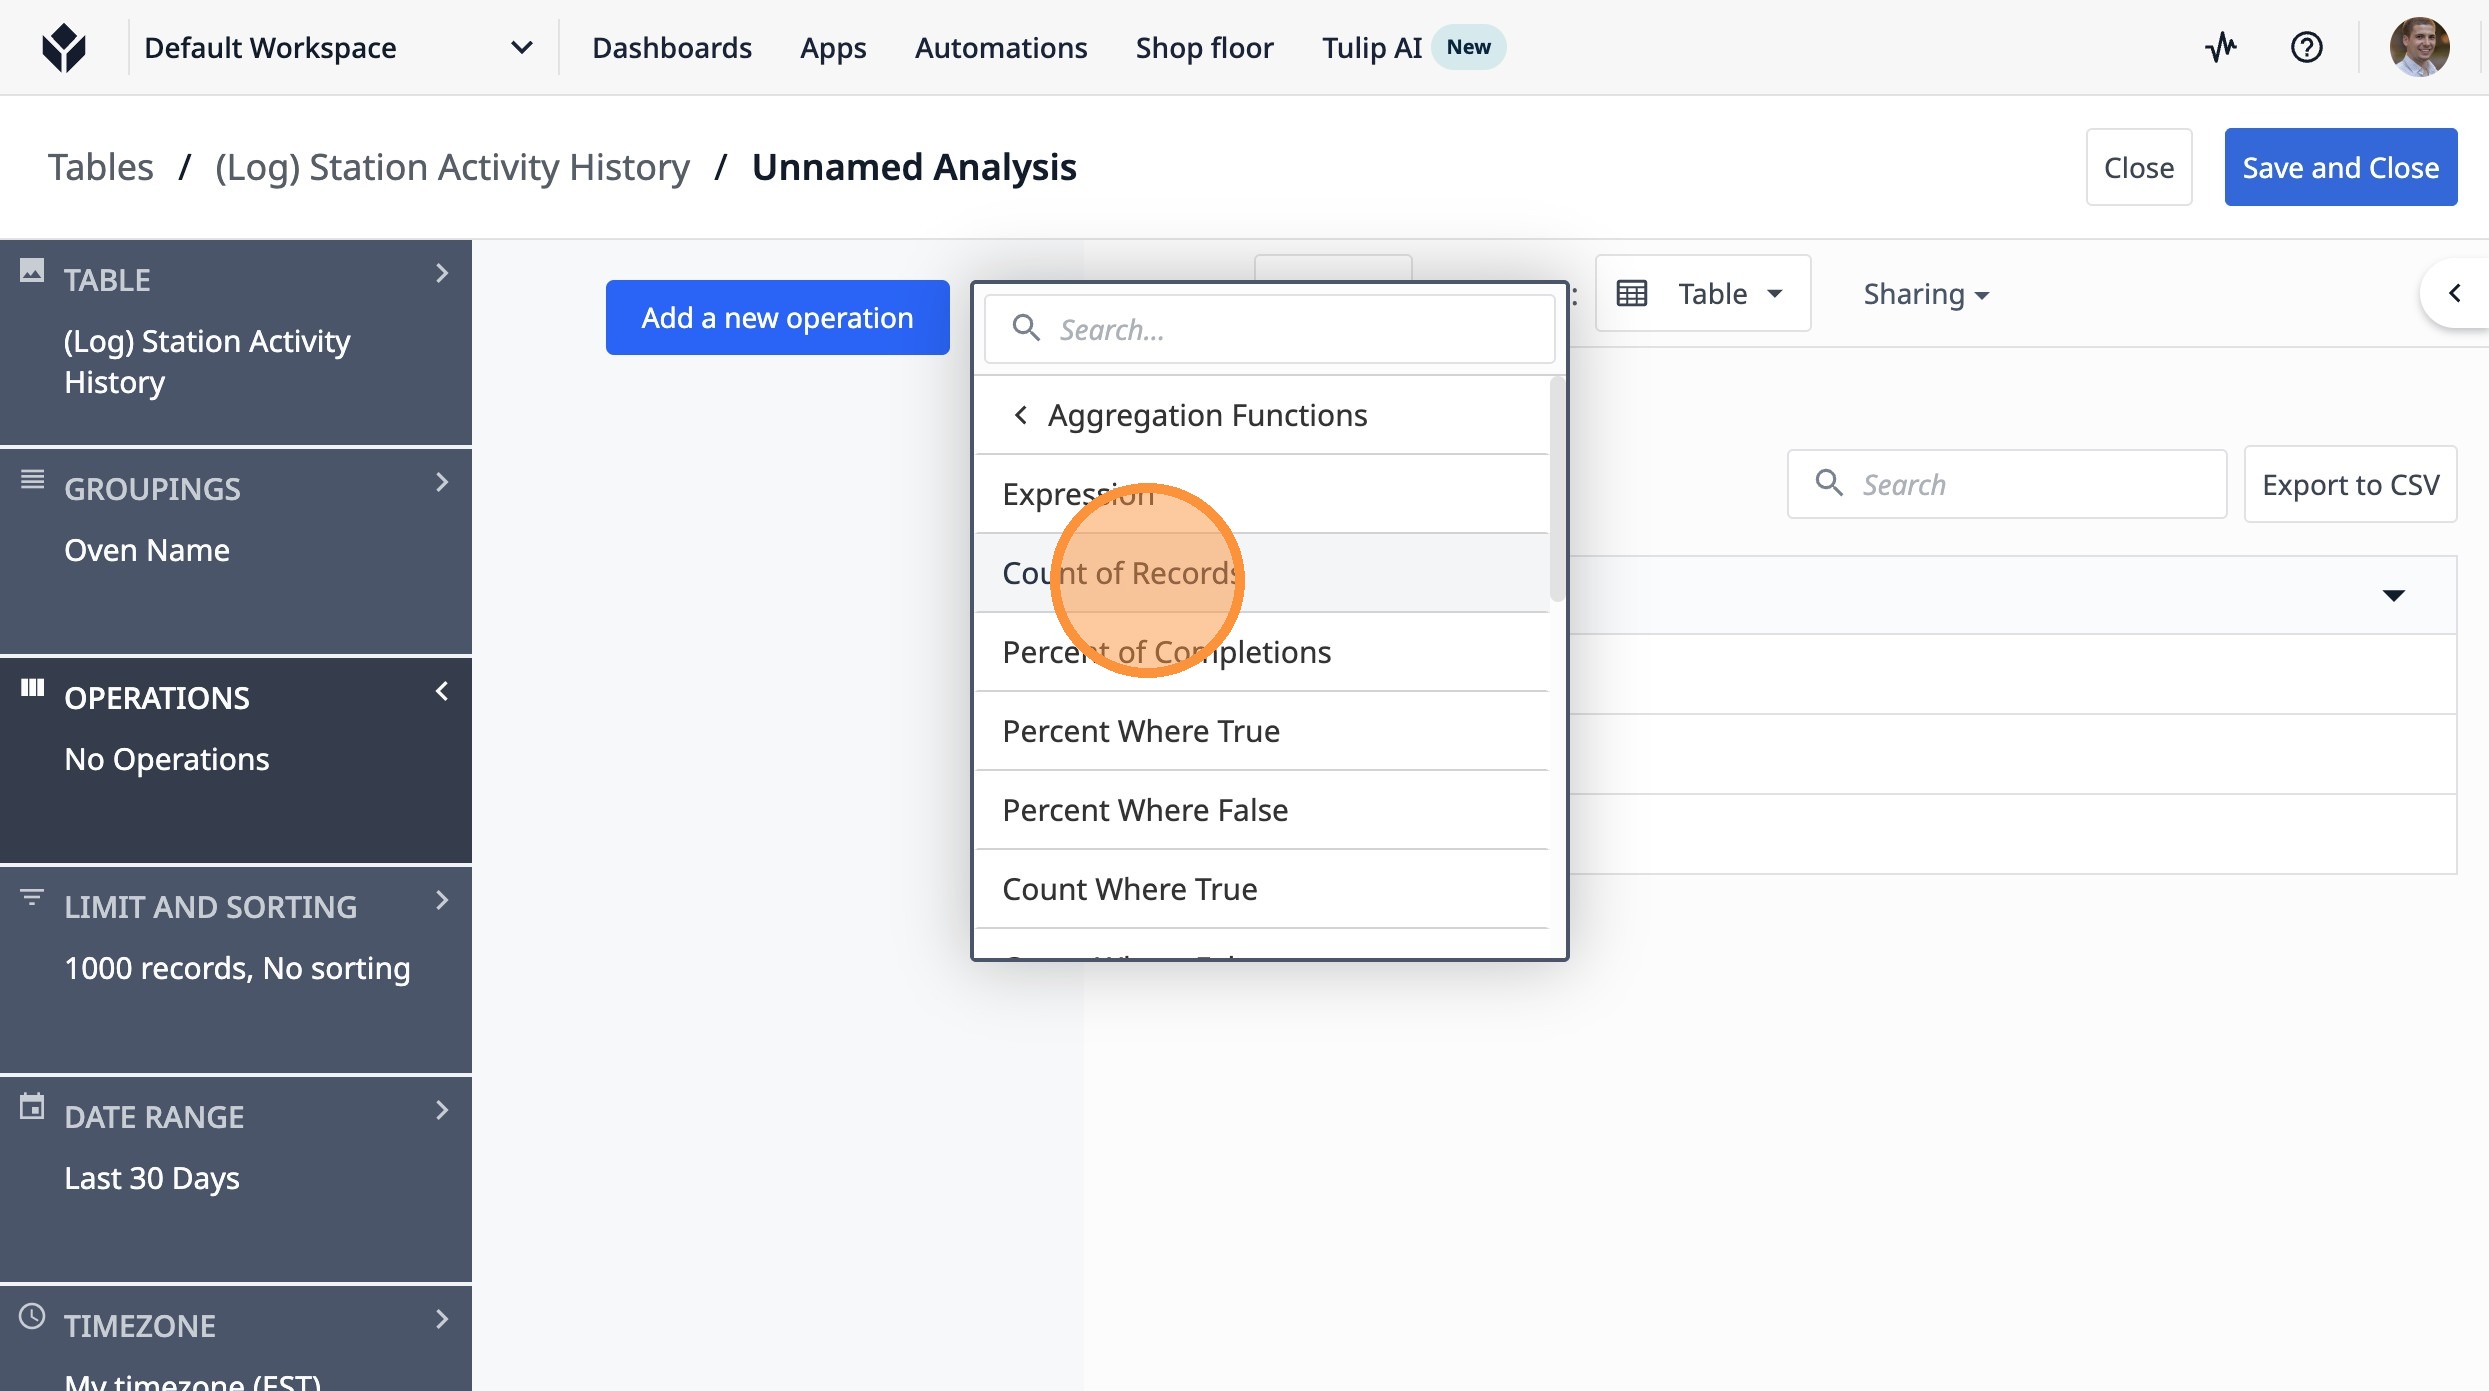
14. Click "Count of Records"
15. Click "filters"
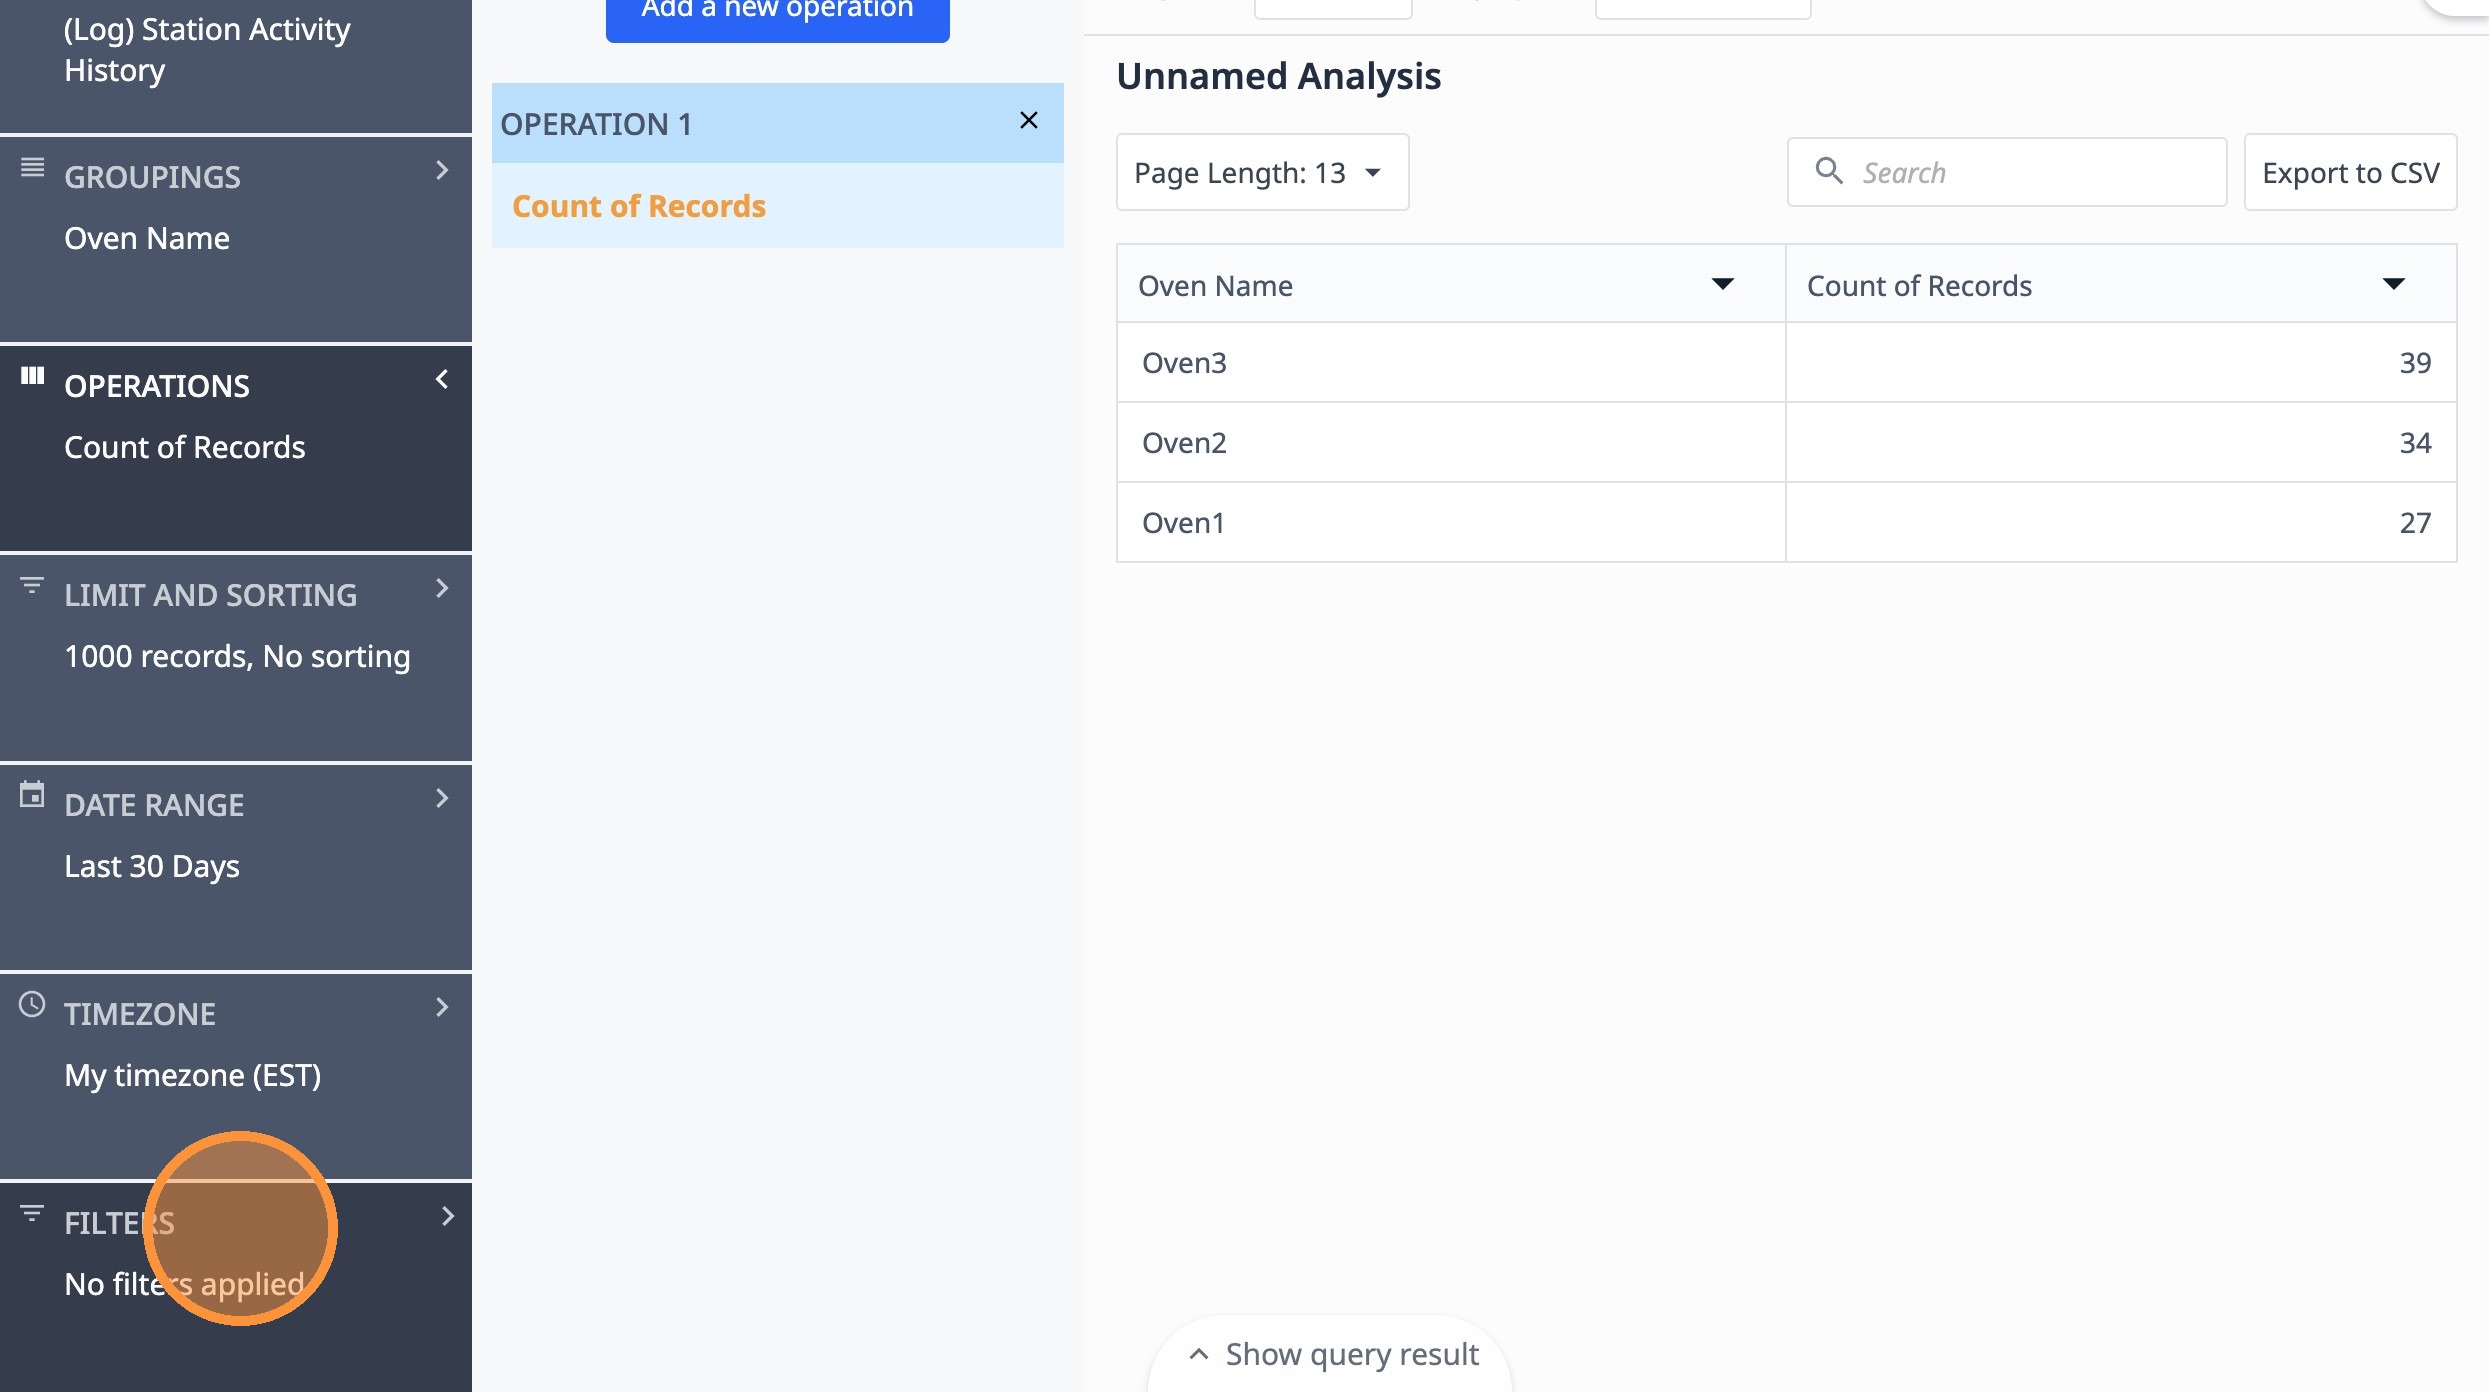
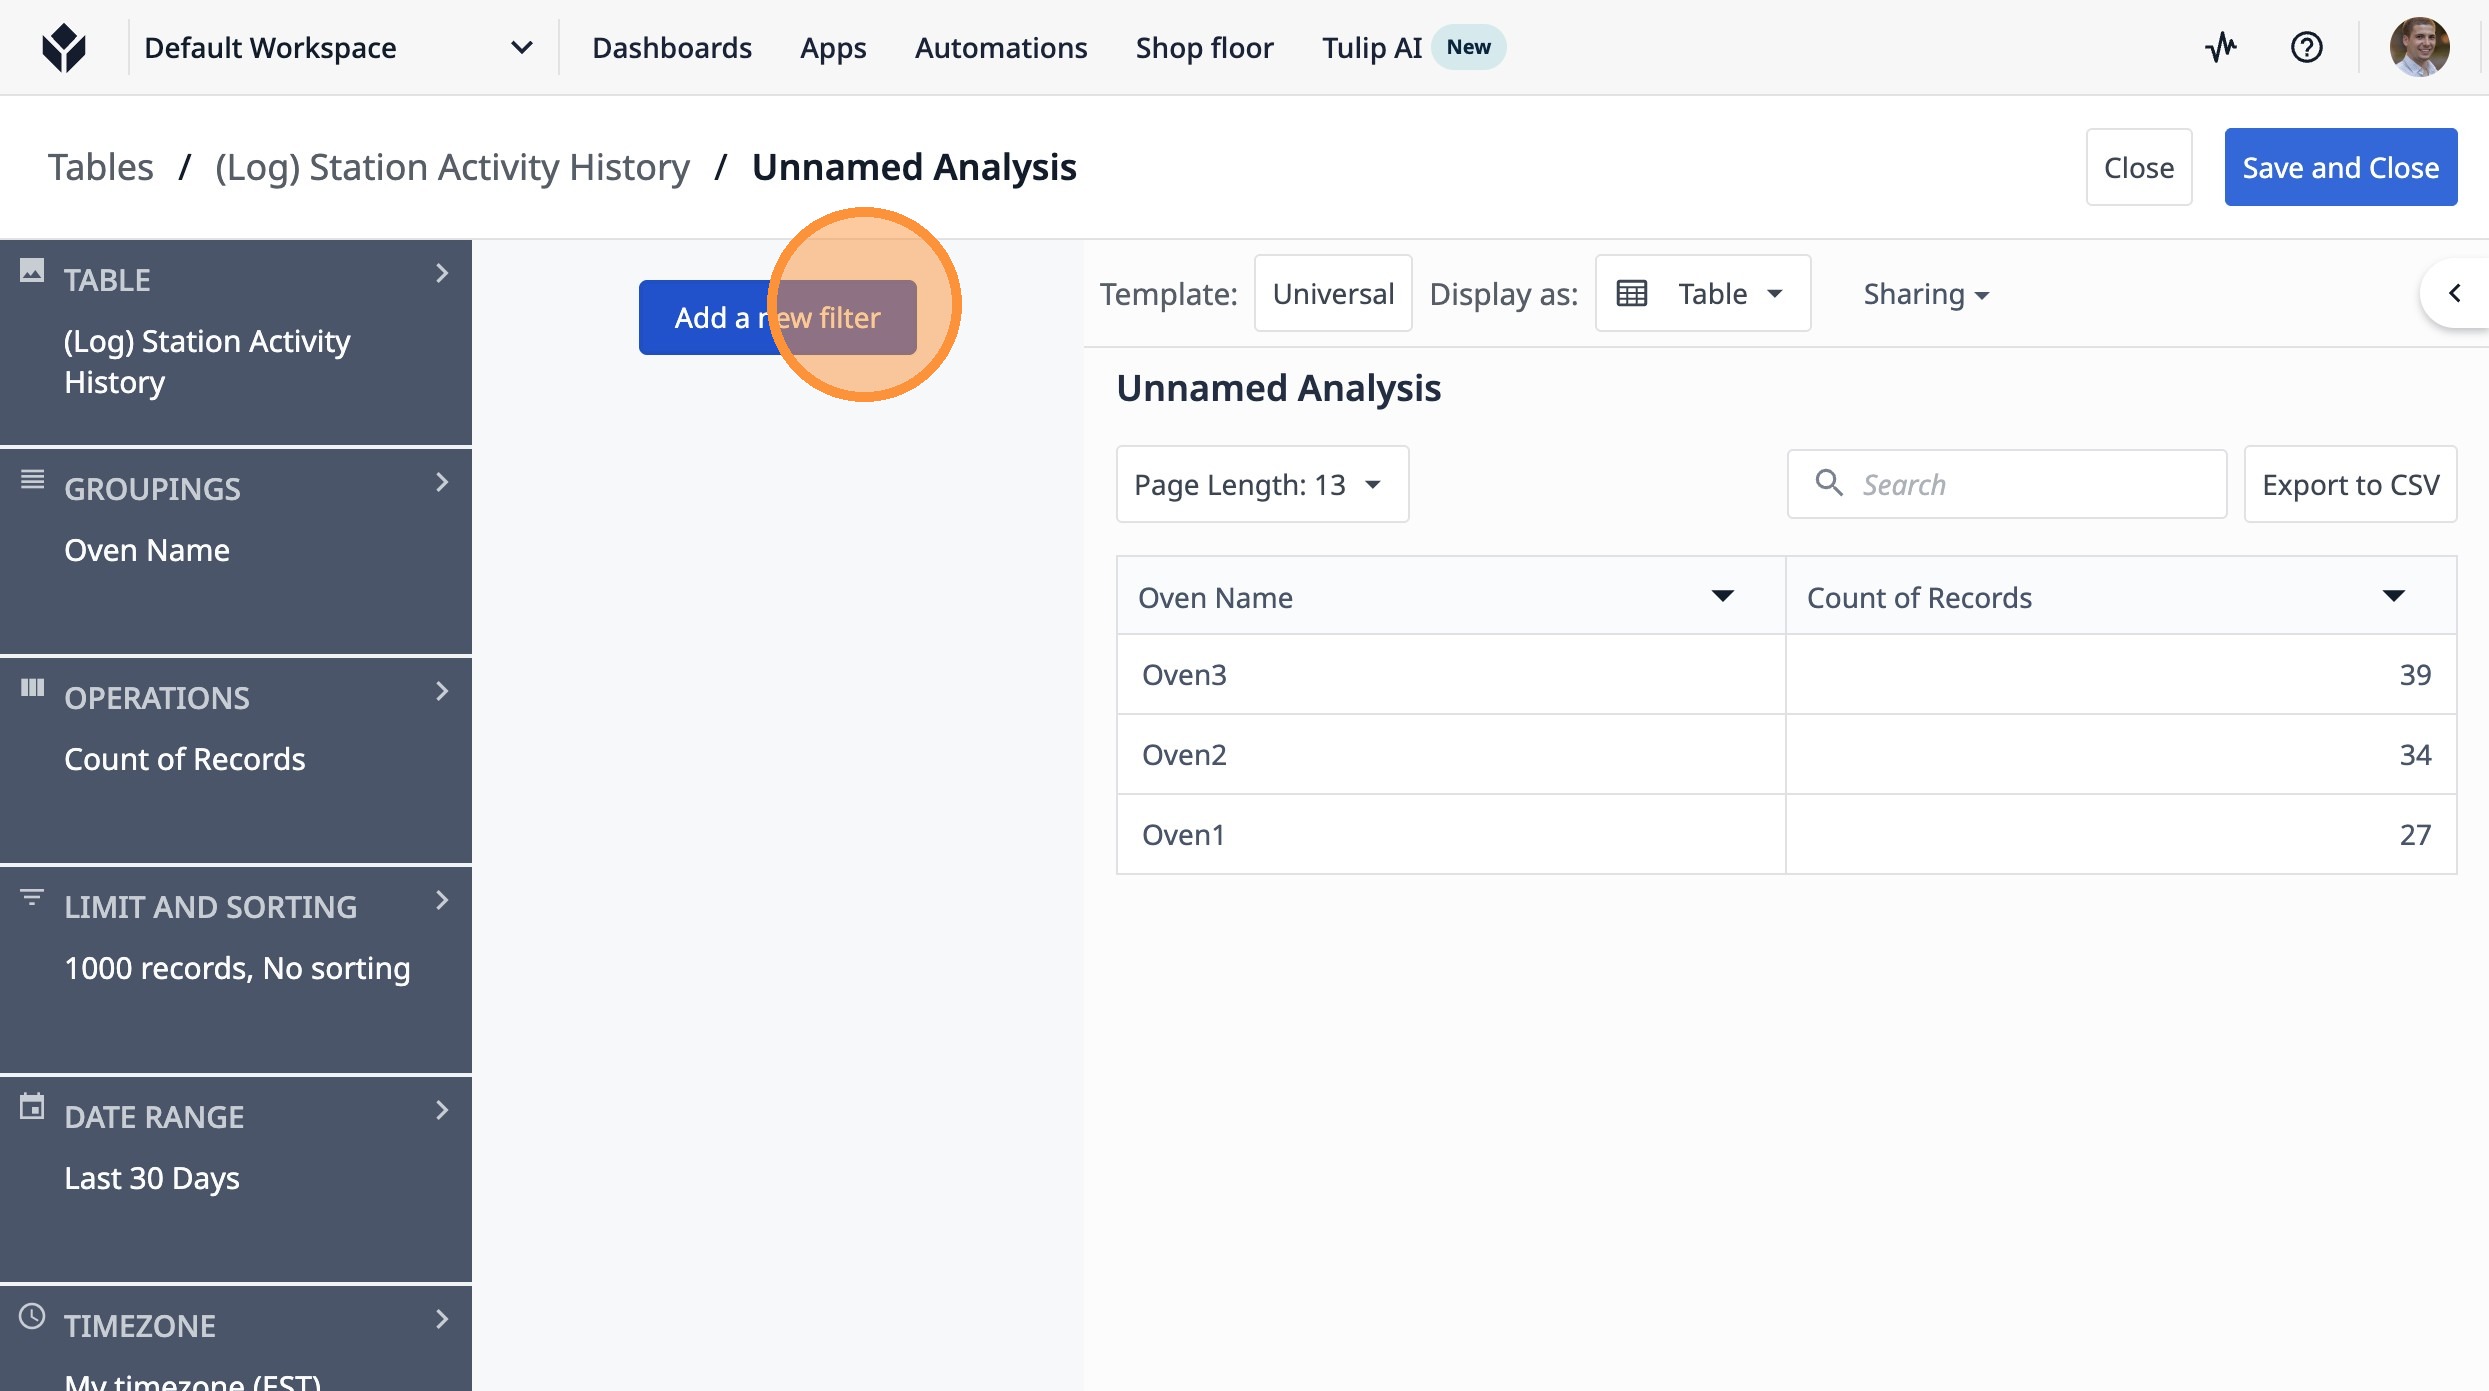
16. Click "Add a new filter"
Tip: This allows you to filter based on just completed lots by oven, ignoring ones that have been started but not completed
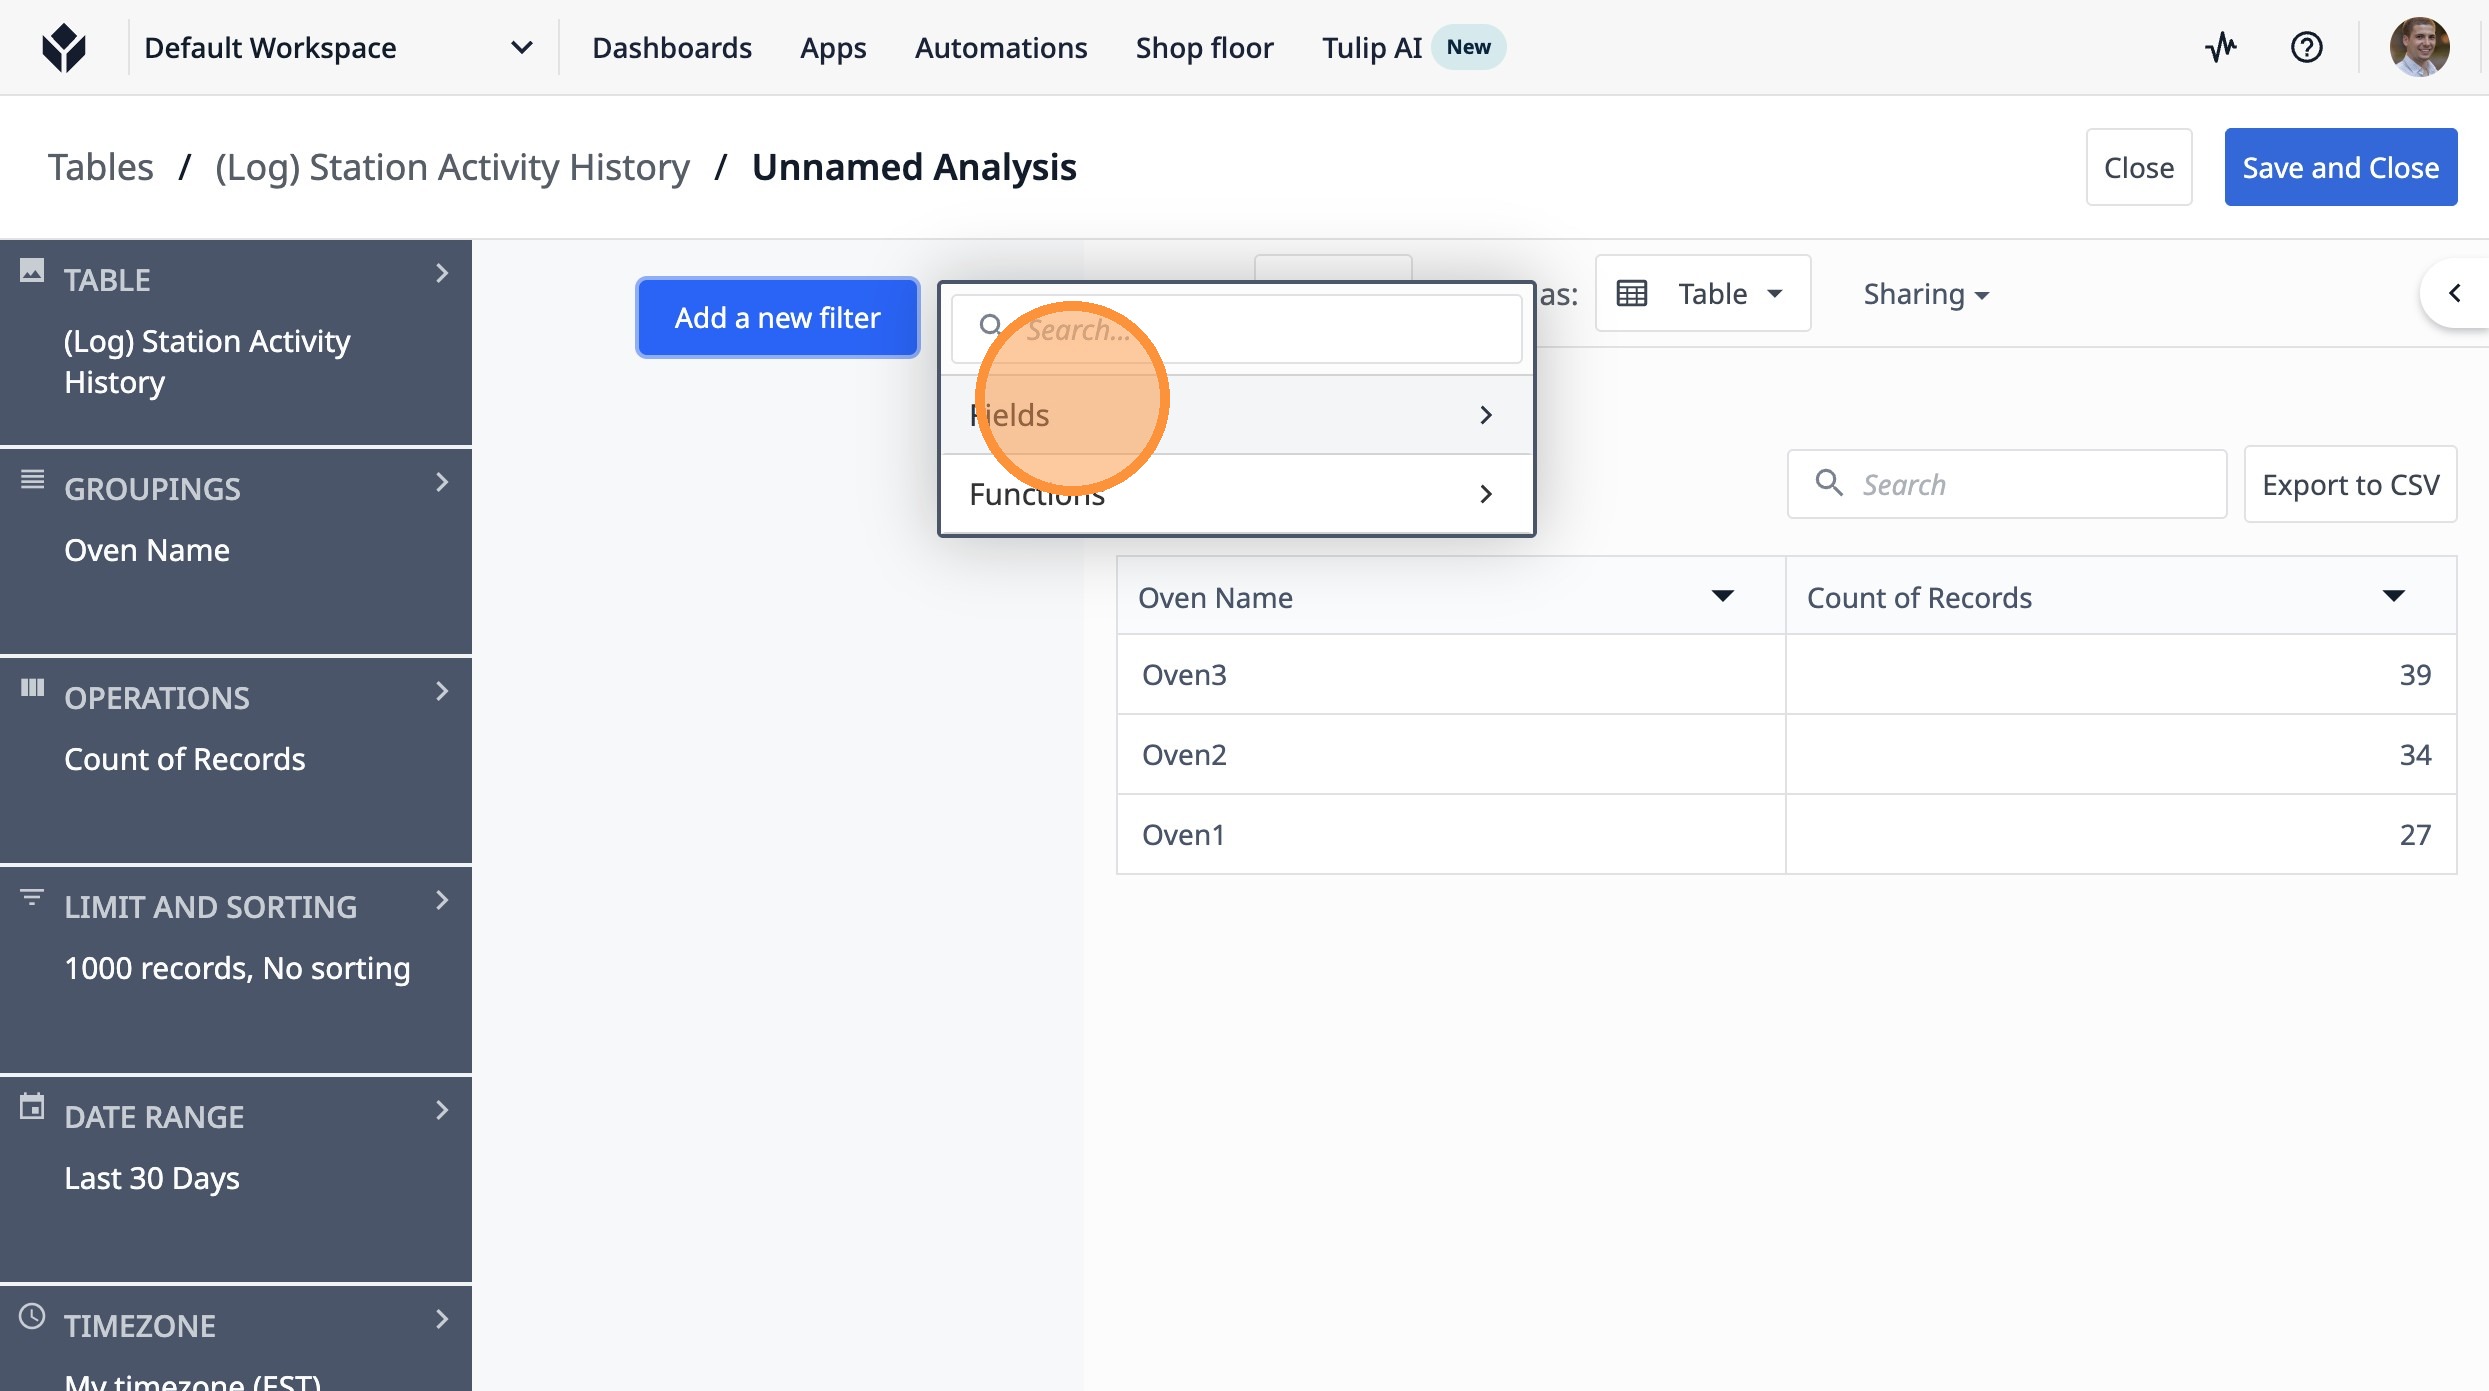
17. Click "Fields"
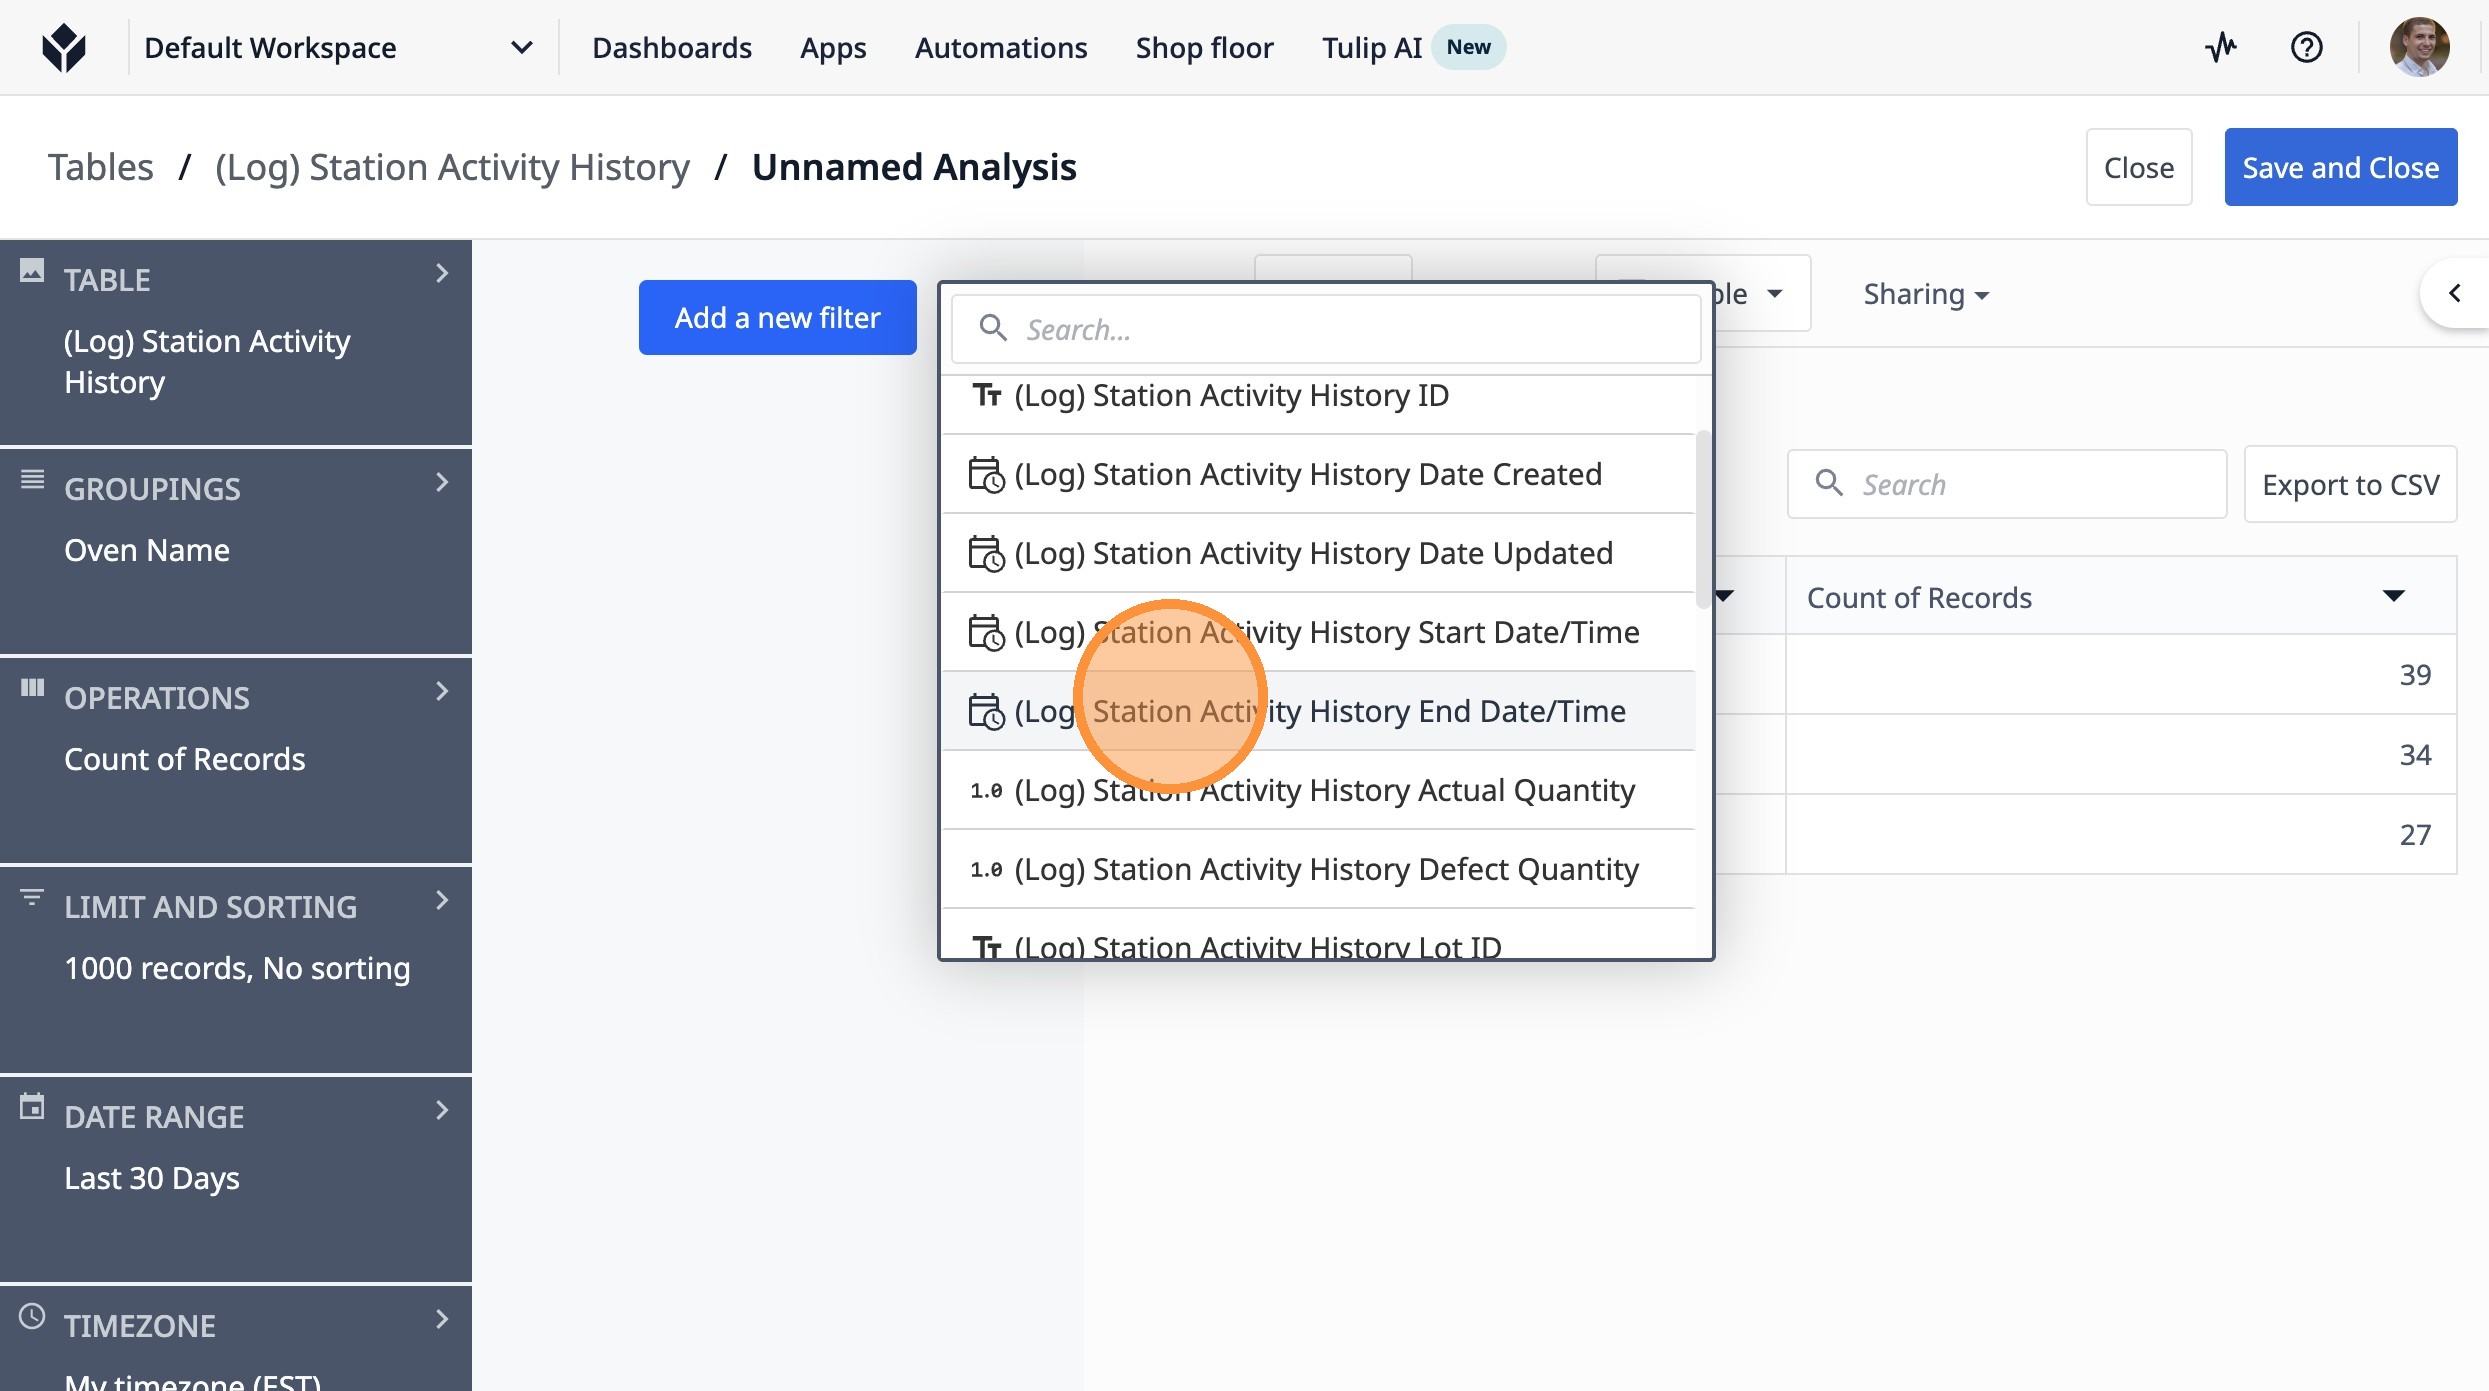
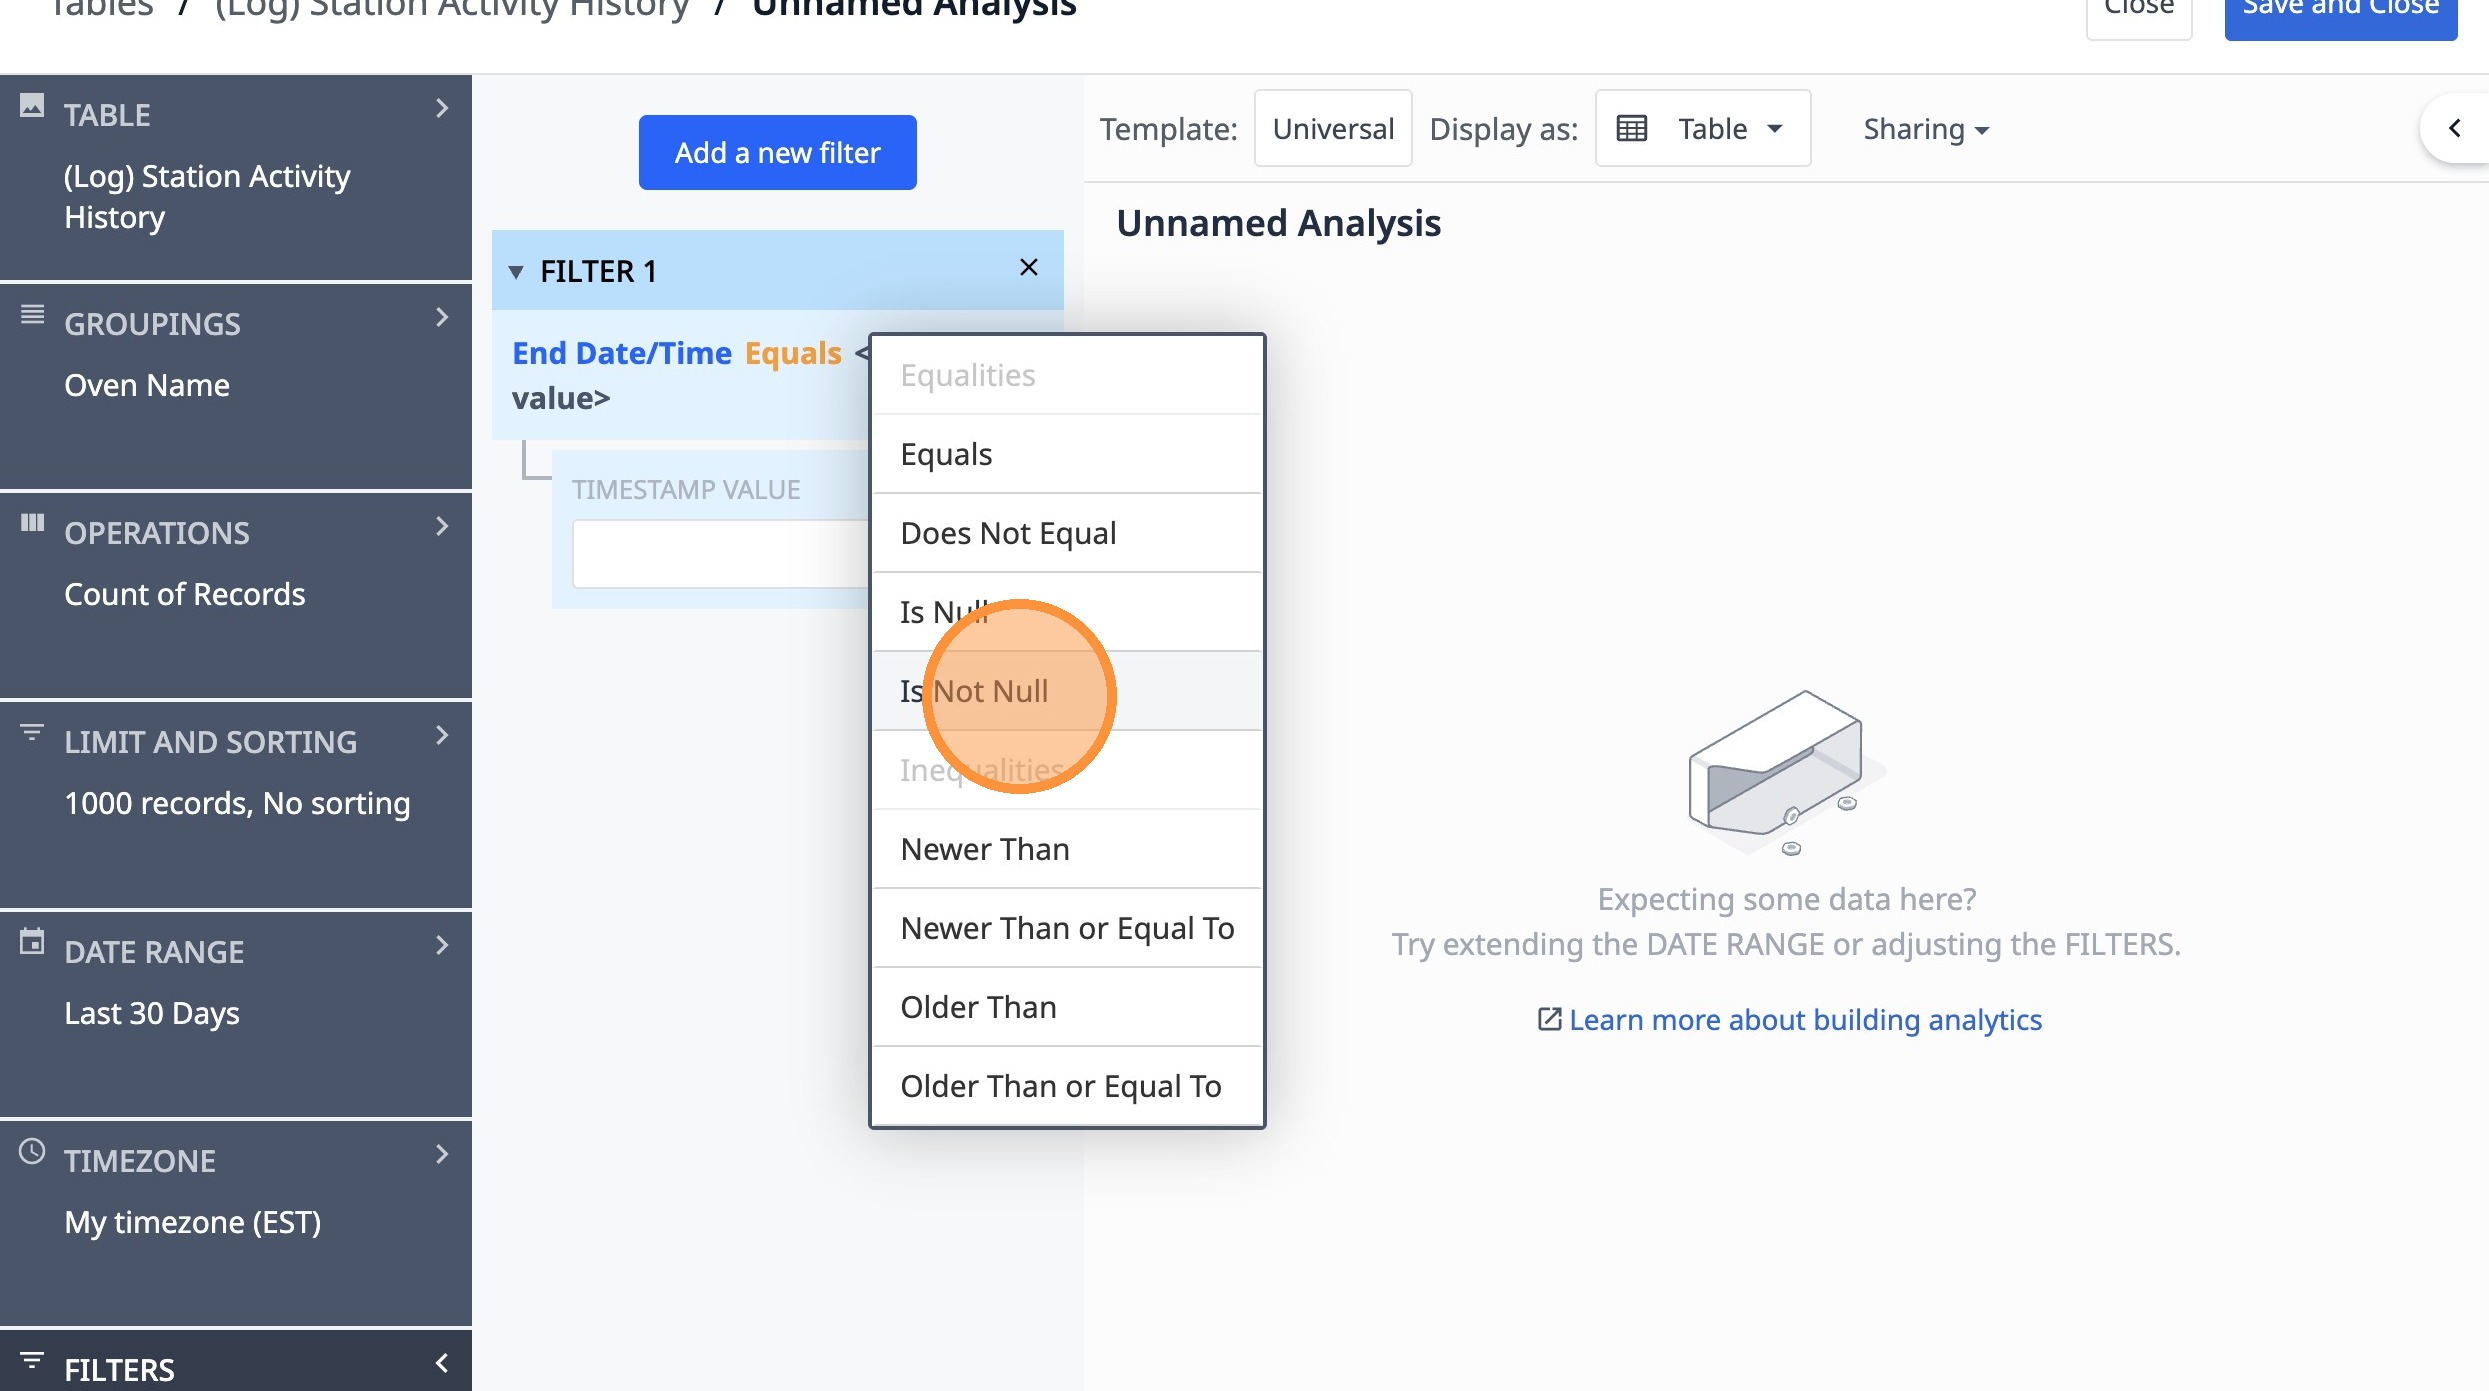
18. Click "(Log) Station Activity History End Date/Time"
19. Click "Equals"
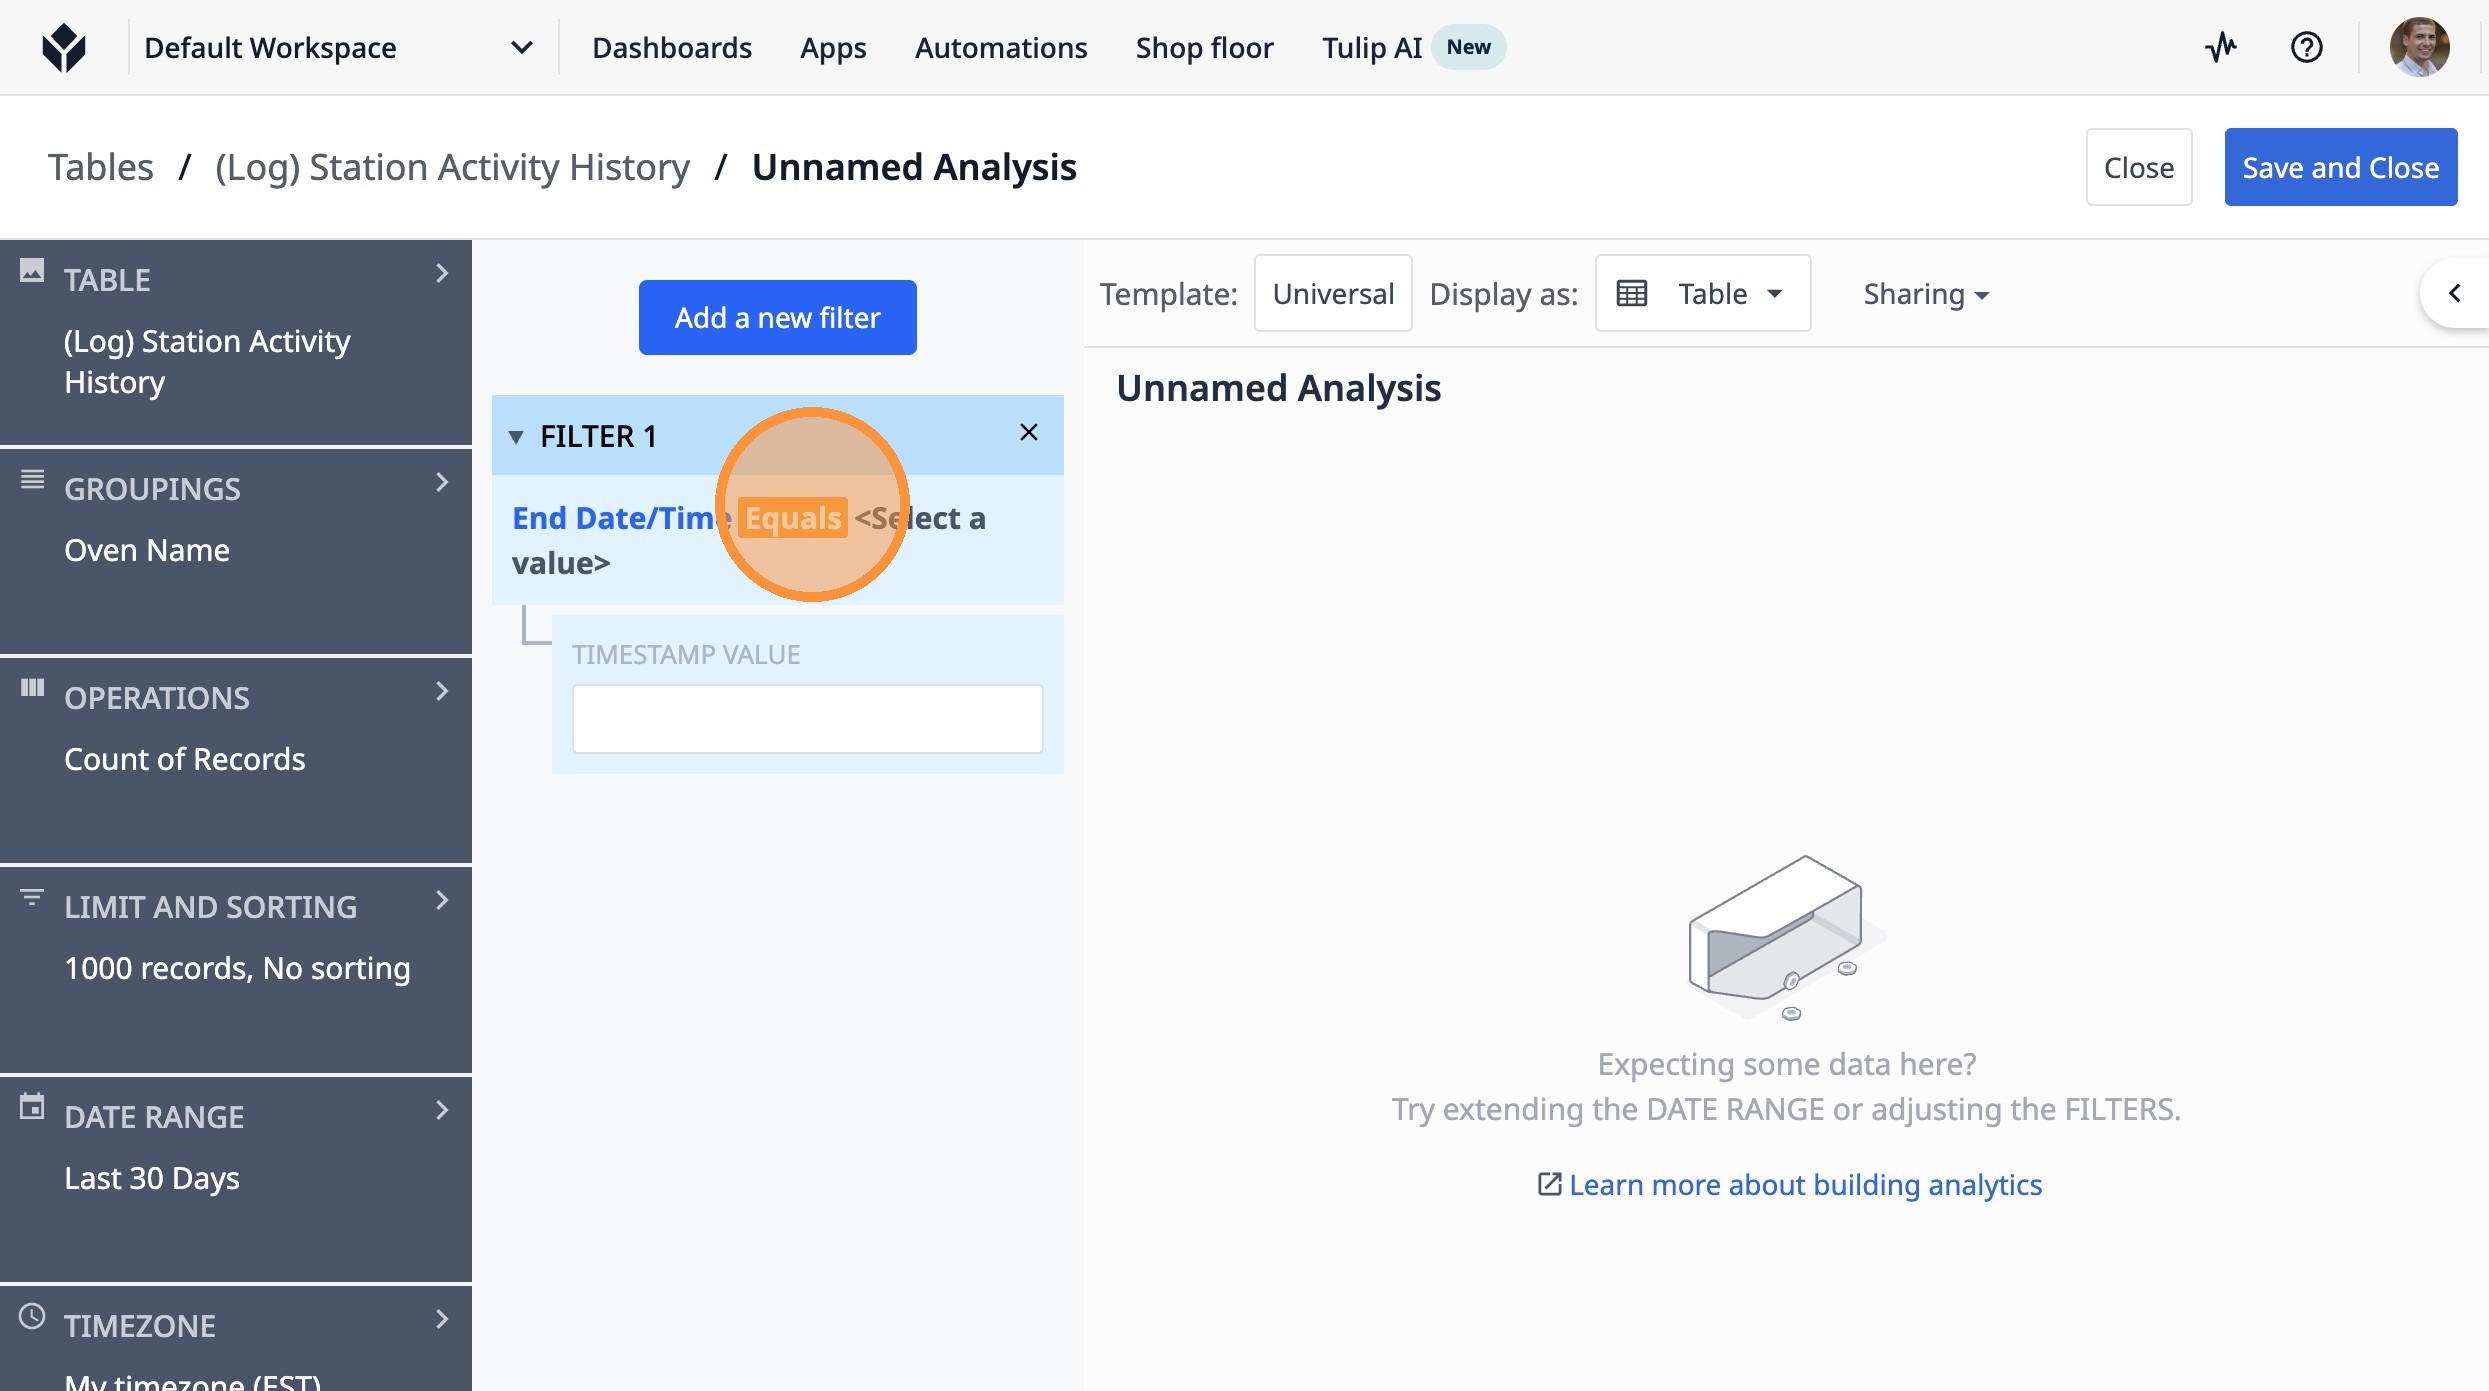
20. Click "Is Not Null"
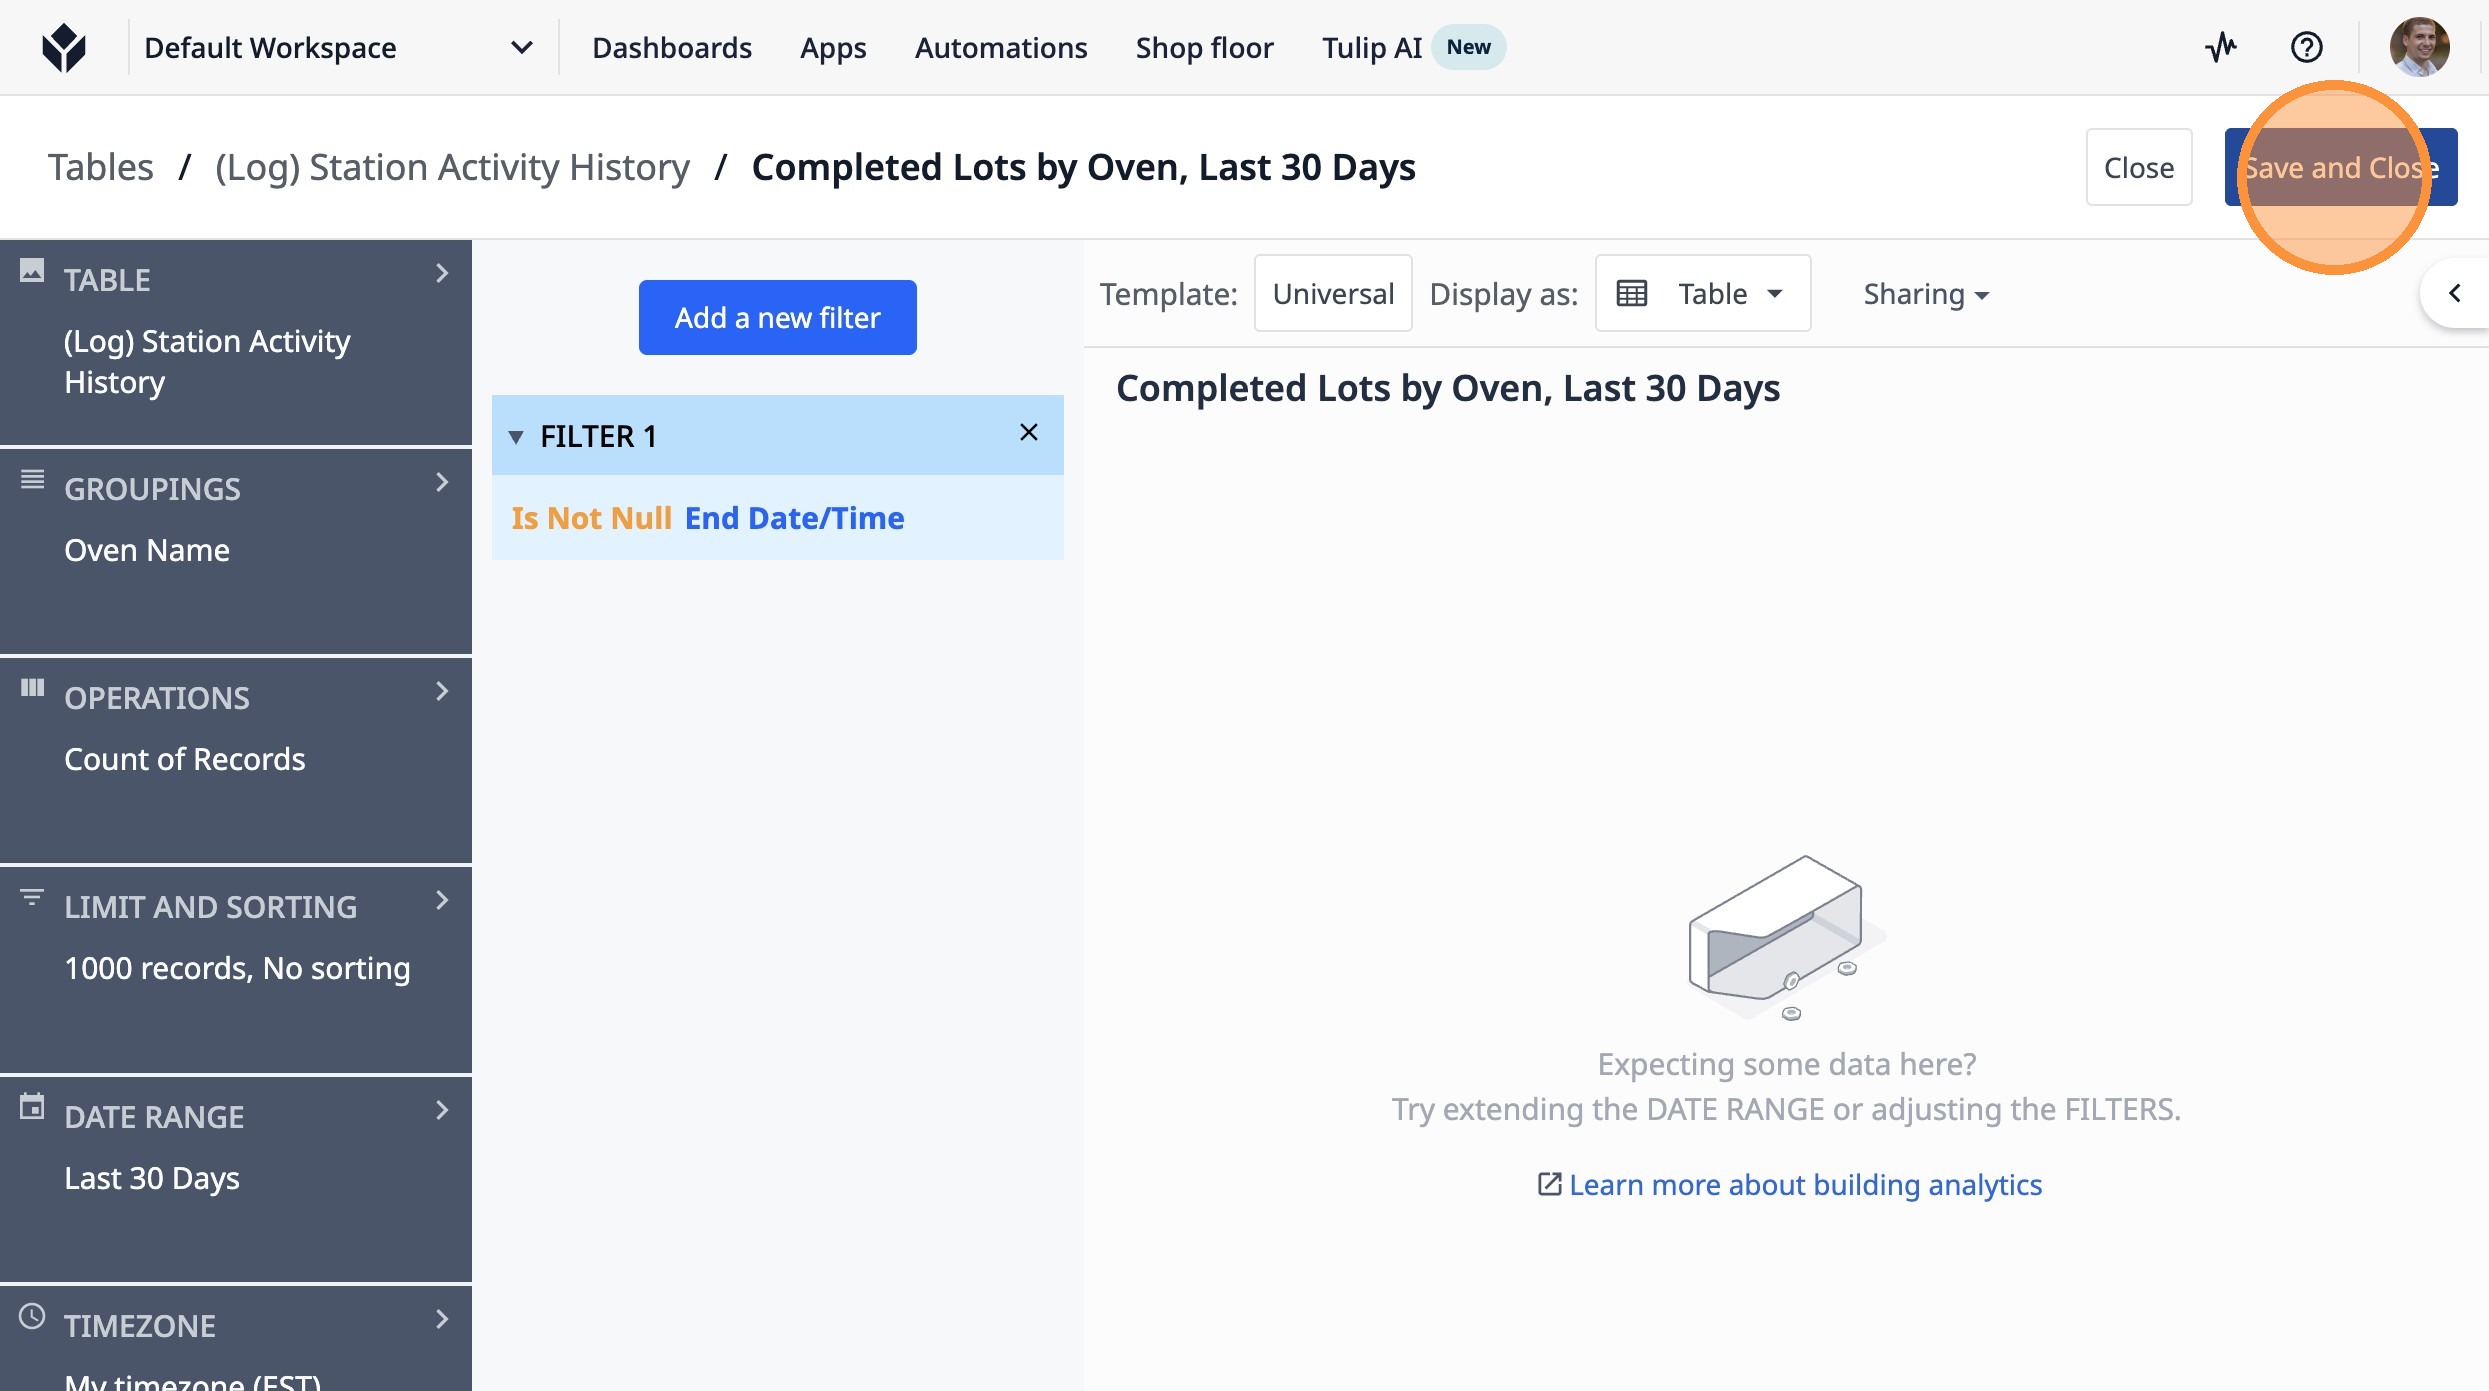
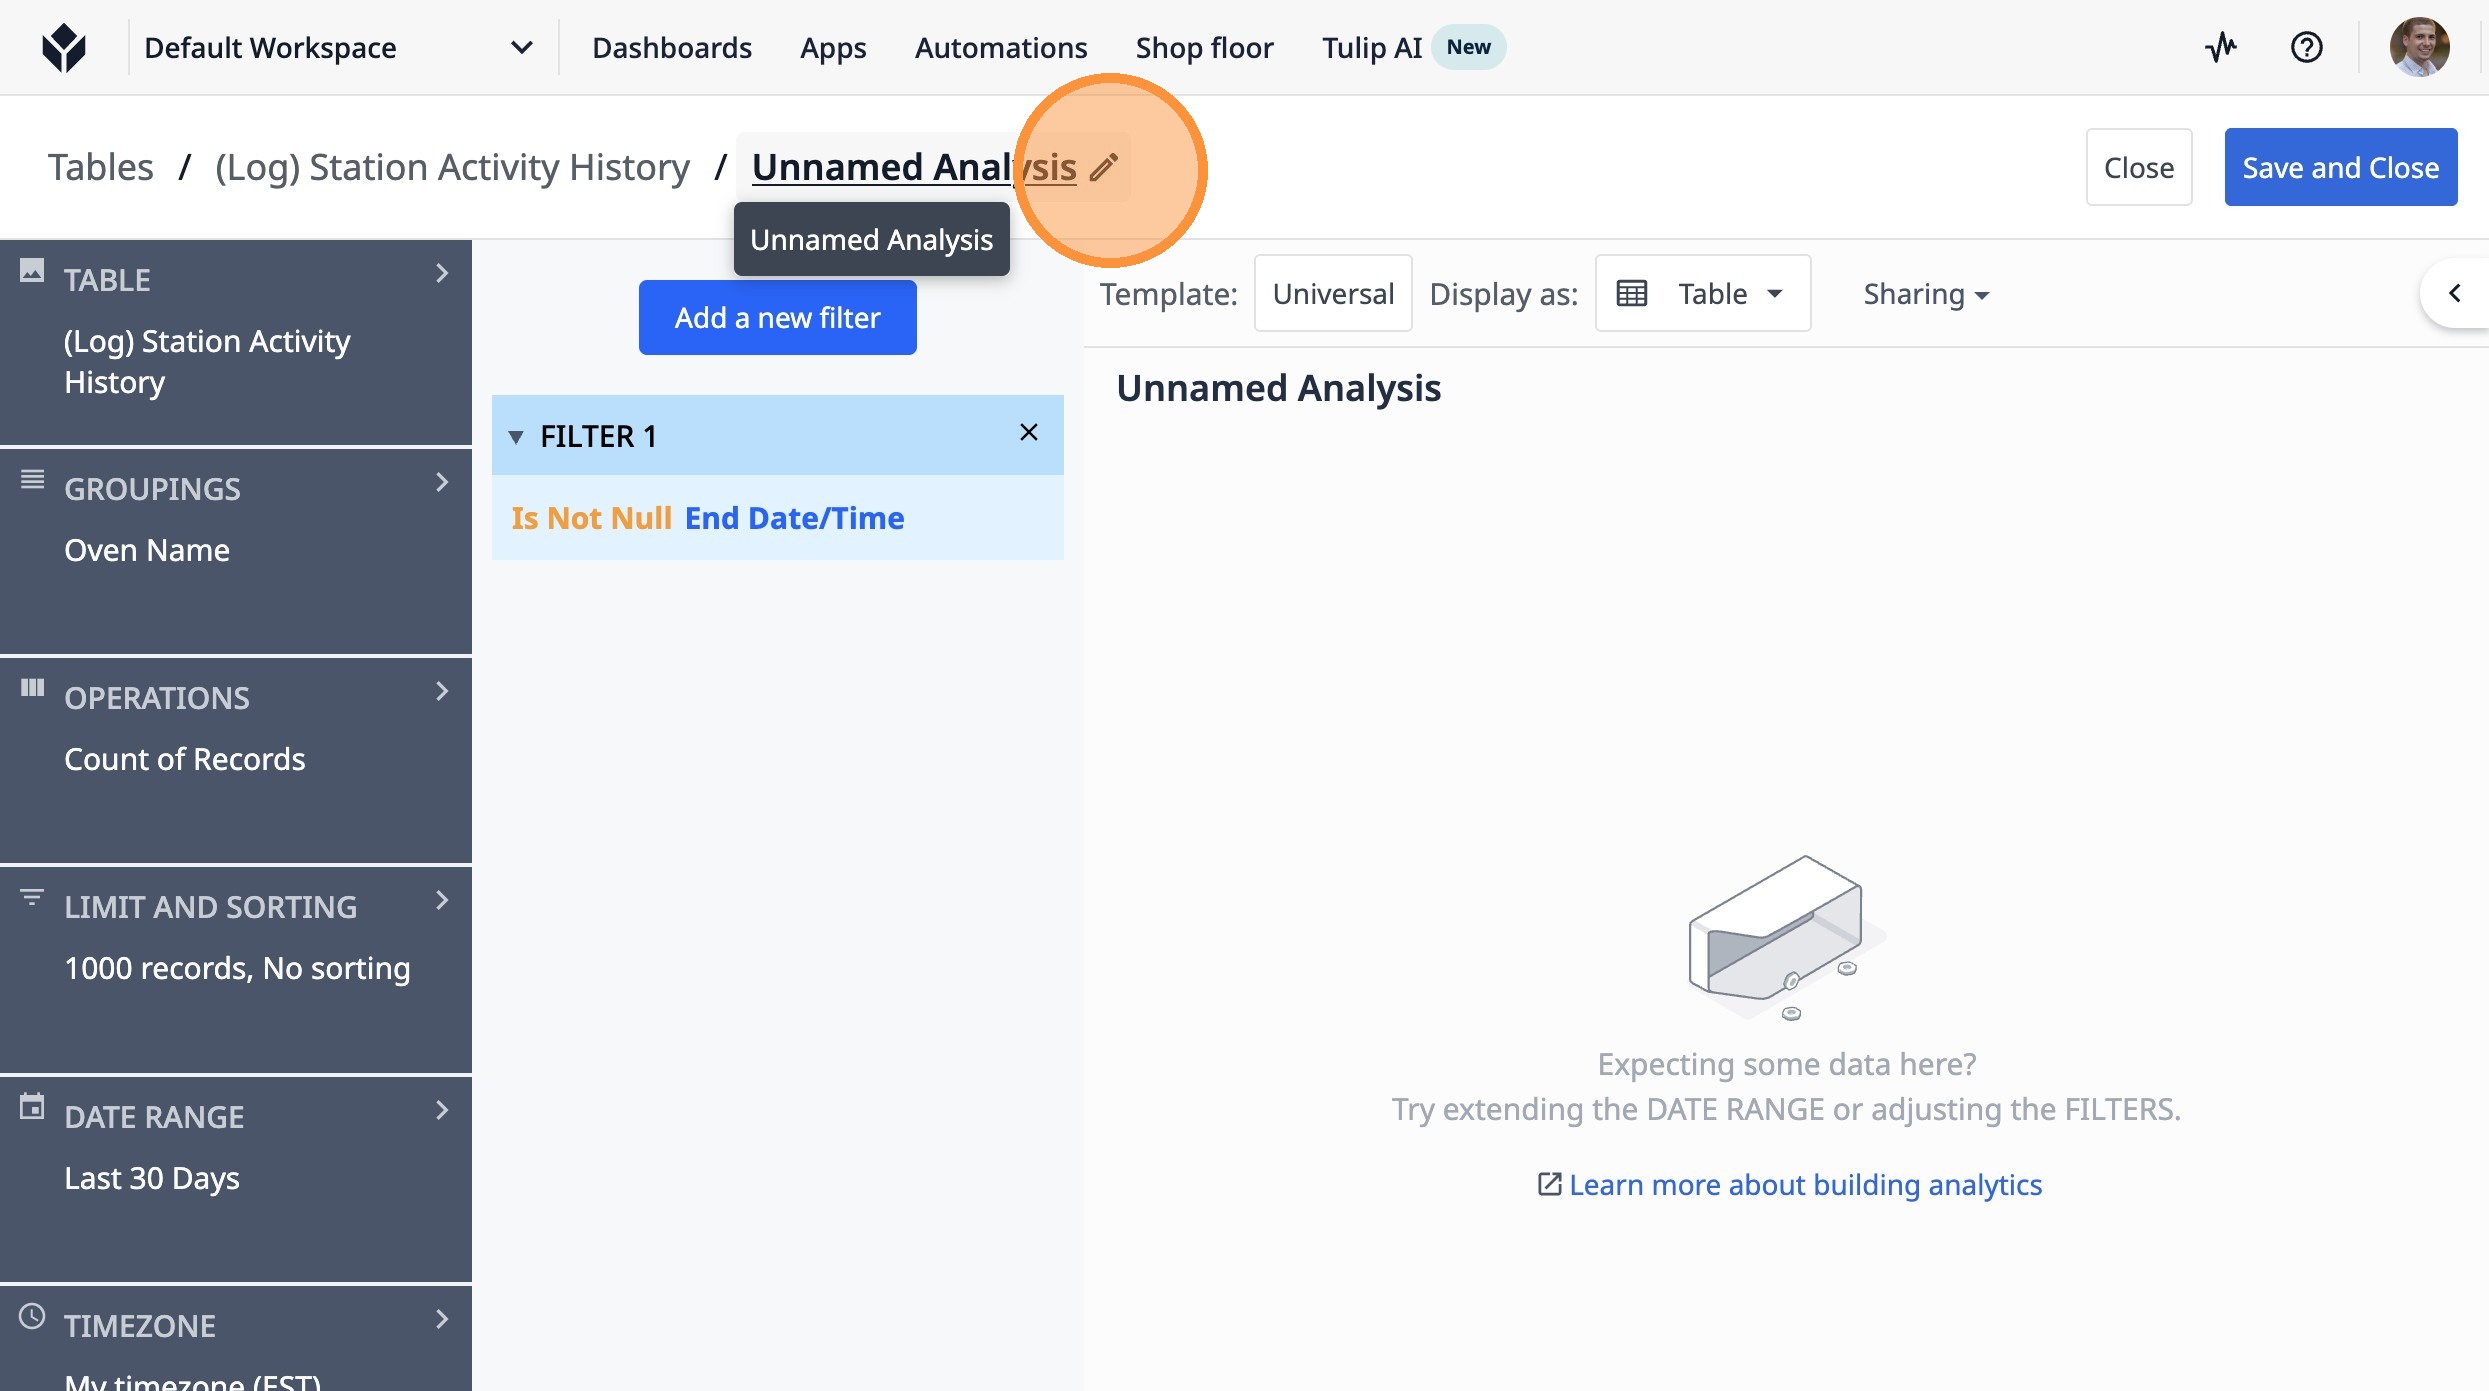
21. Click this icon.
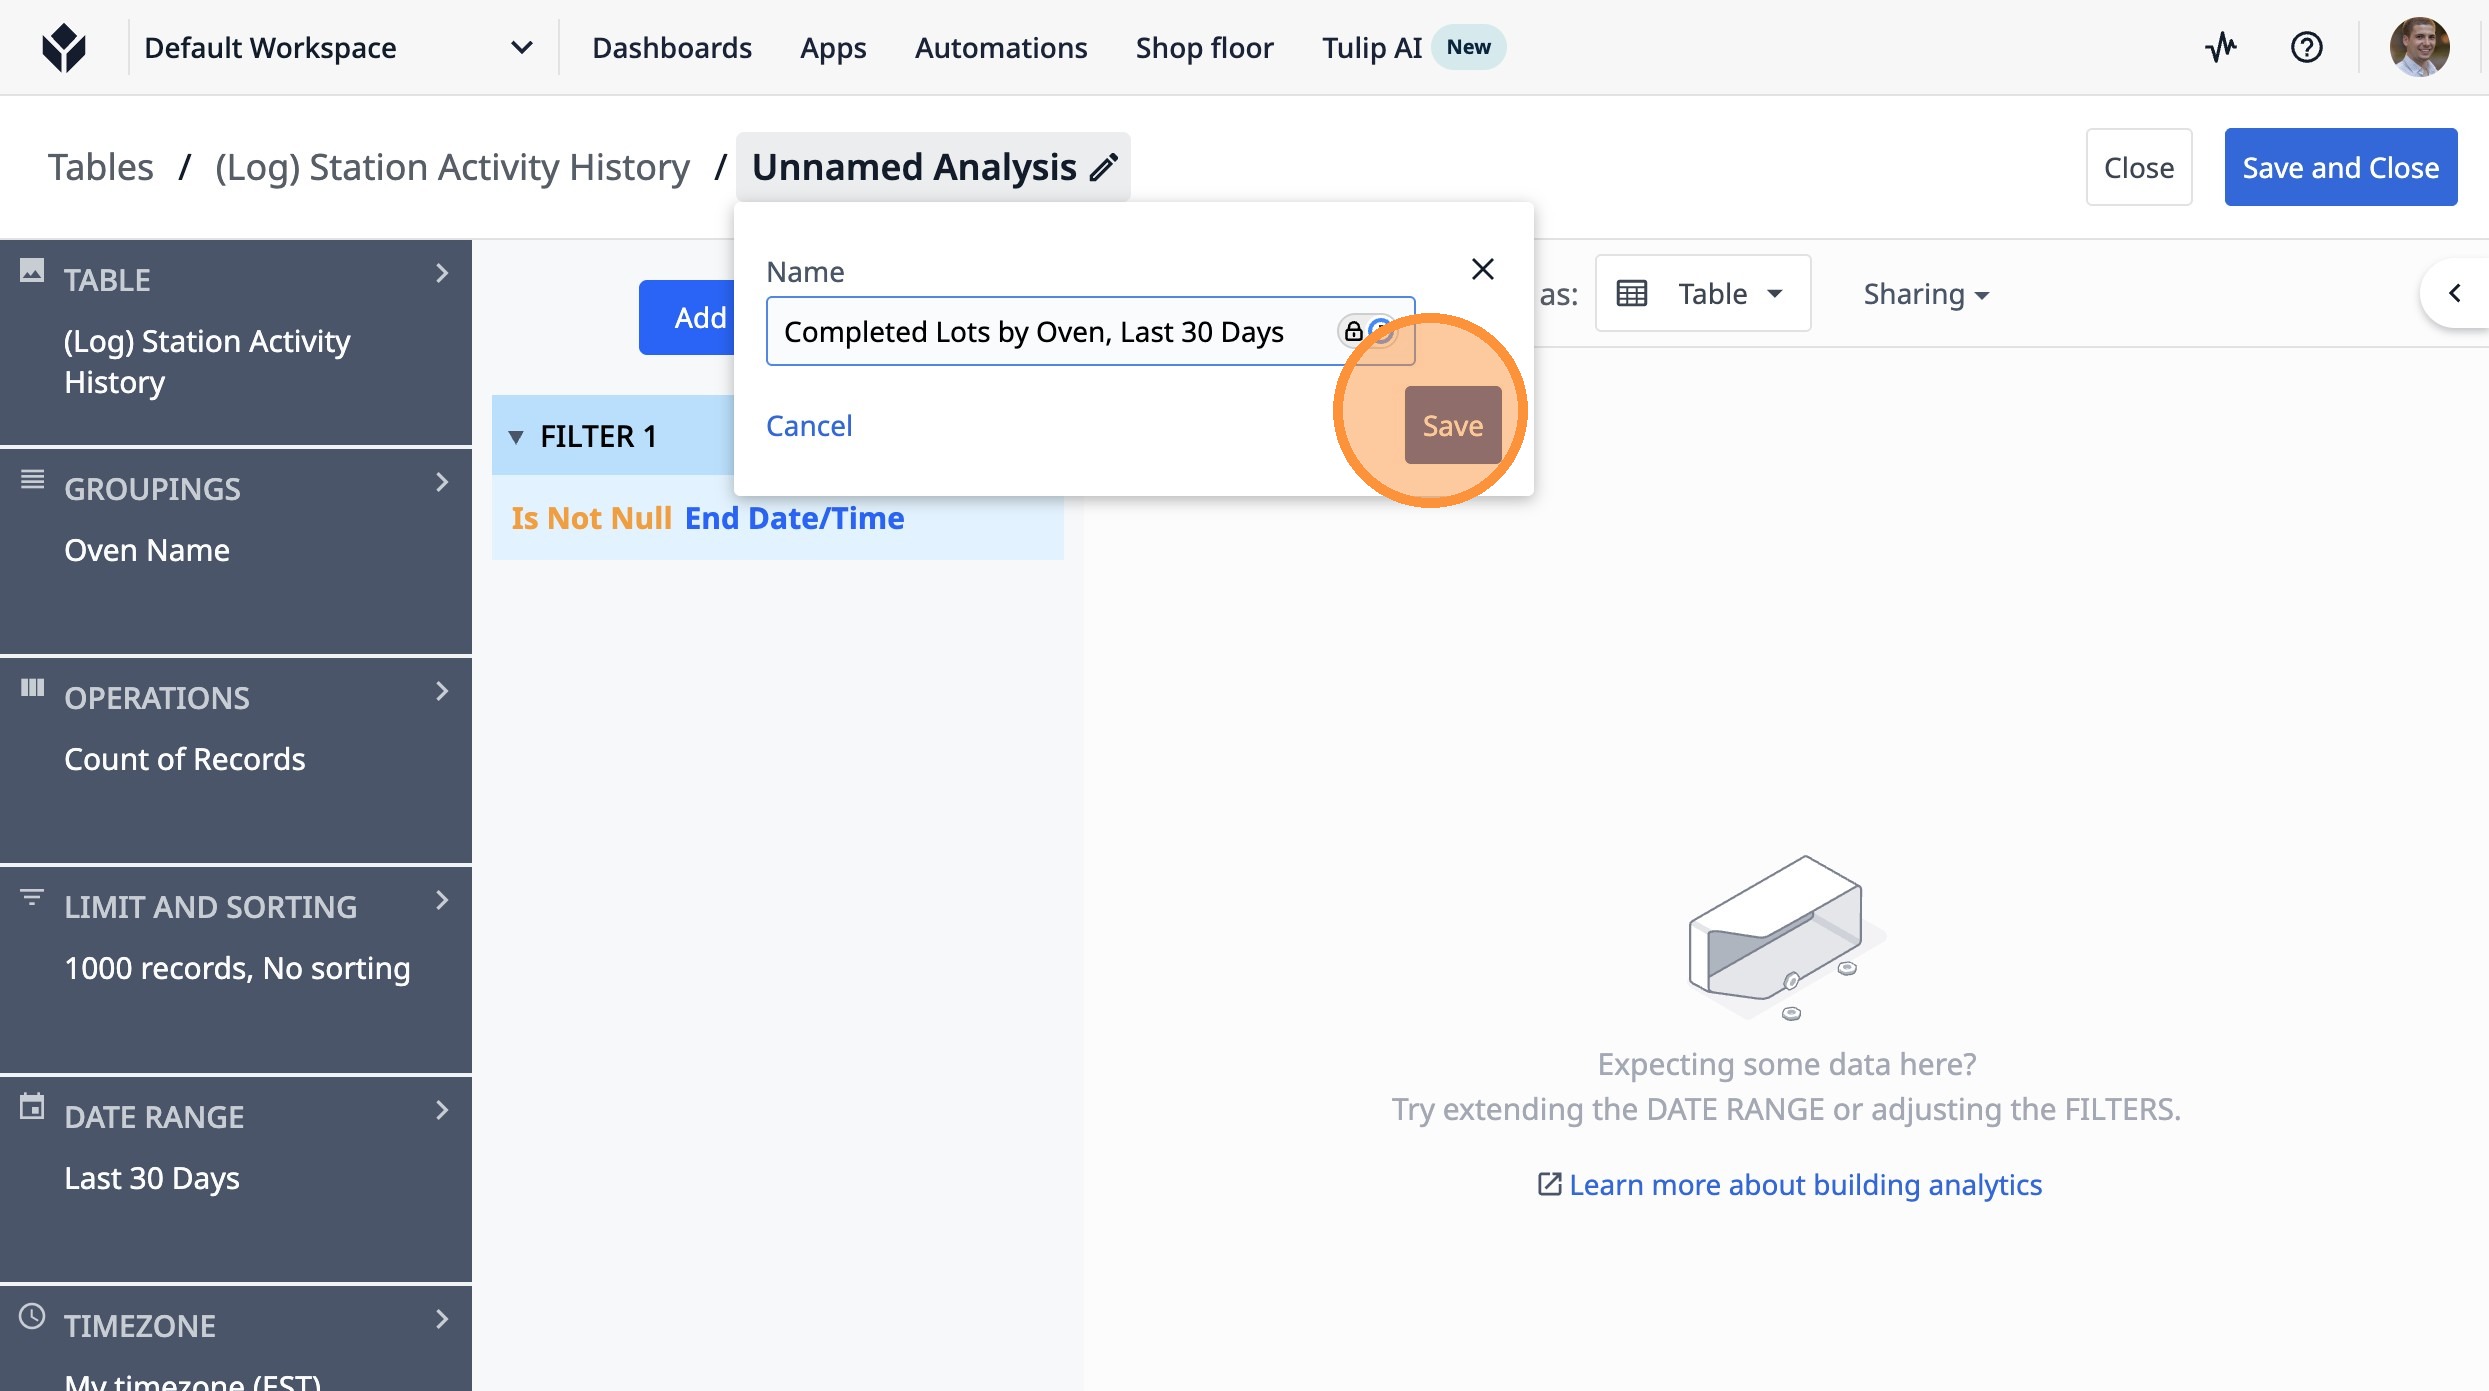
22. Type "Completed Lots by Oven, Last 30 Days"
23. Click "Save"
24. Click "Save and Close"