Learn how to build an interactive table widget to display inspection data. This guide will walk you through configuring a table to show inspection details and setting up dynamic data display for improved workflow visualization.
1. Navigate to a step in the App Builder.
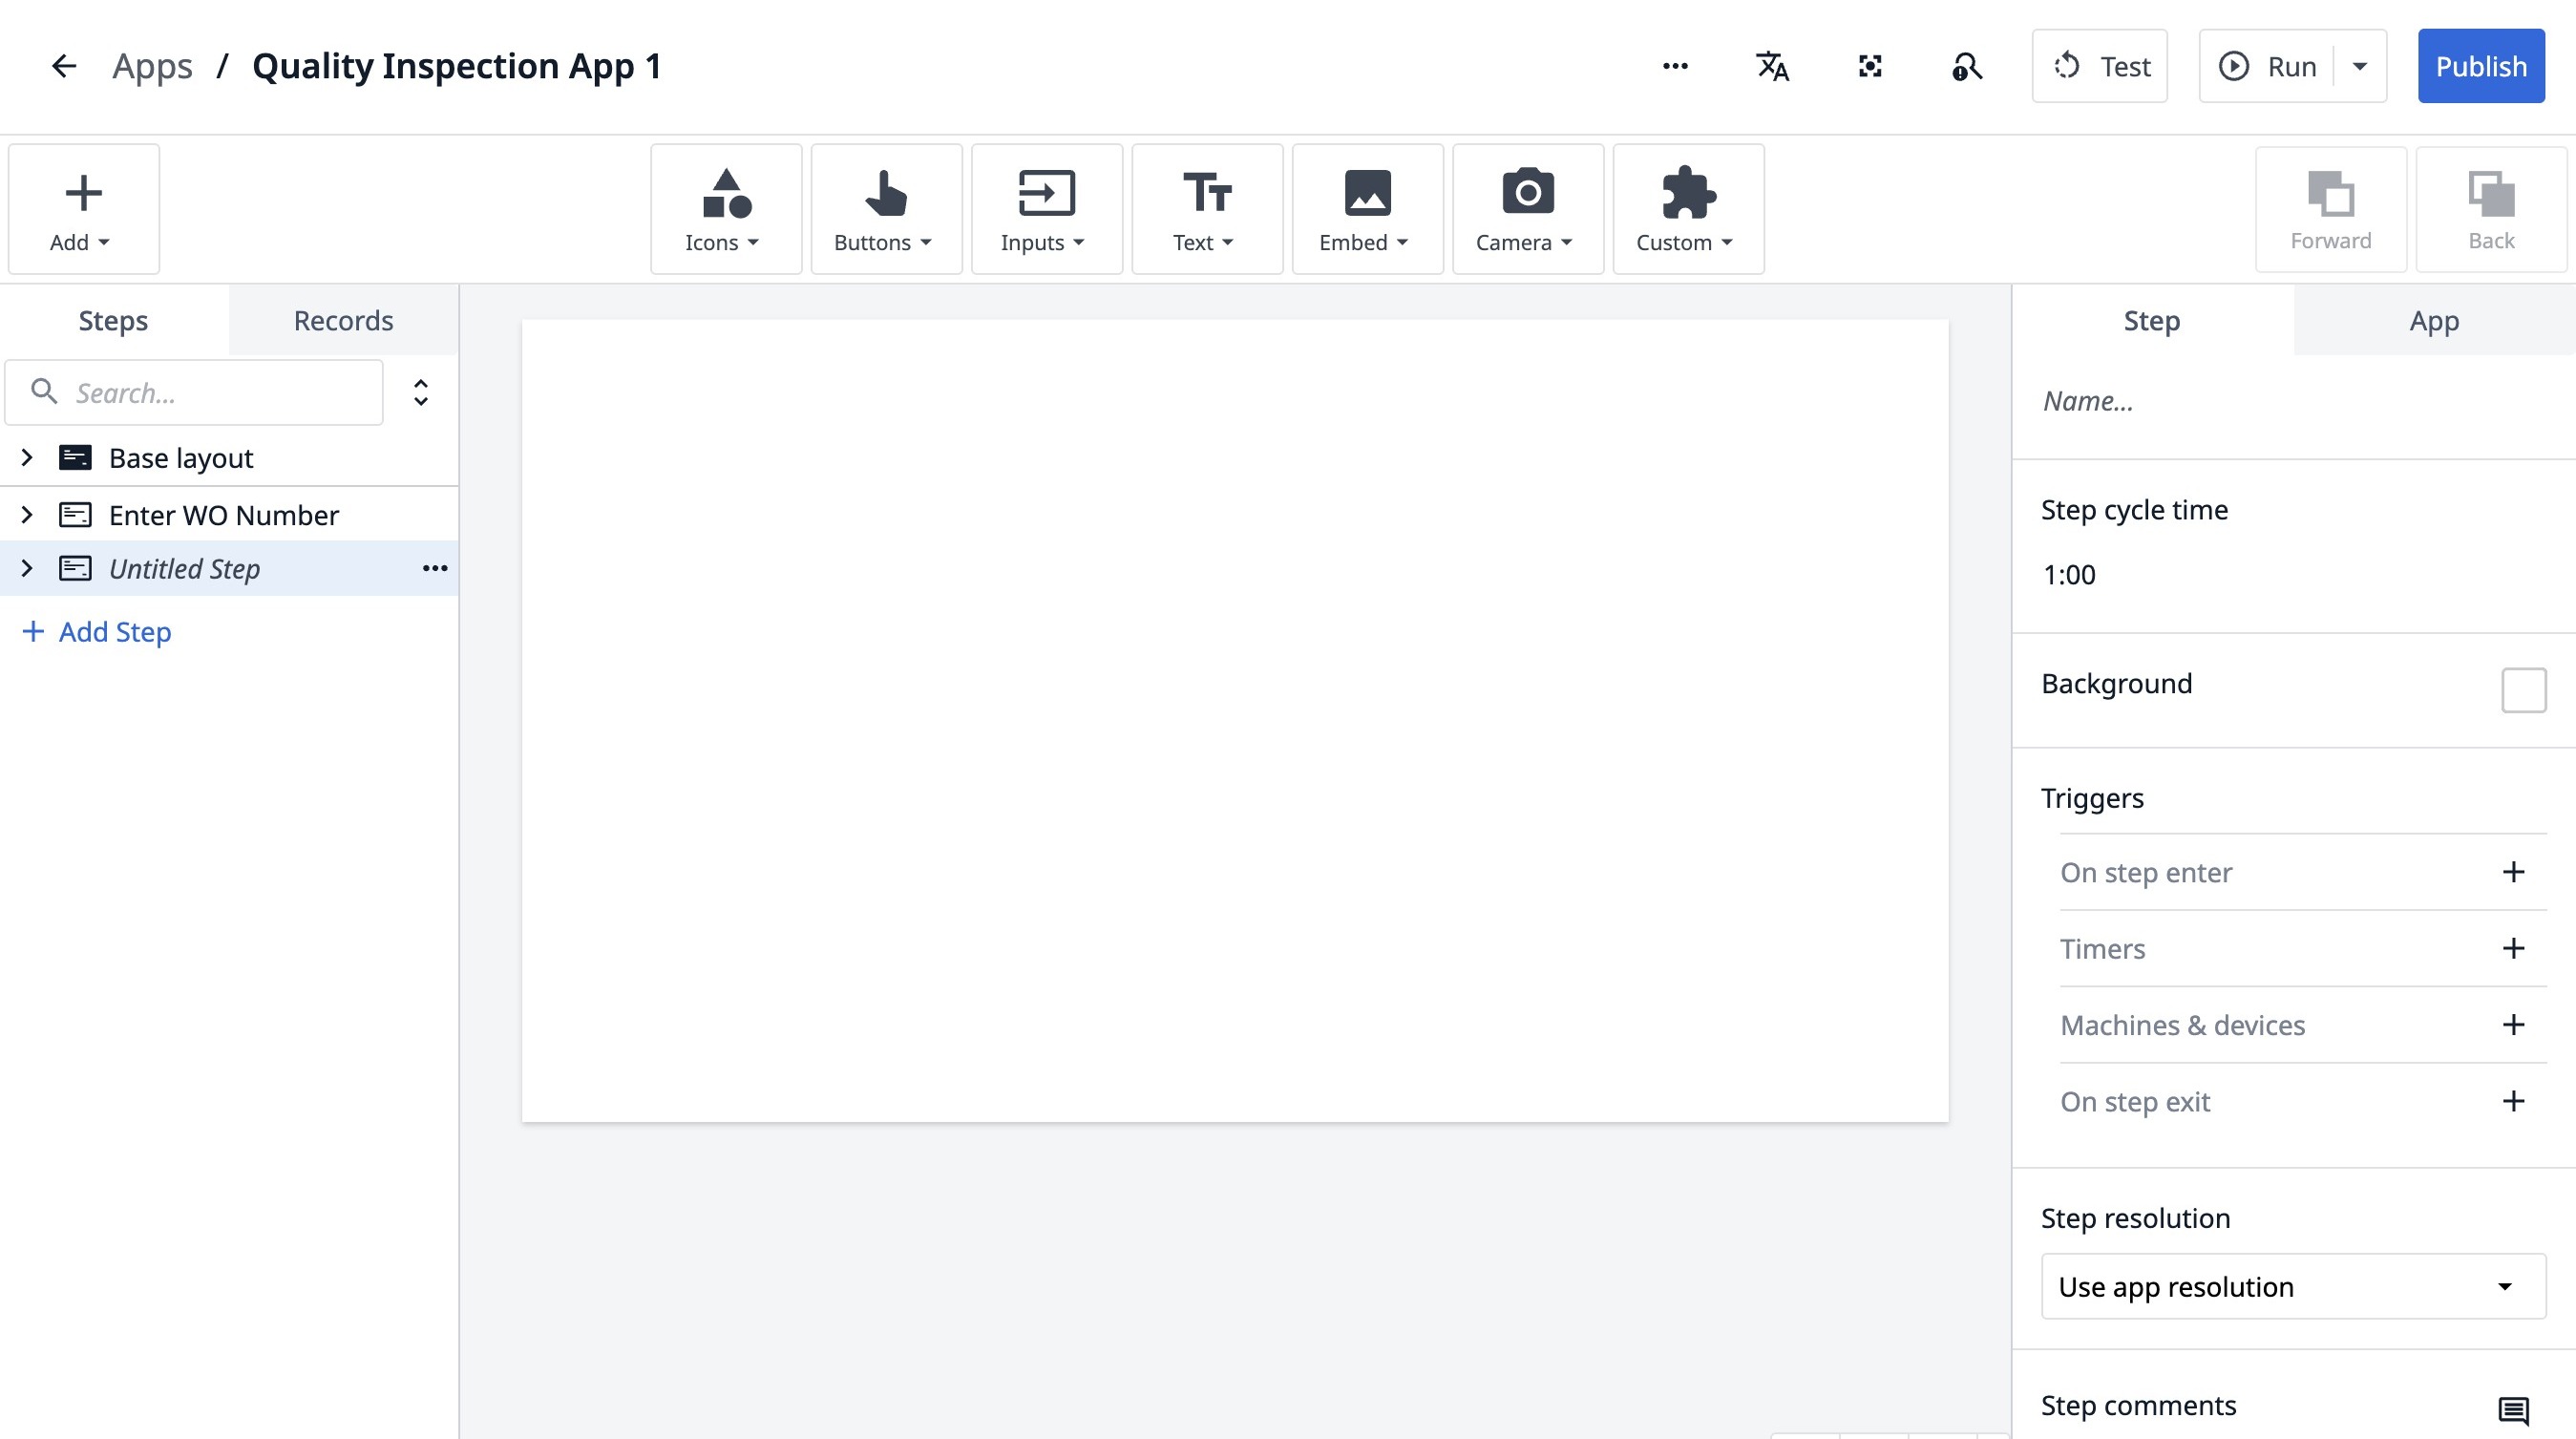
2. Double-click "Untitled Step"
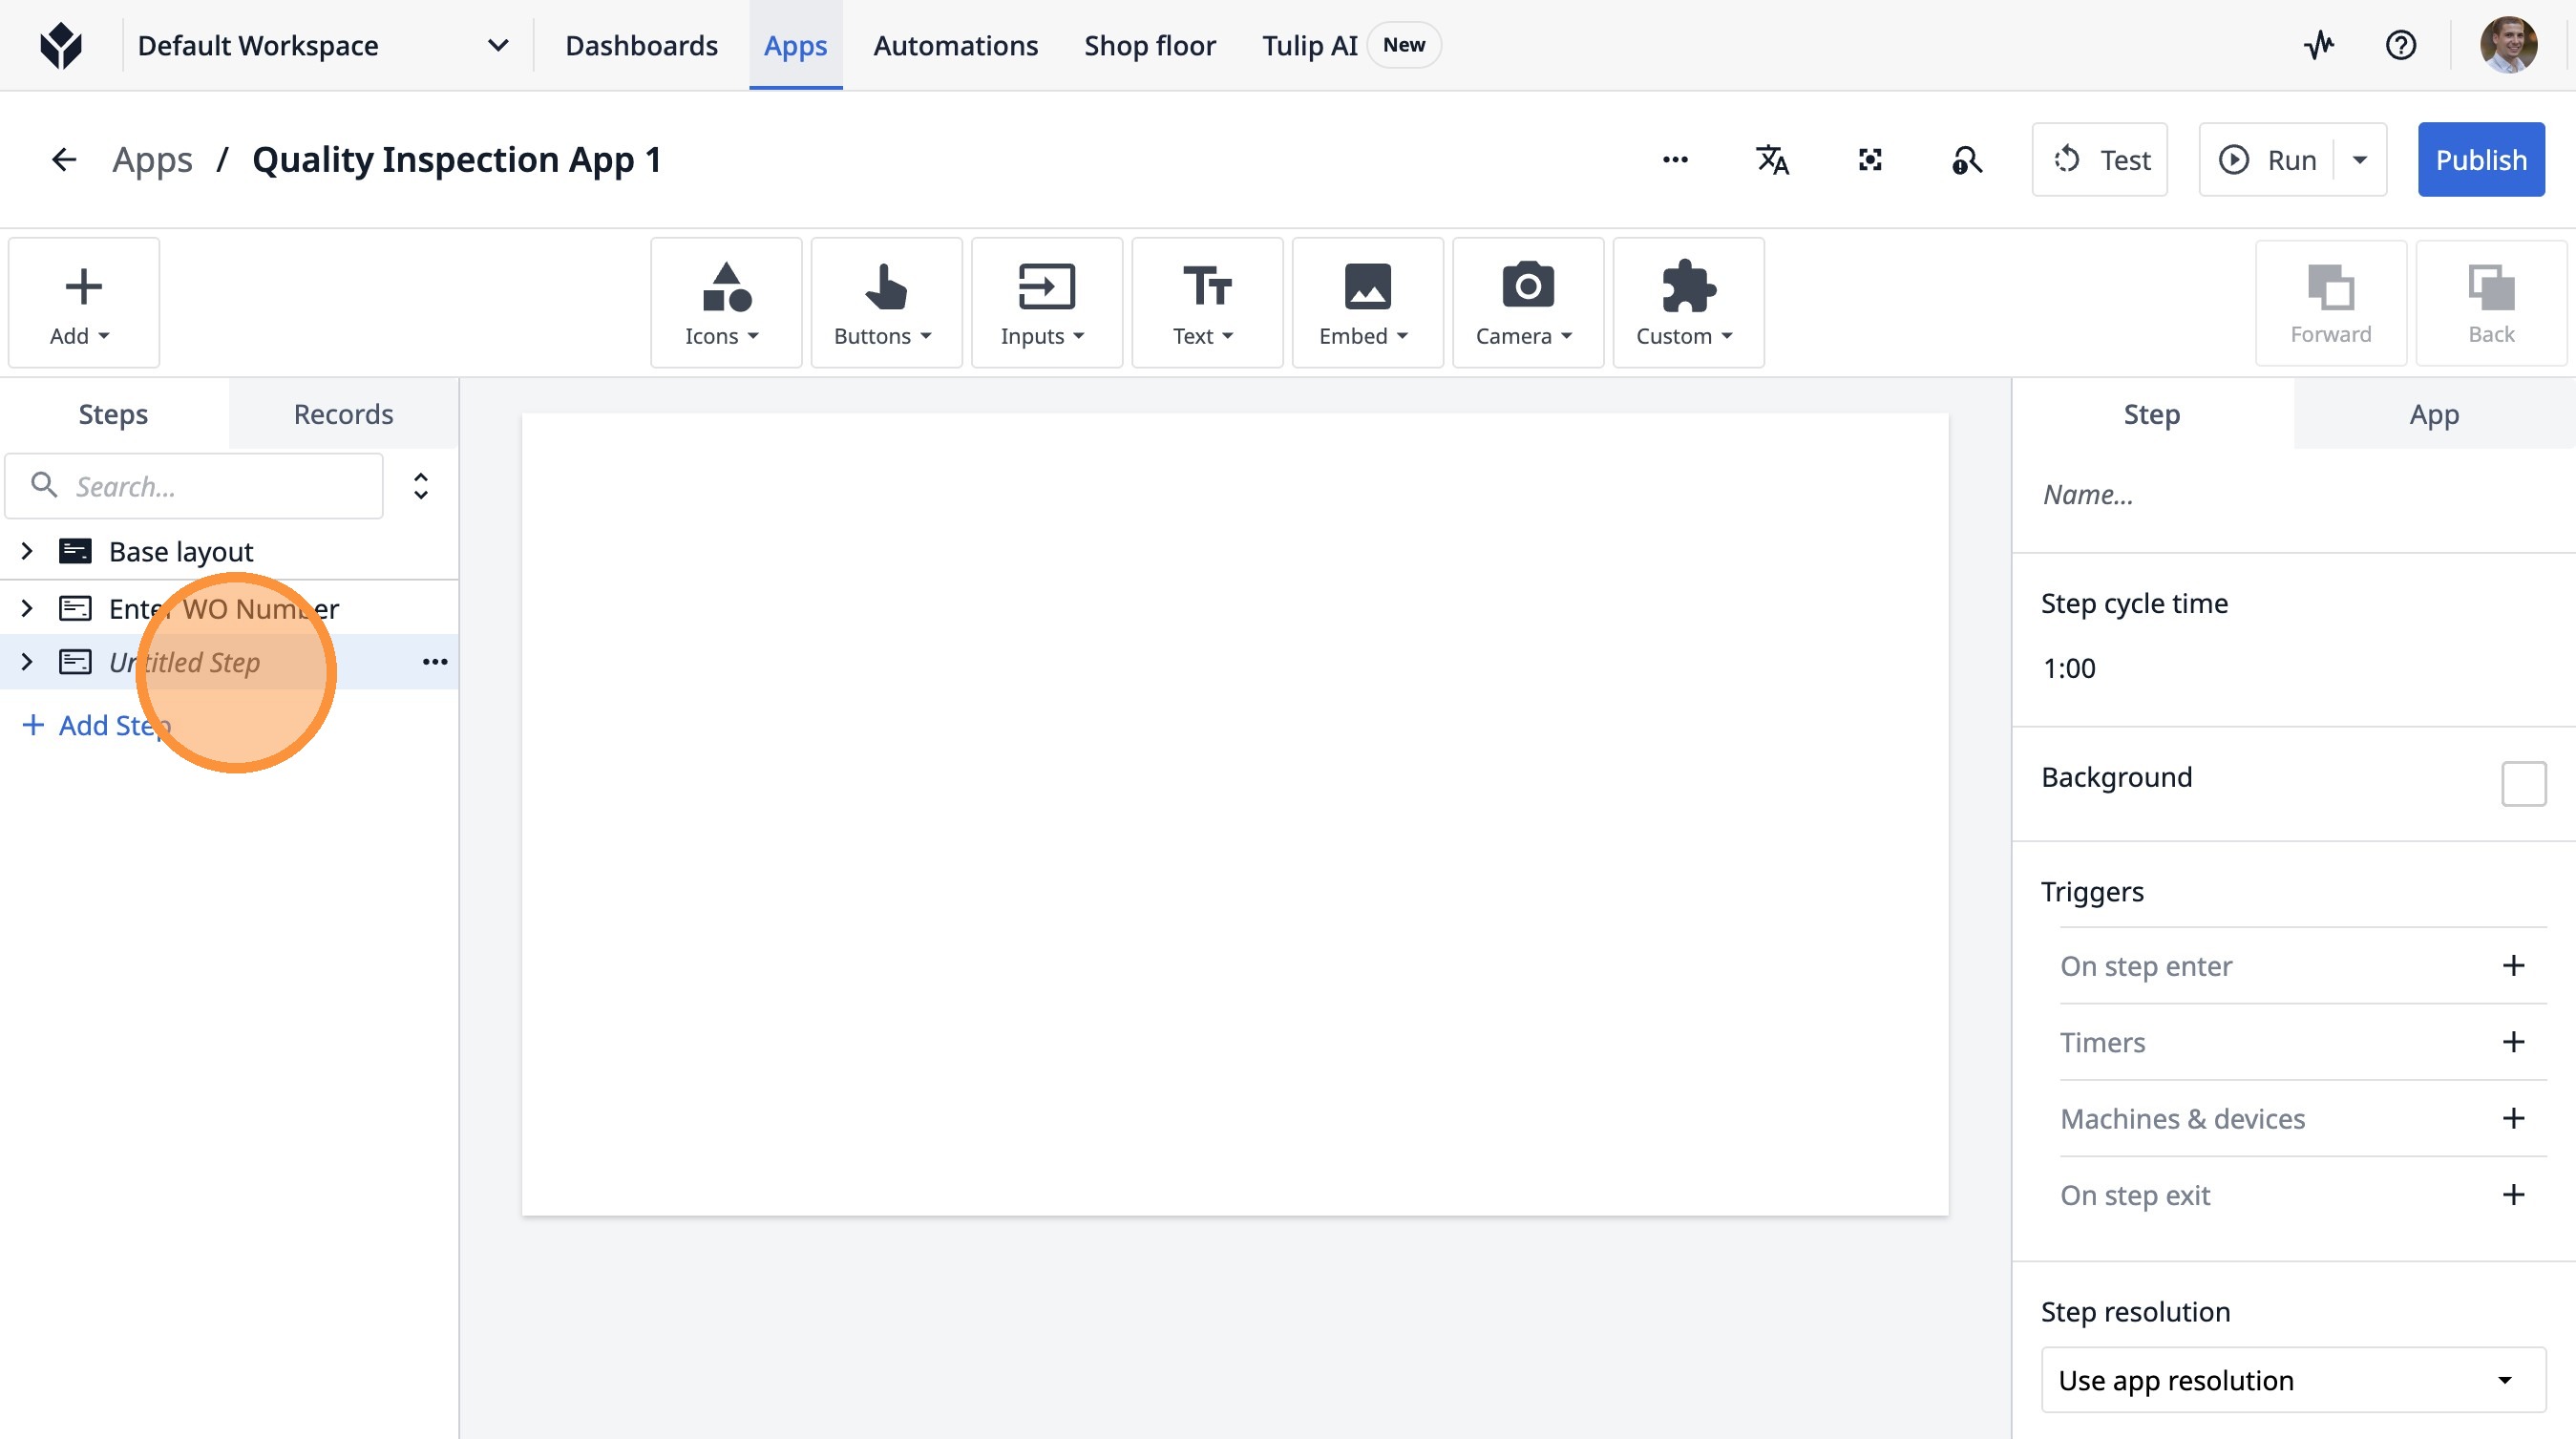
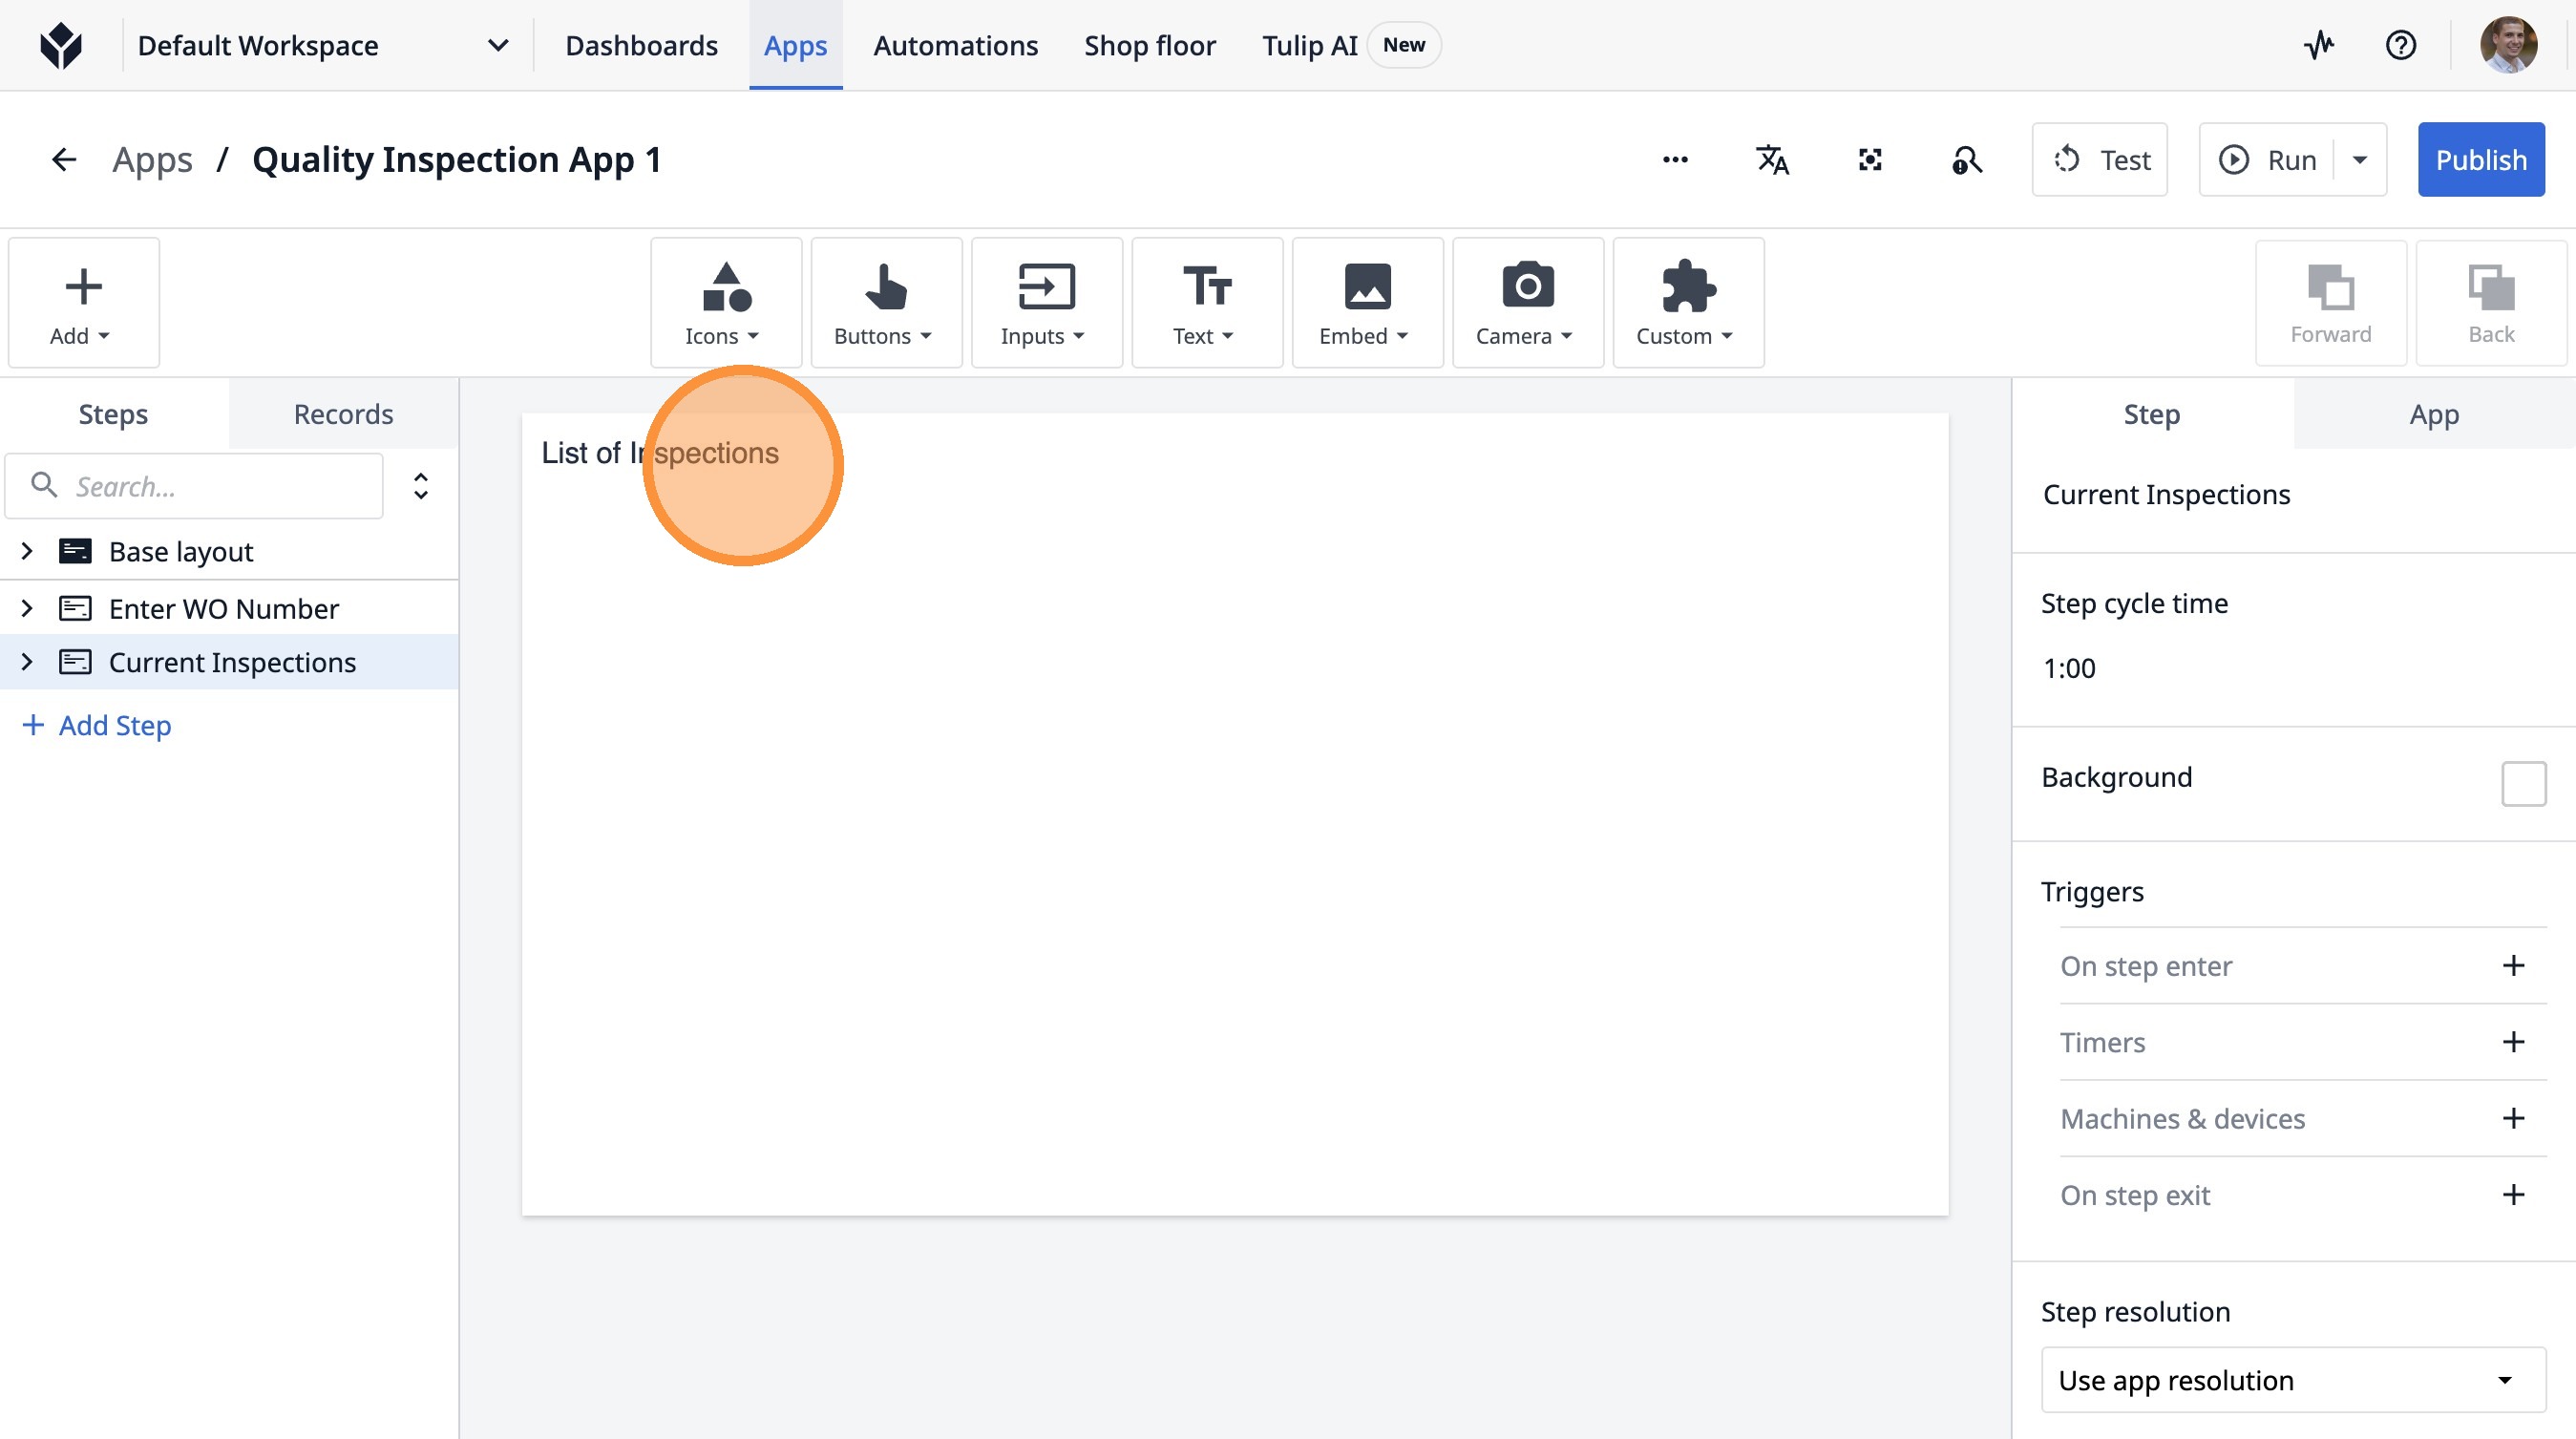
3. Type "Current Inspections"
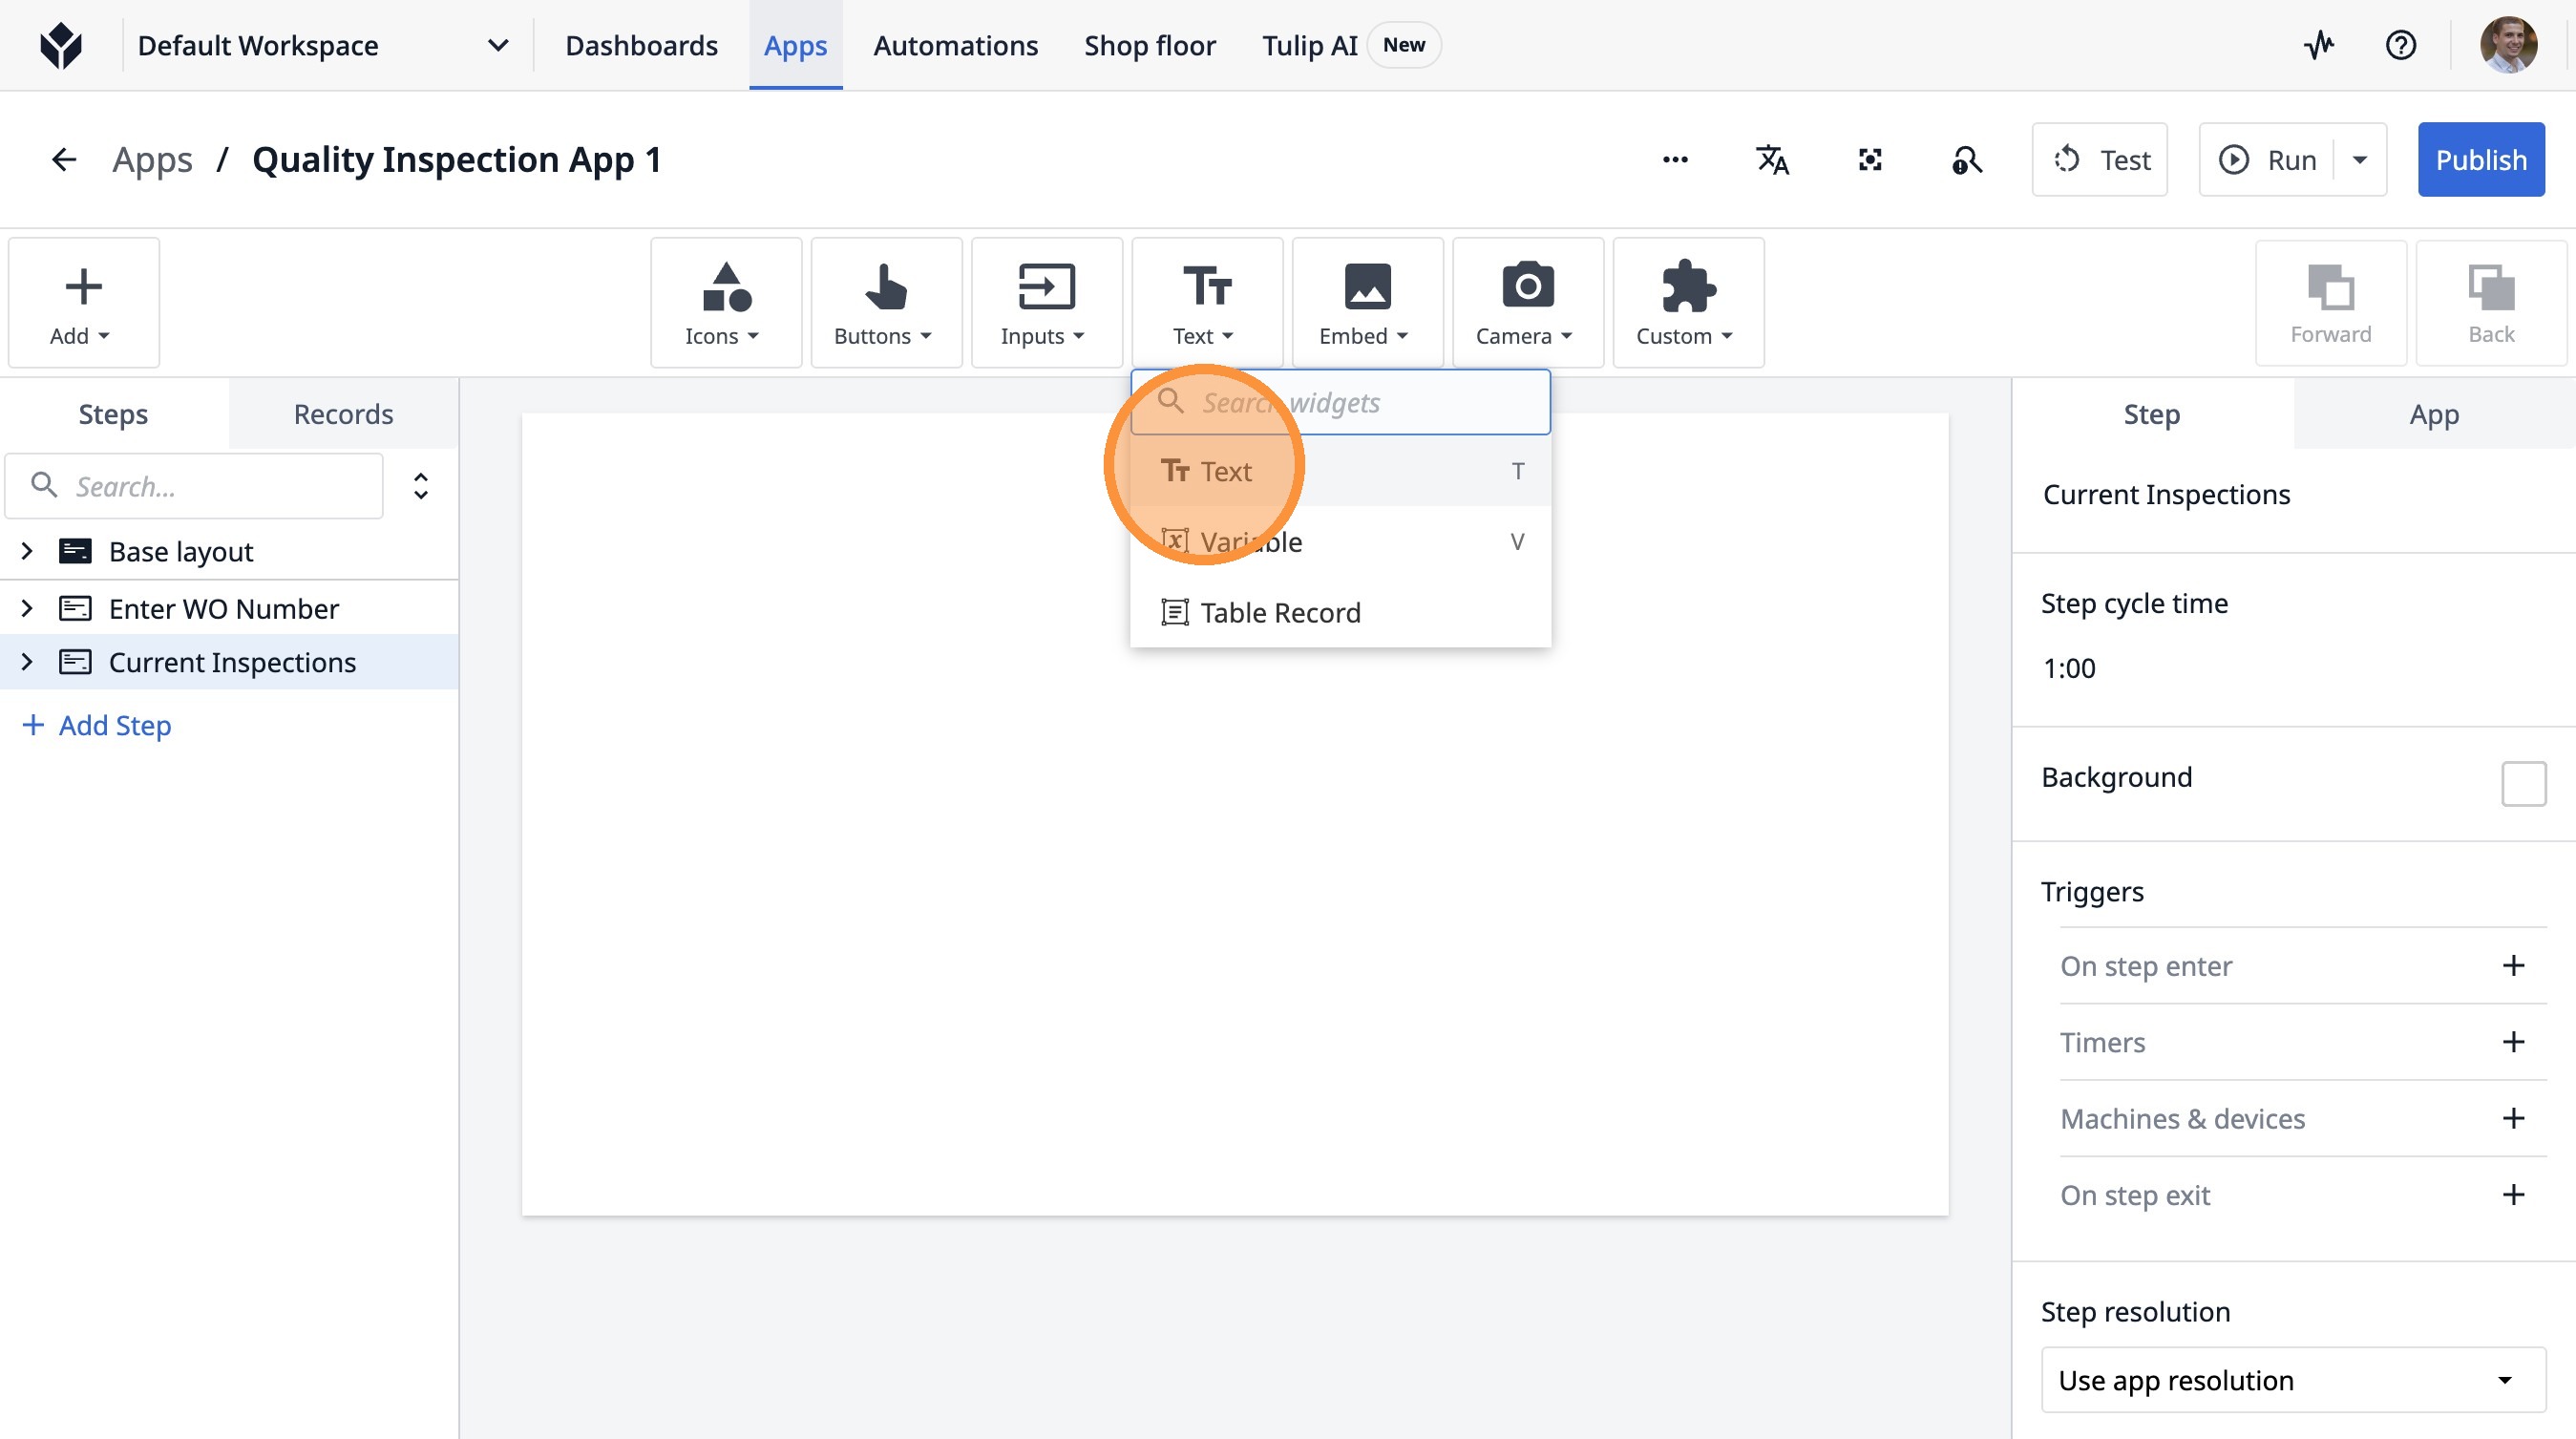
4. Click this icon.
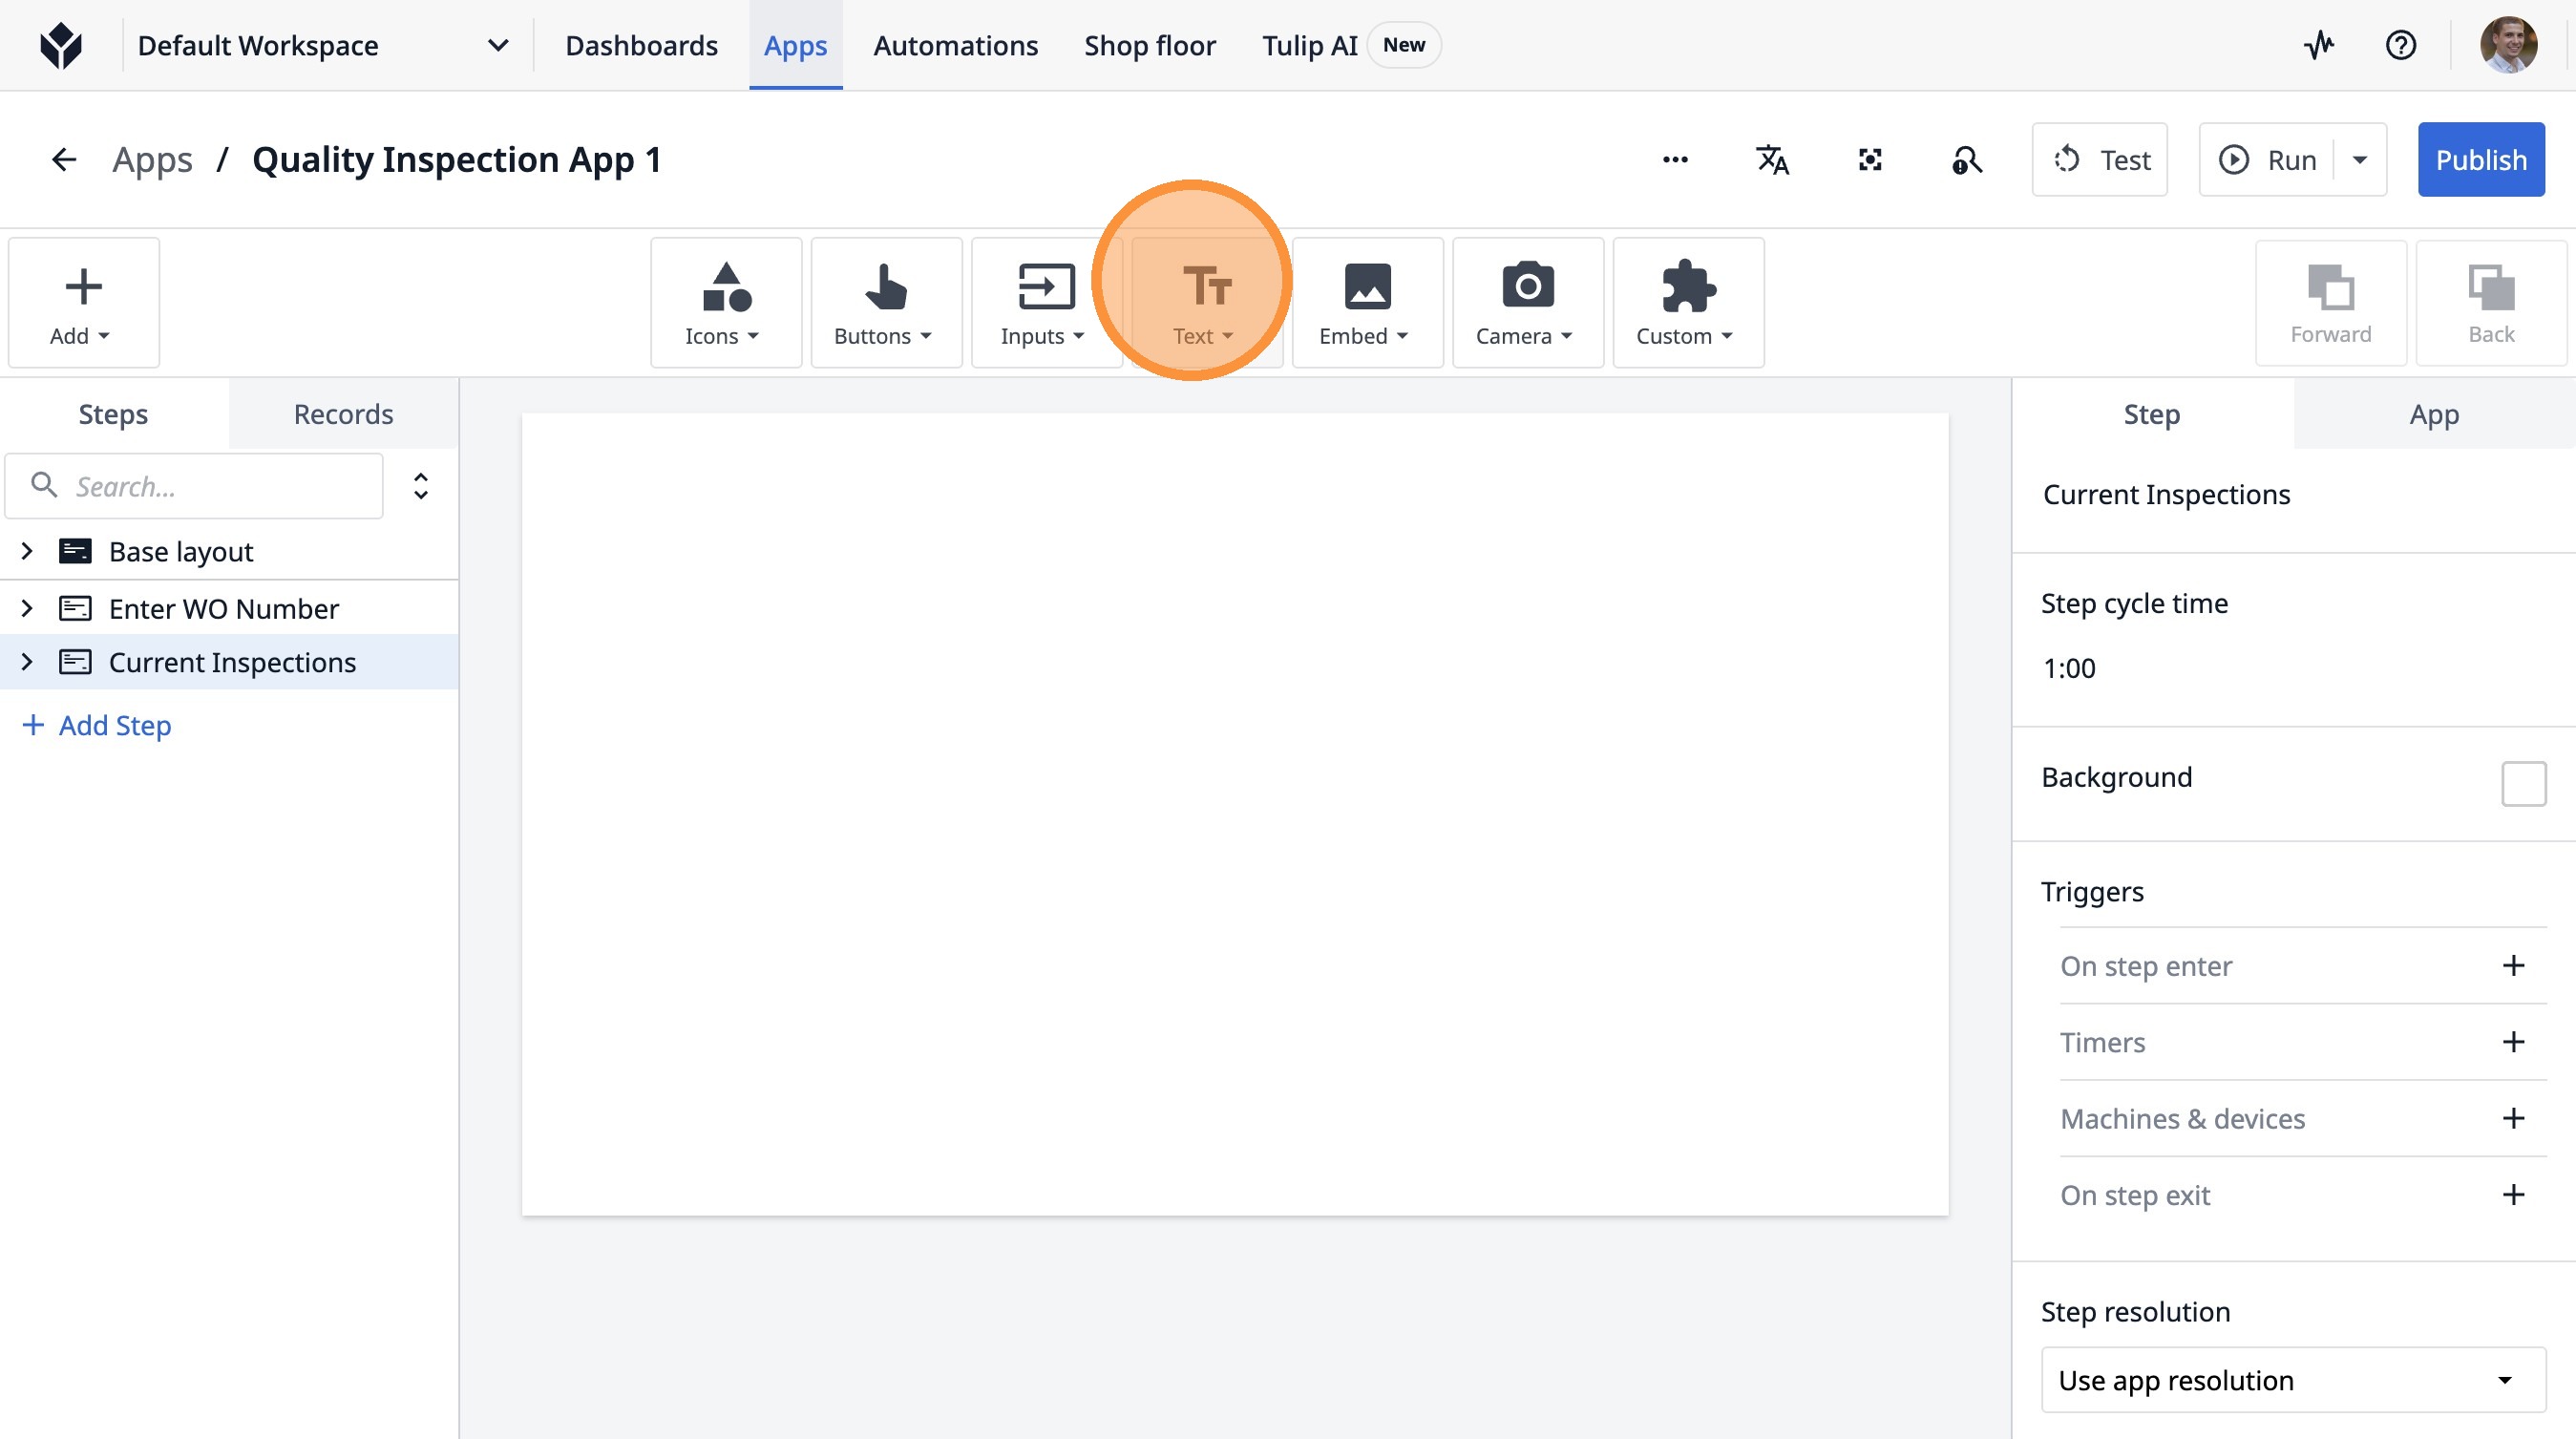
5. Click "Text"
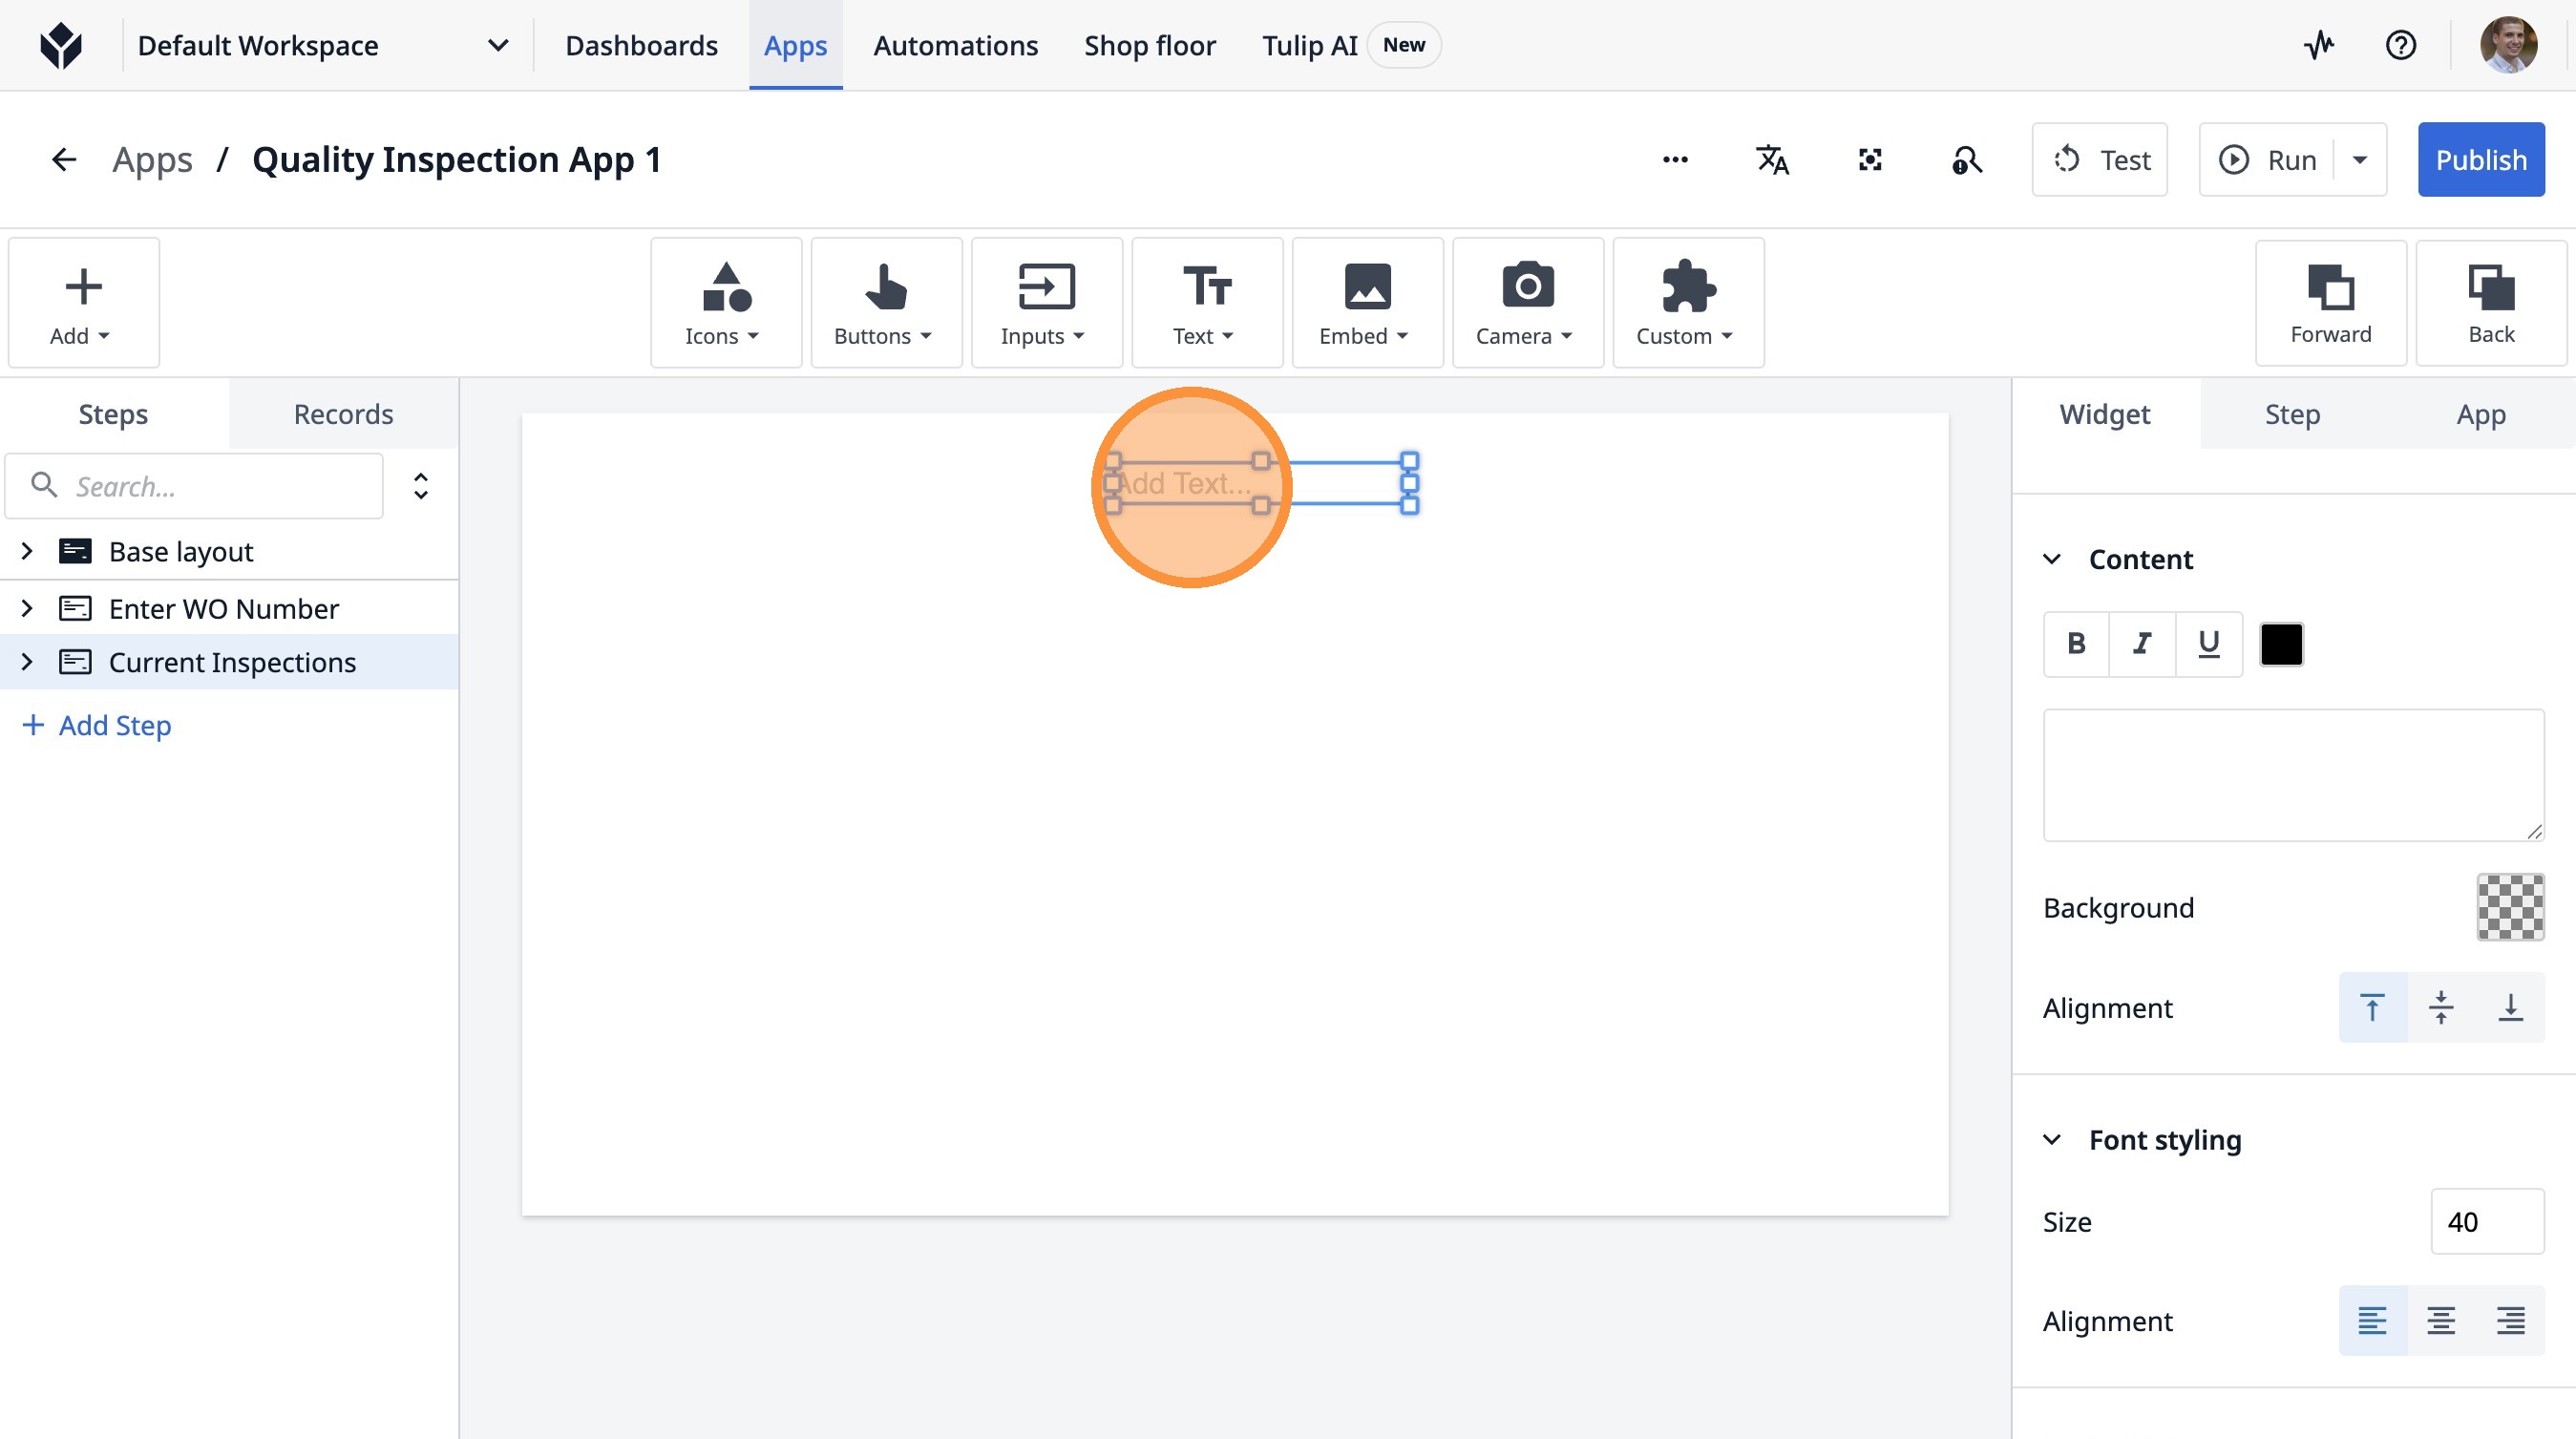
6. Click "Add Text..."
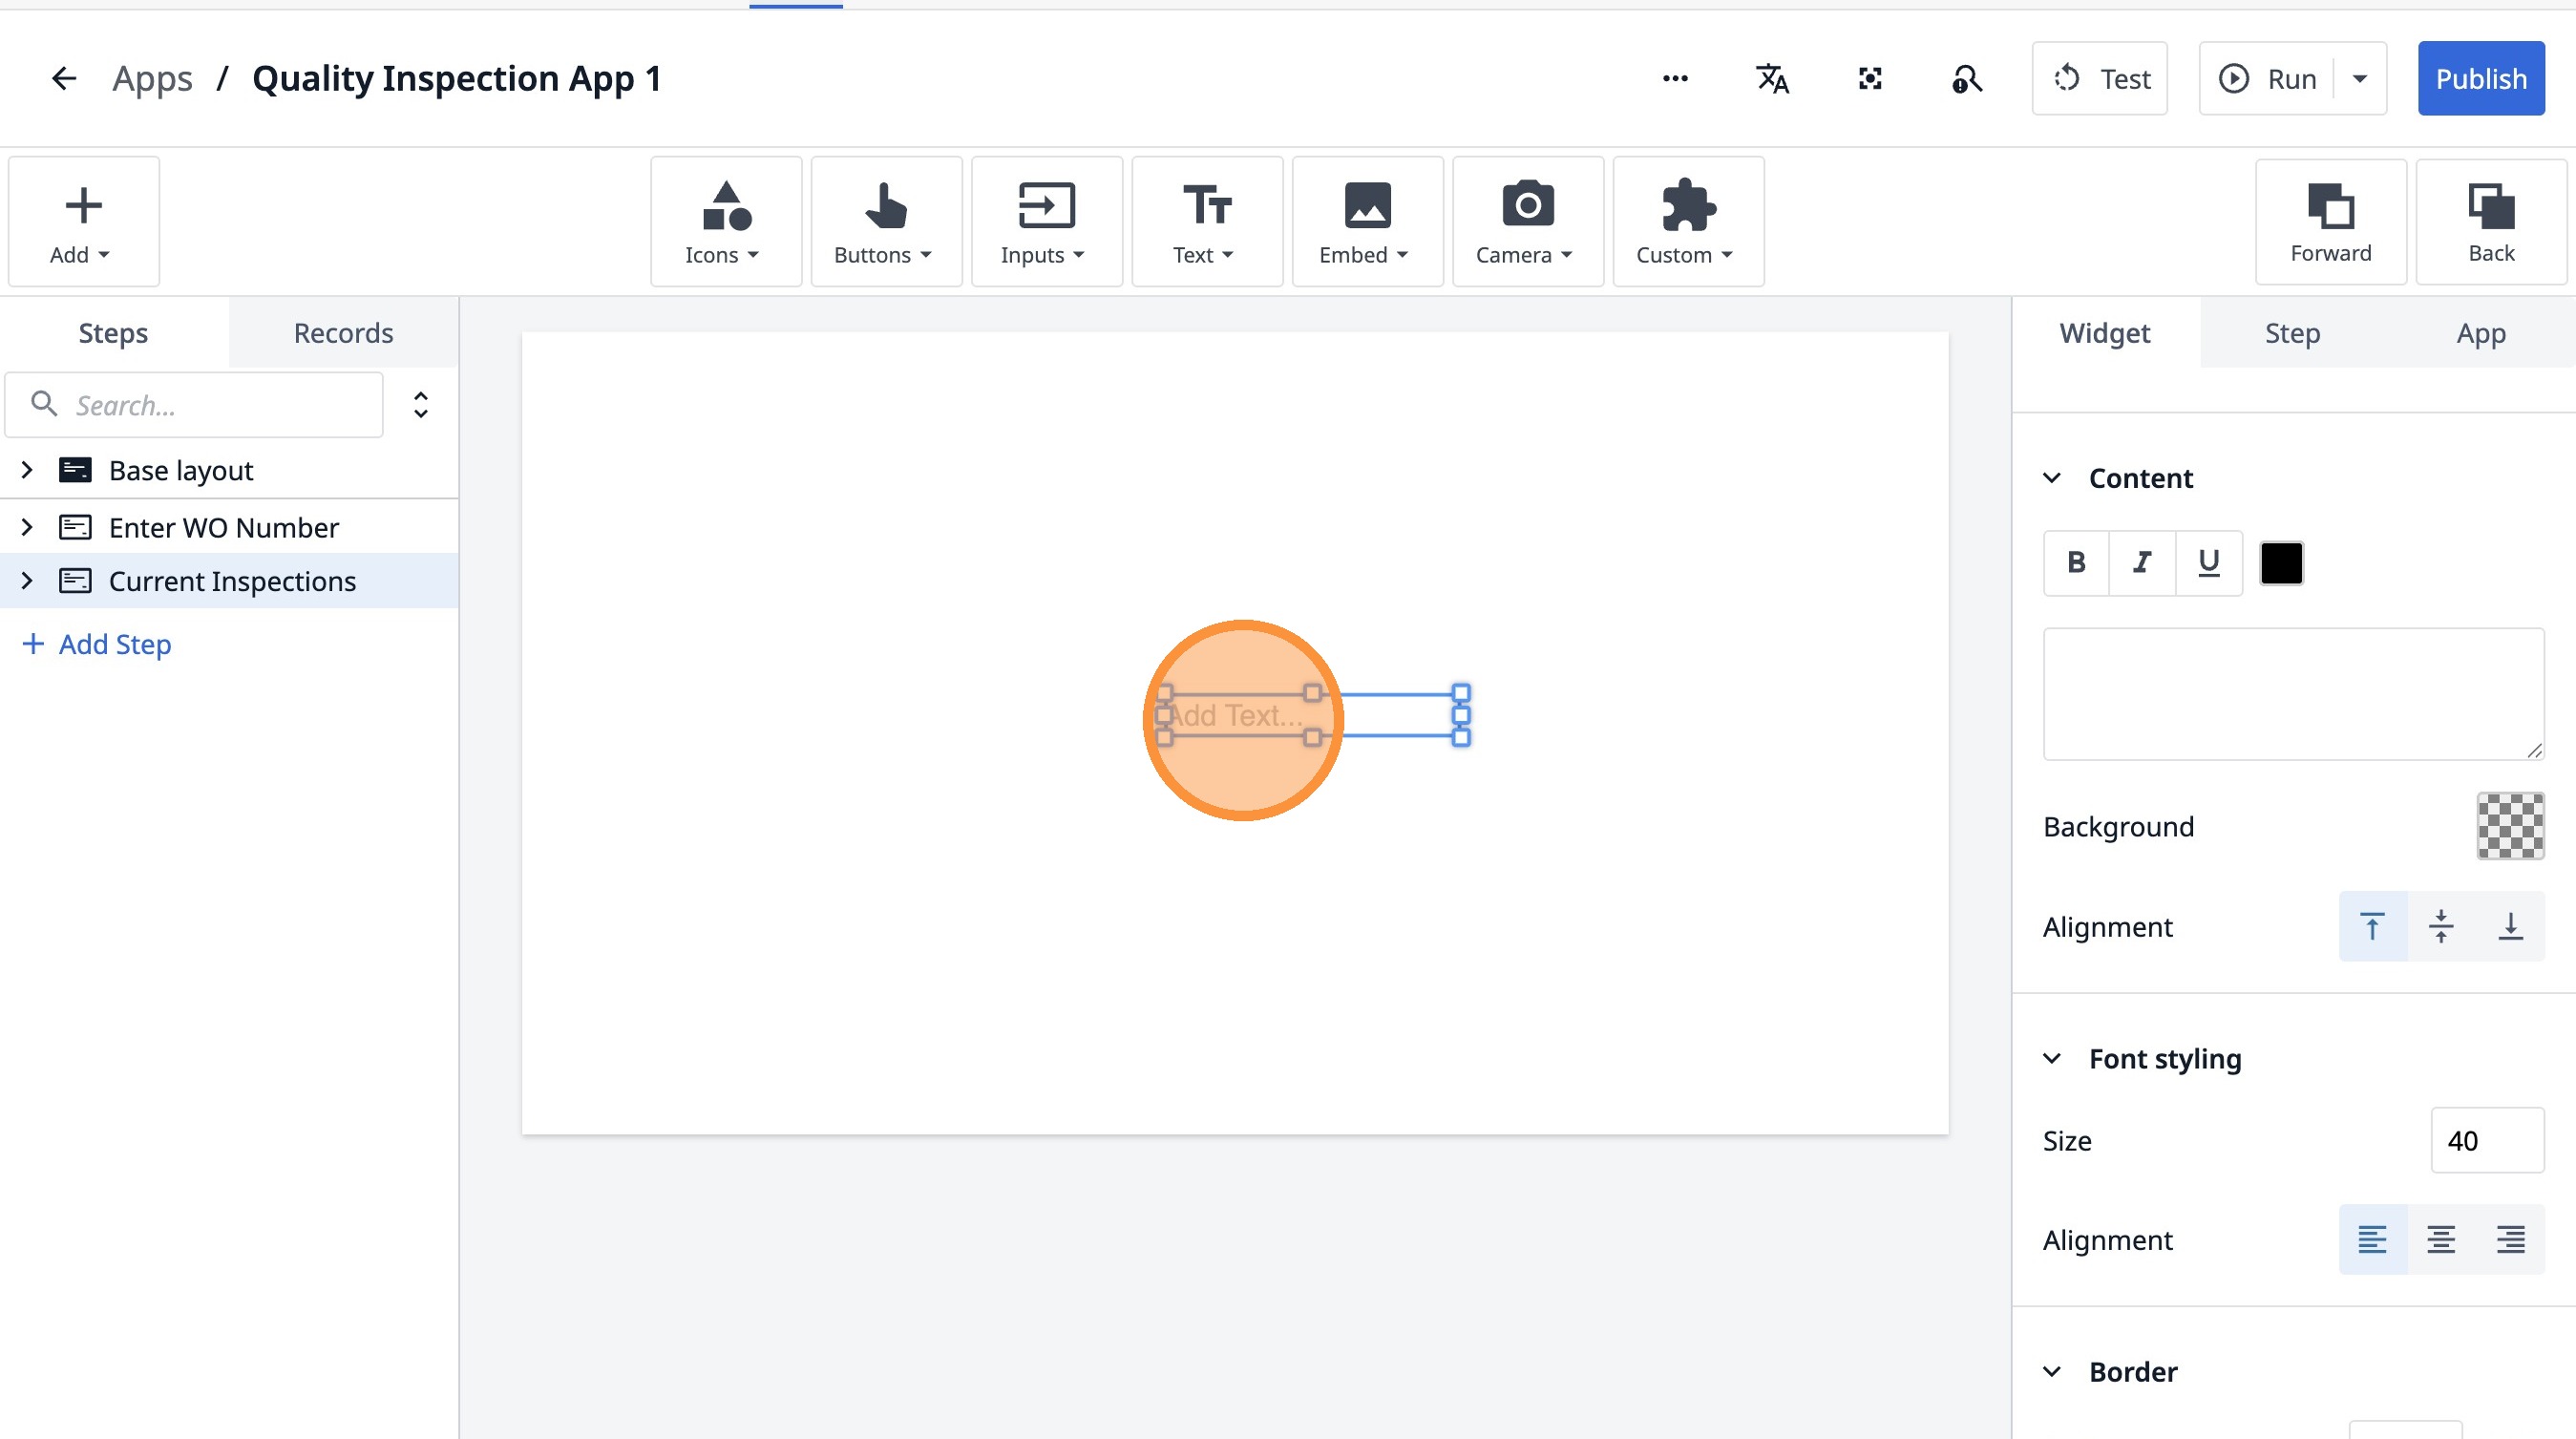
7. Click "Add Text..."
8. Double-click "Add Text..."
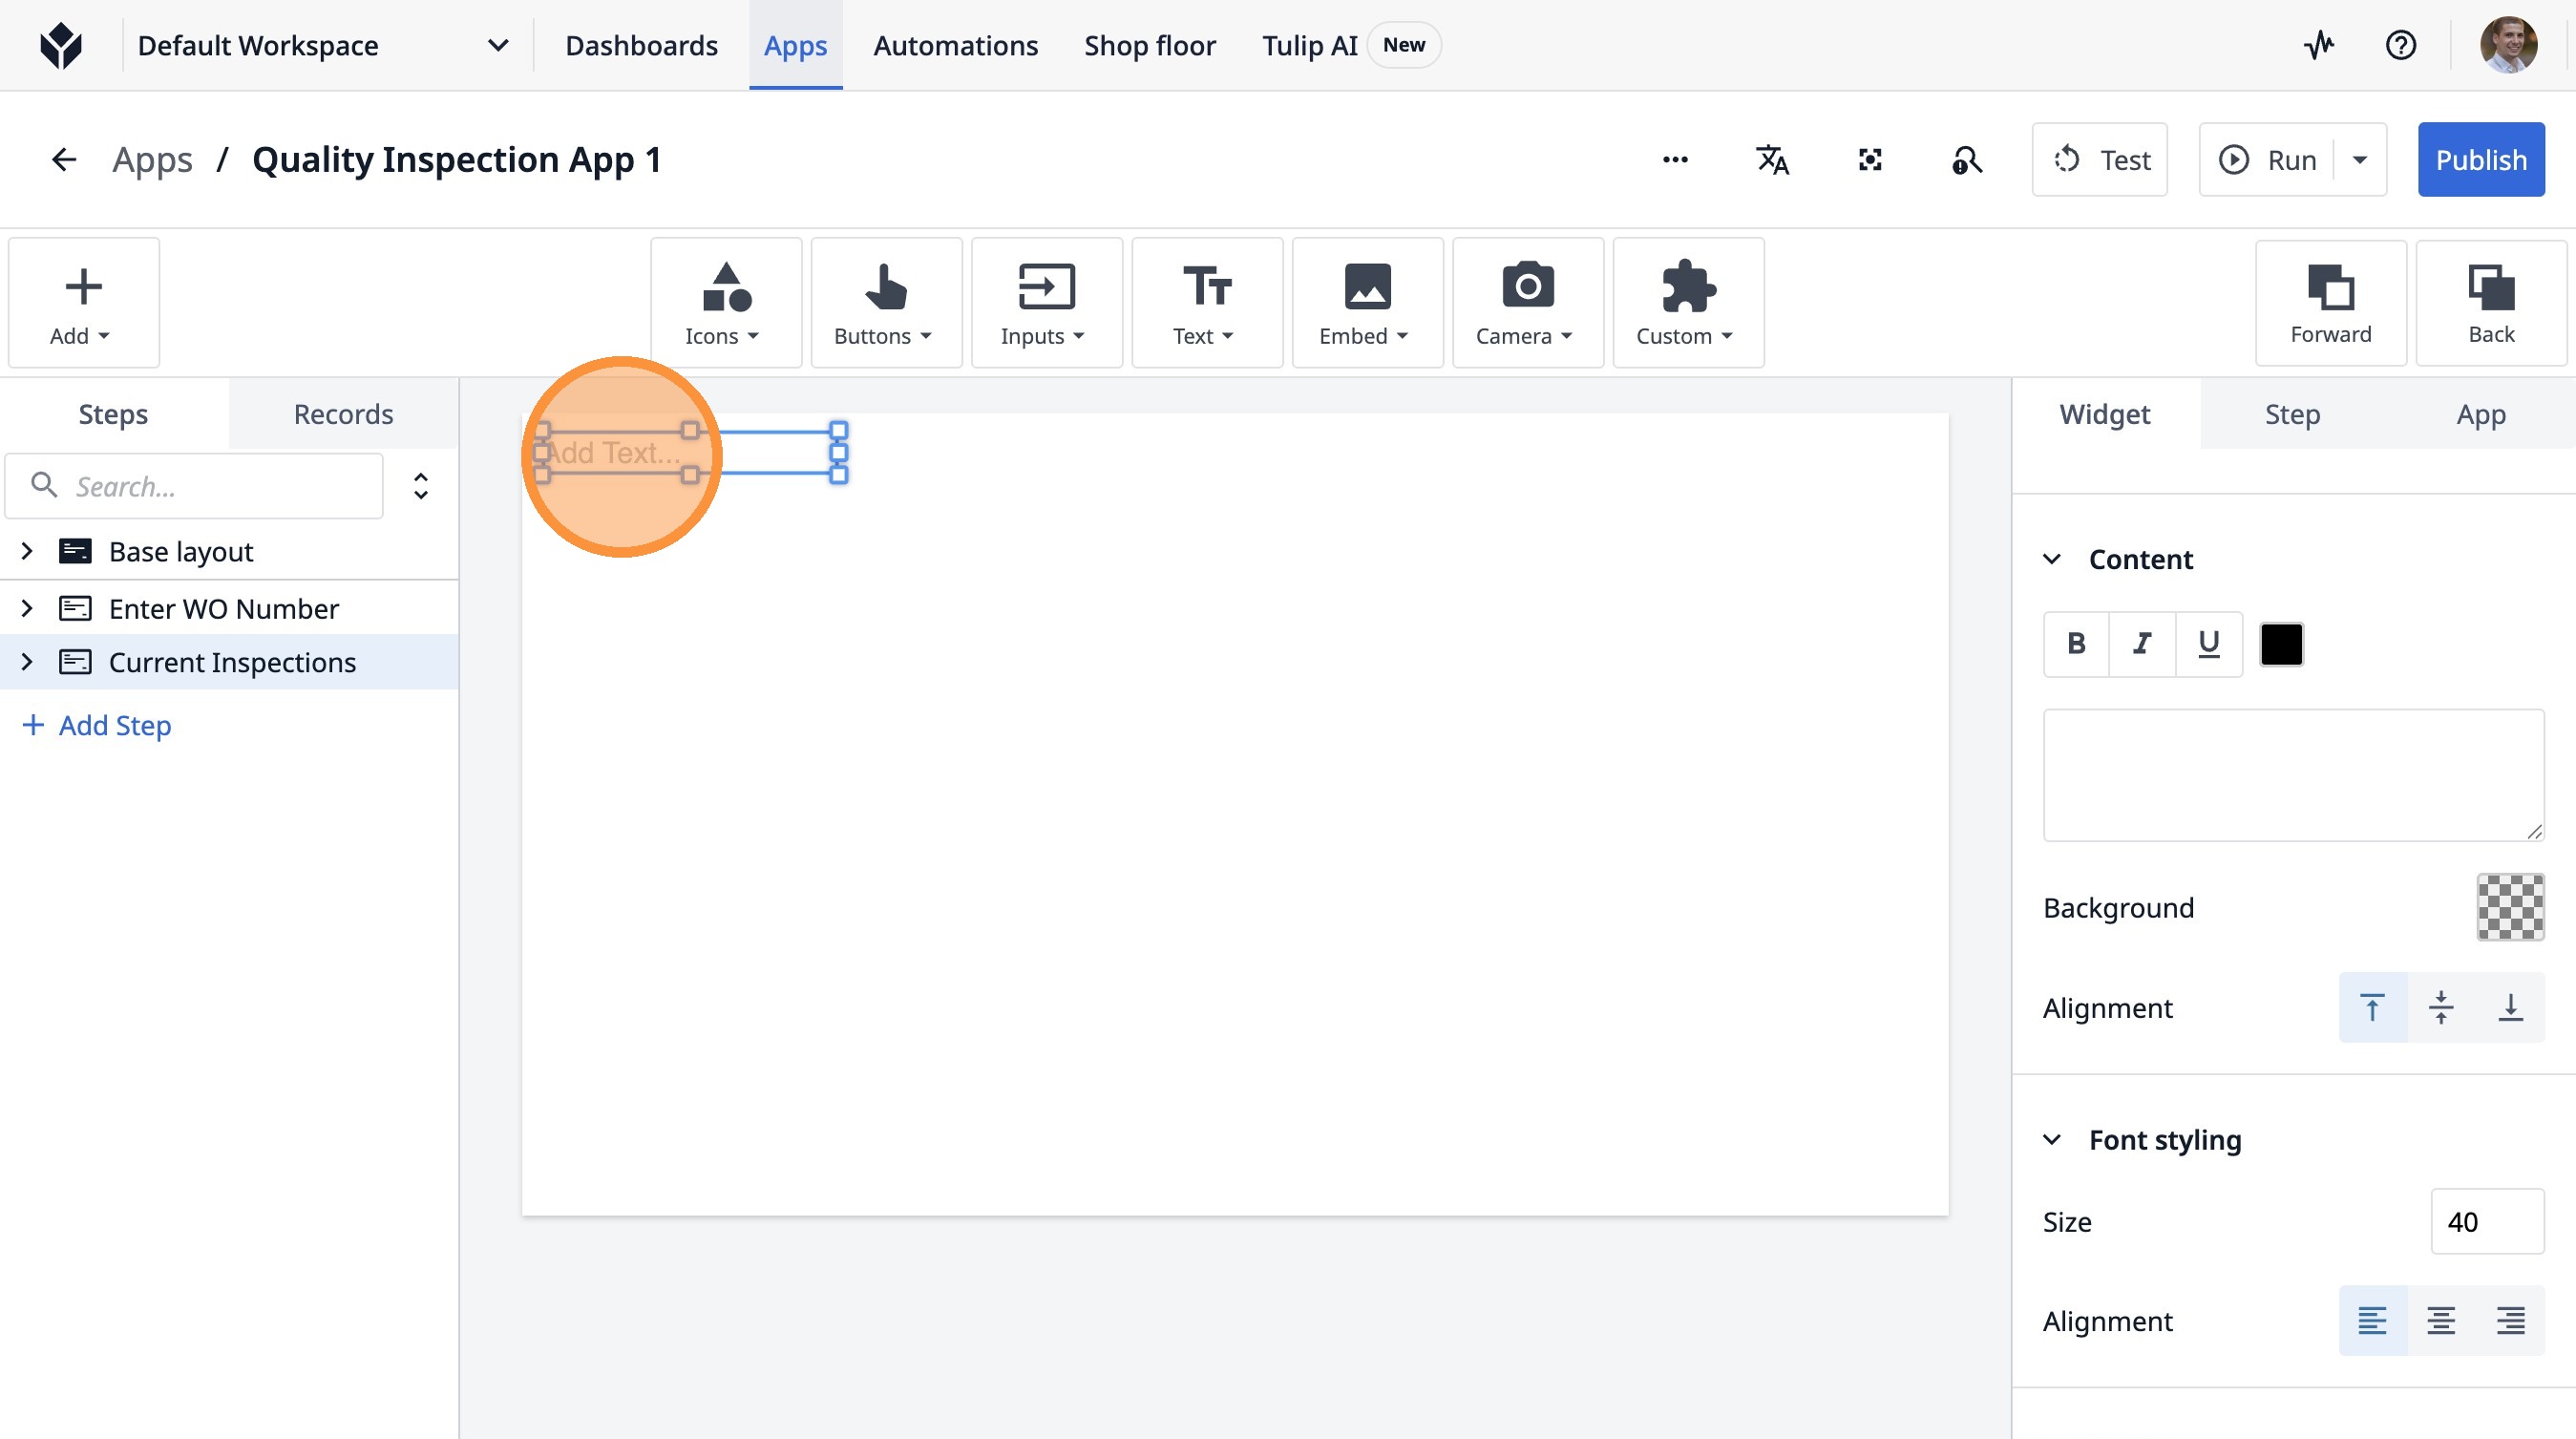
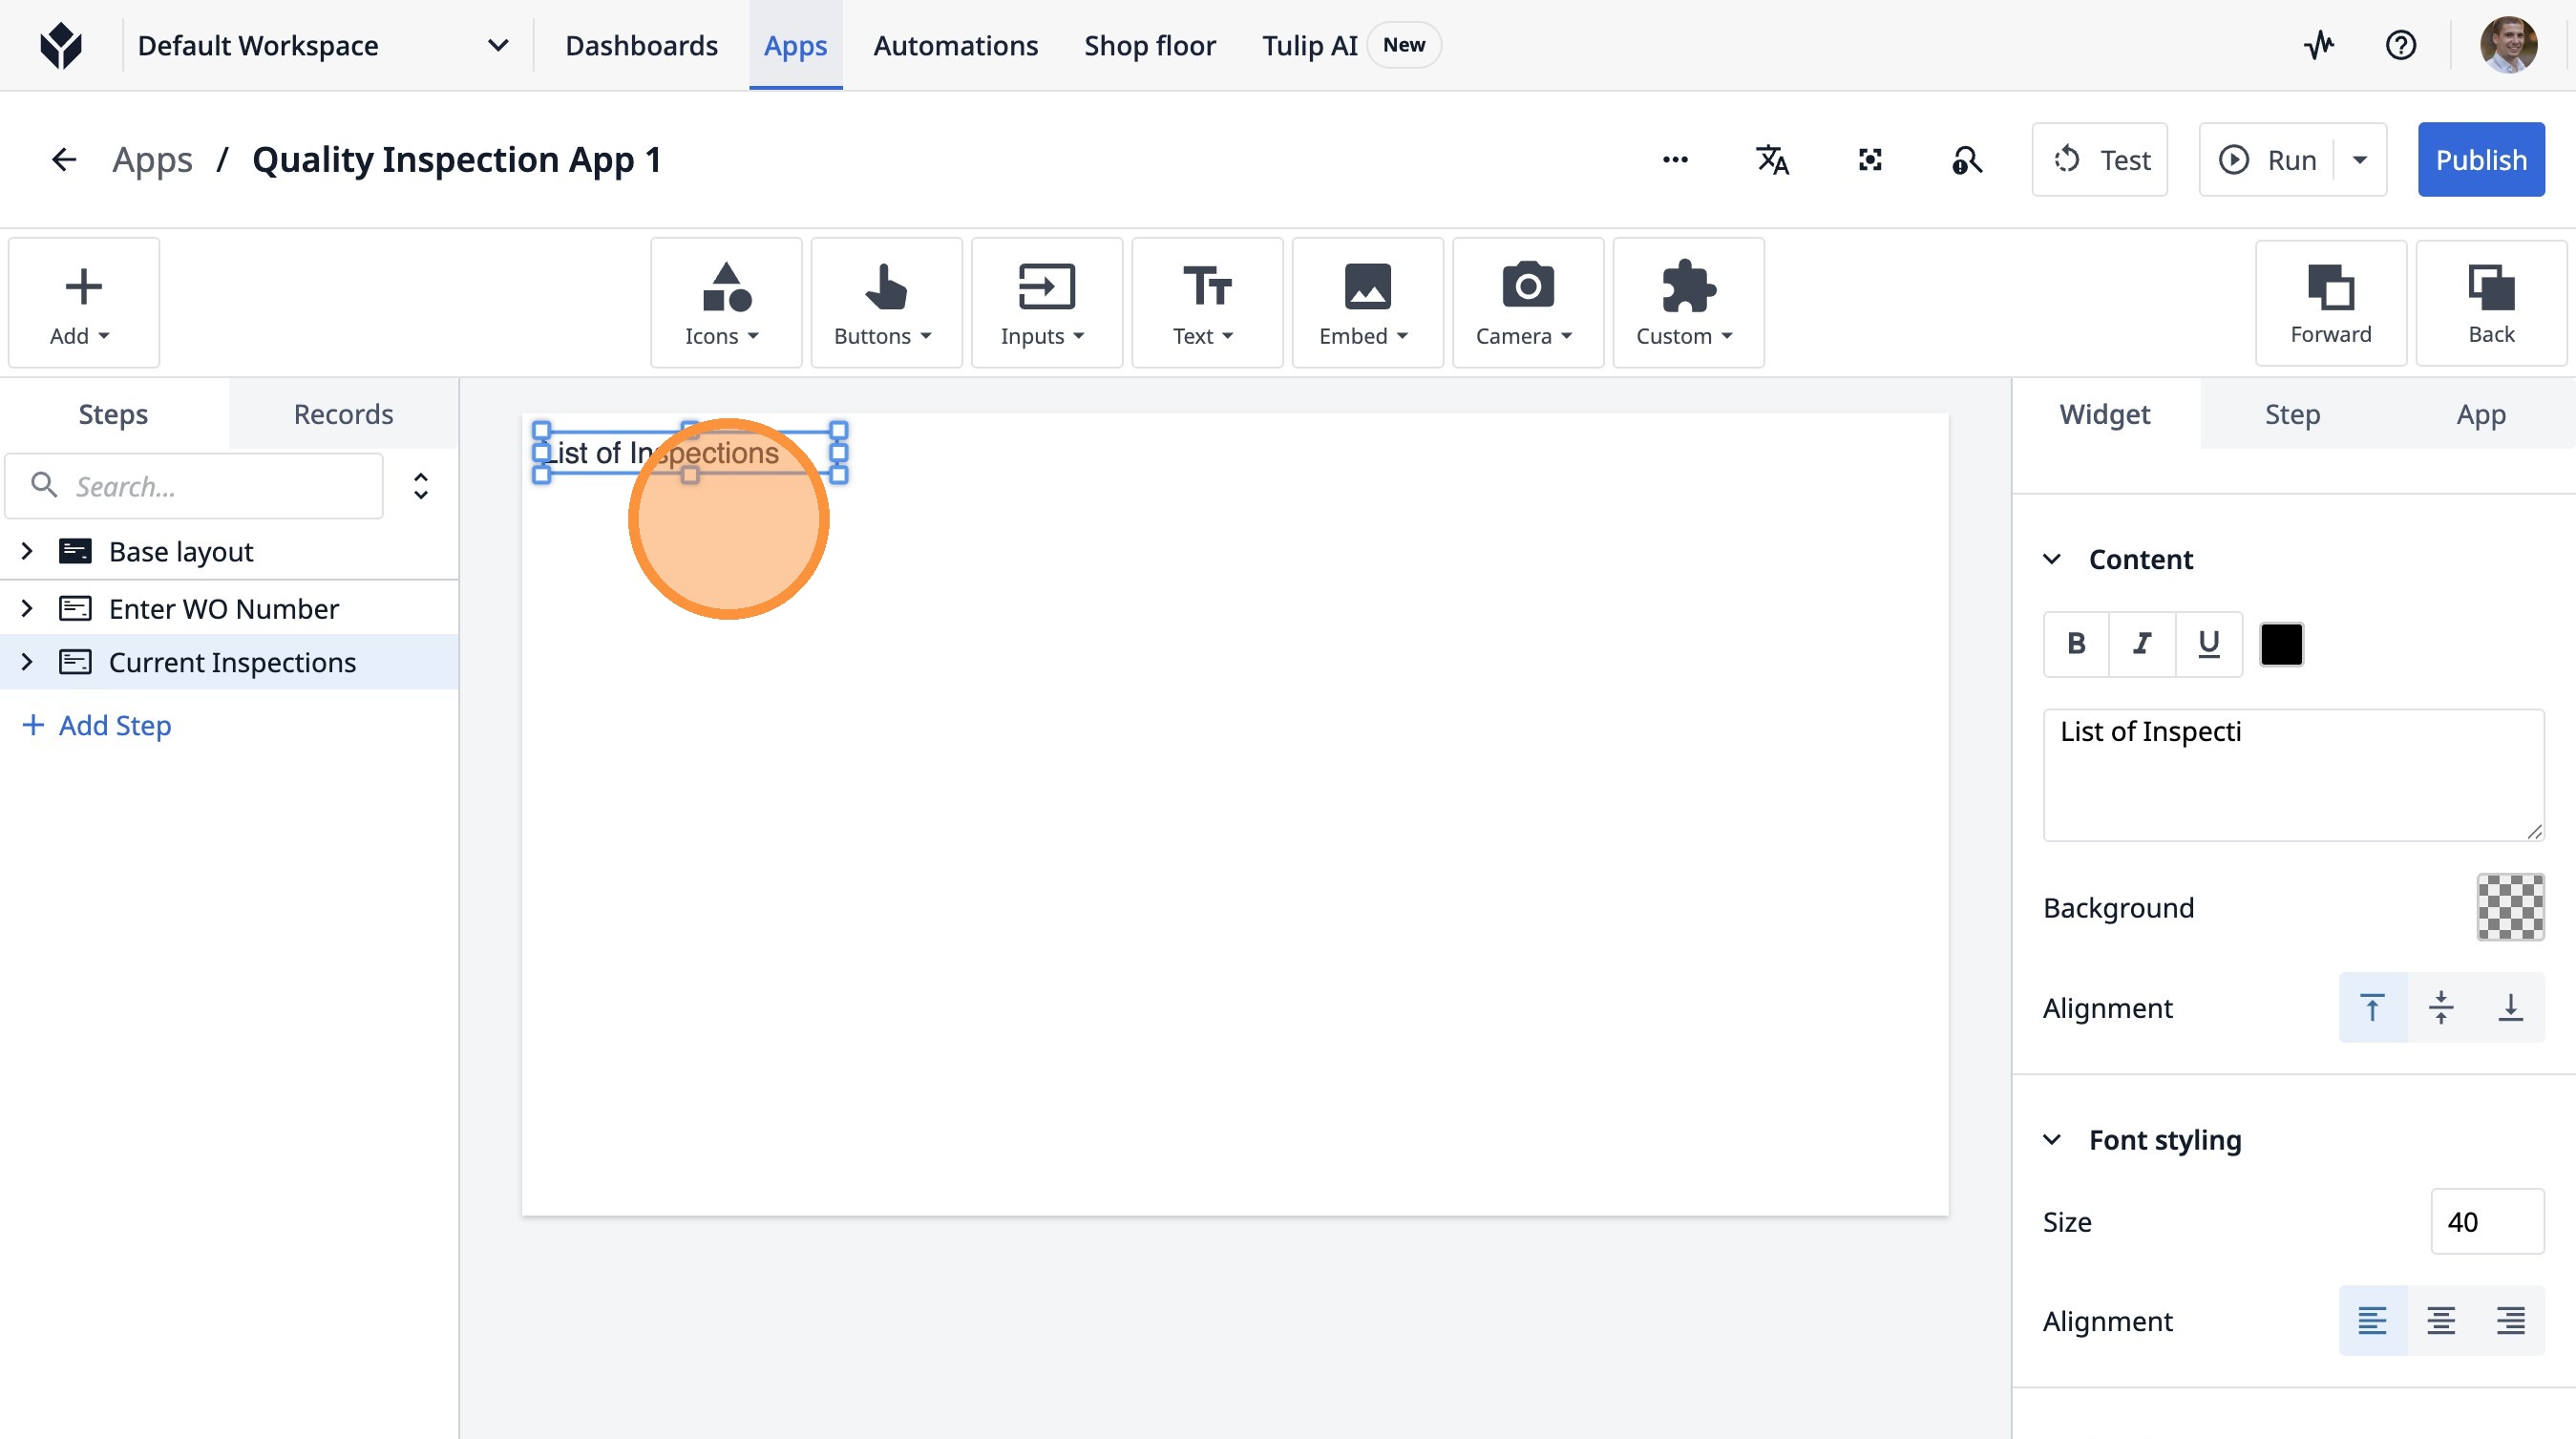
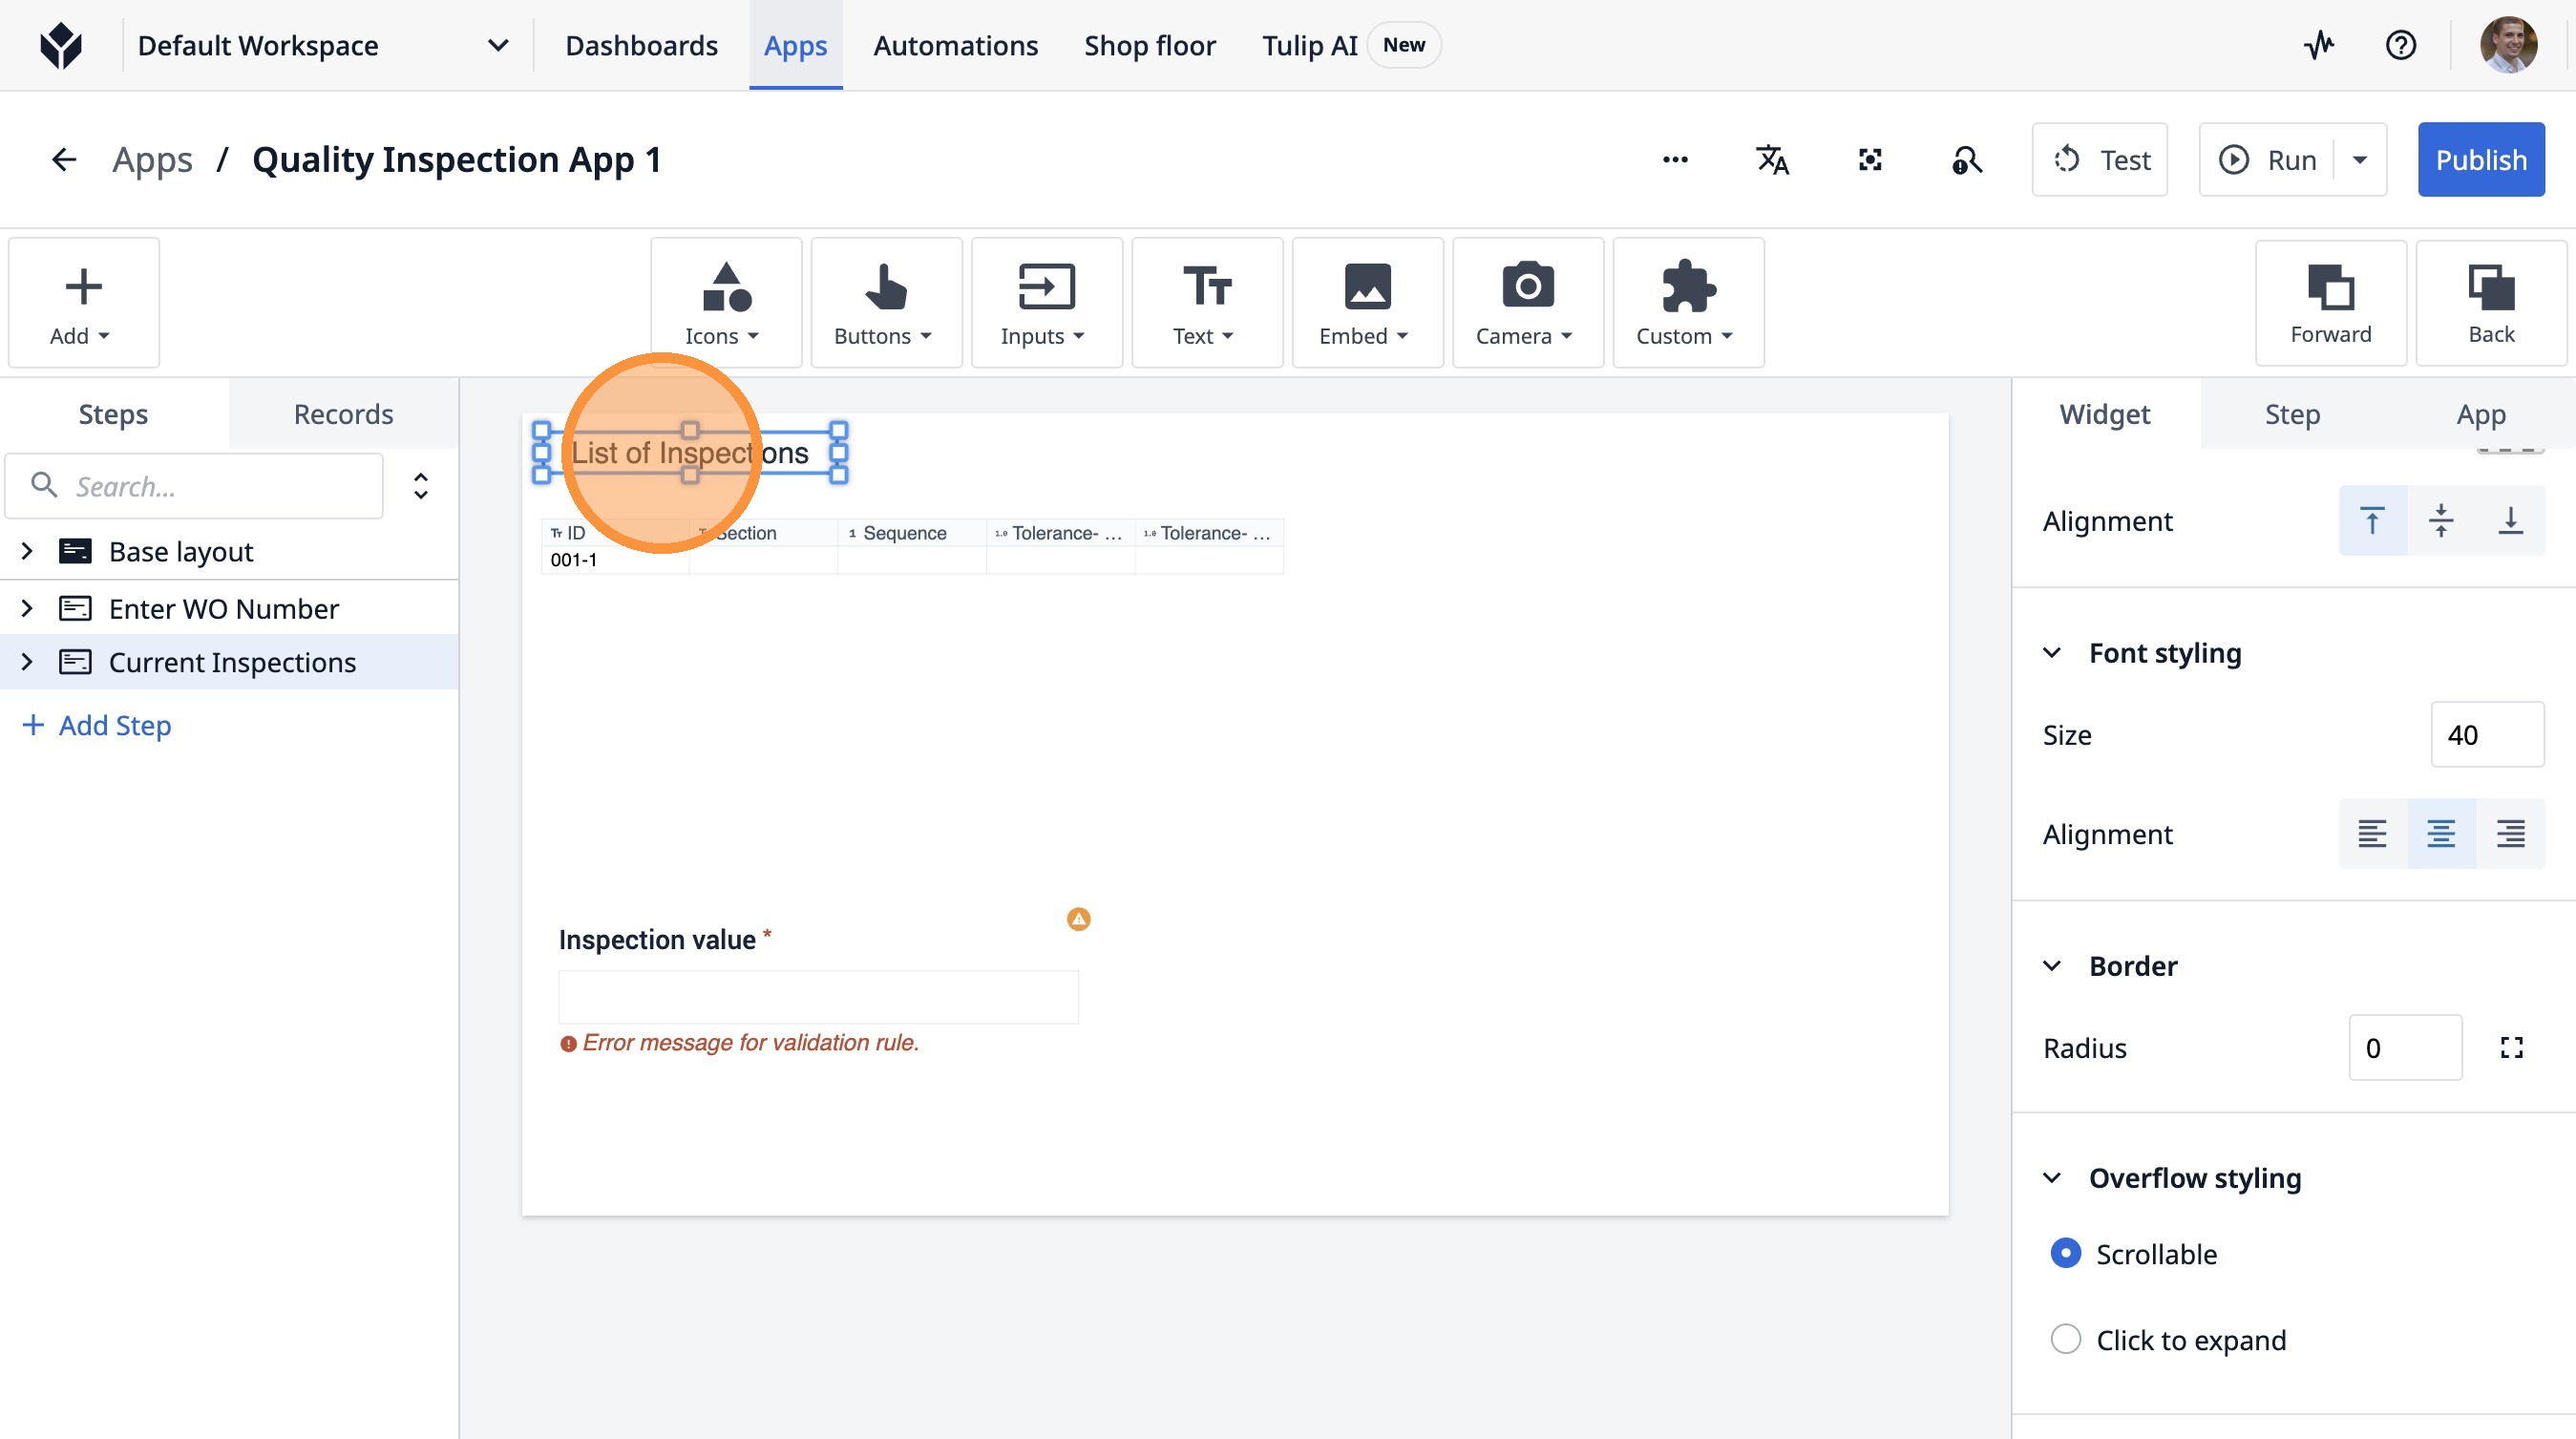
9. Type "List of Inspections"
10. Click here.
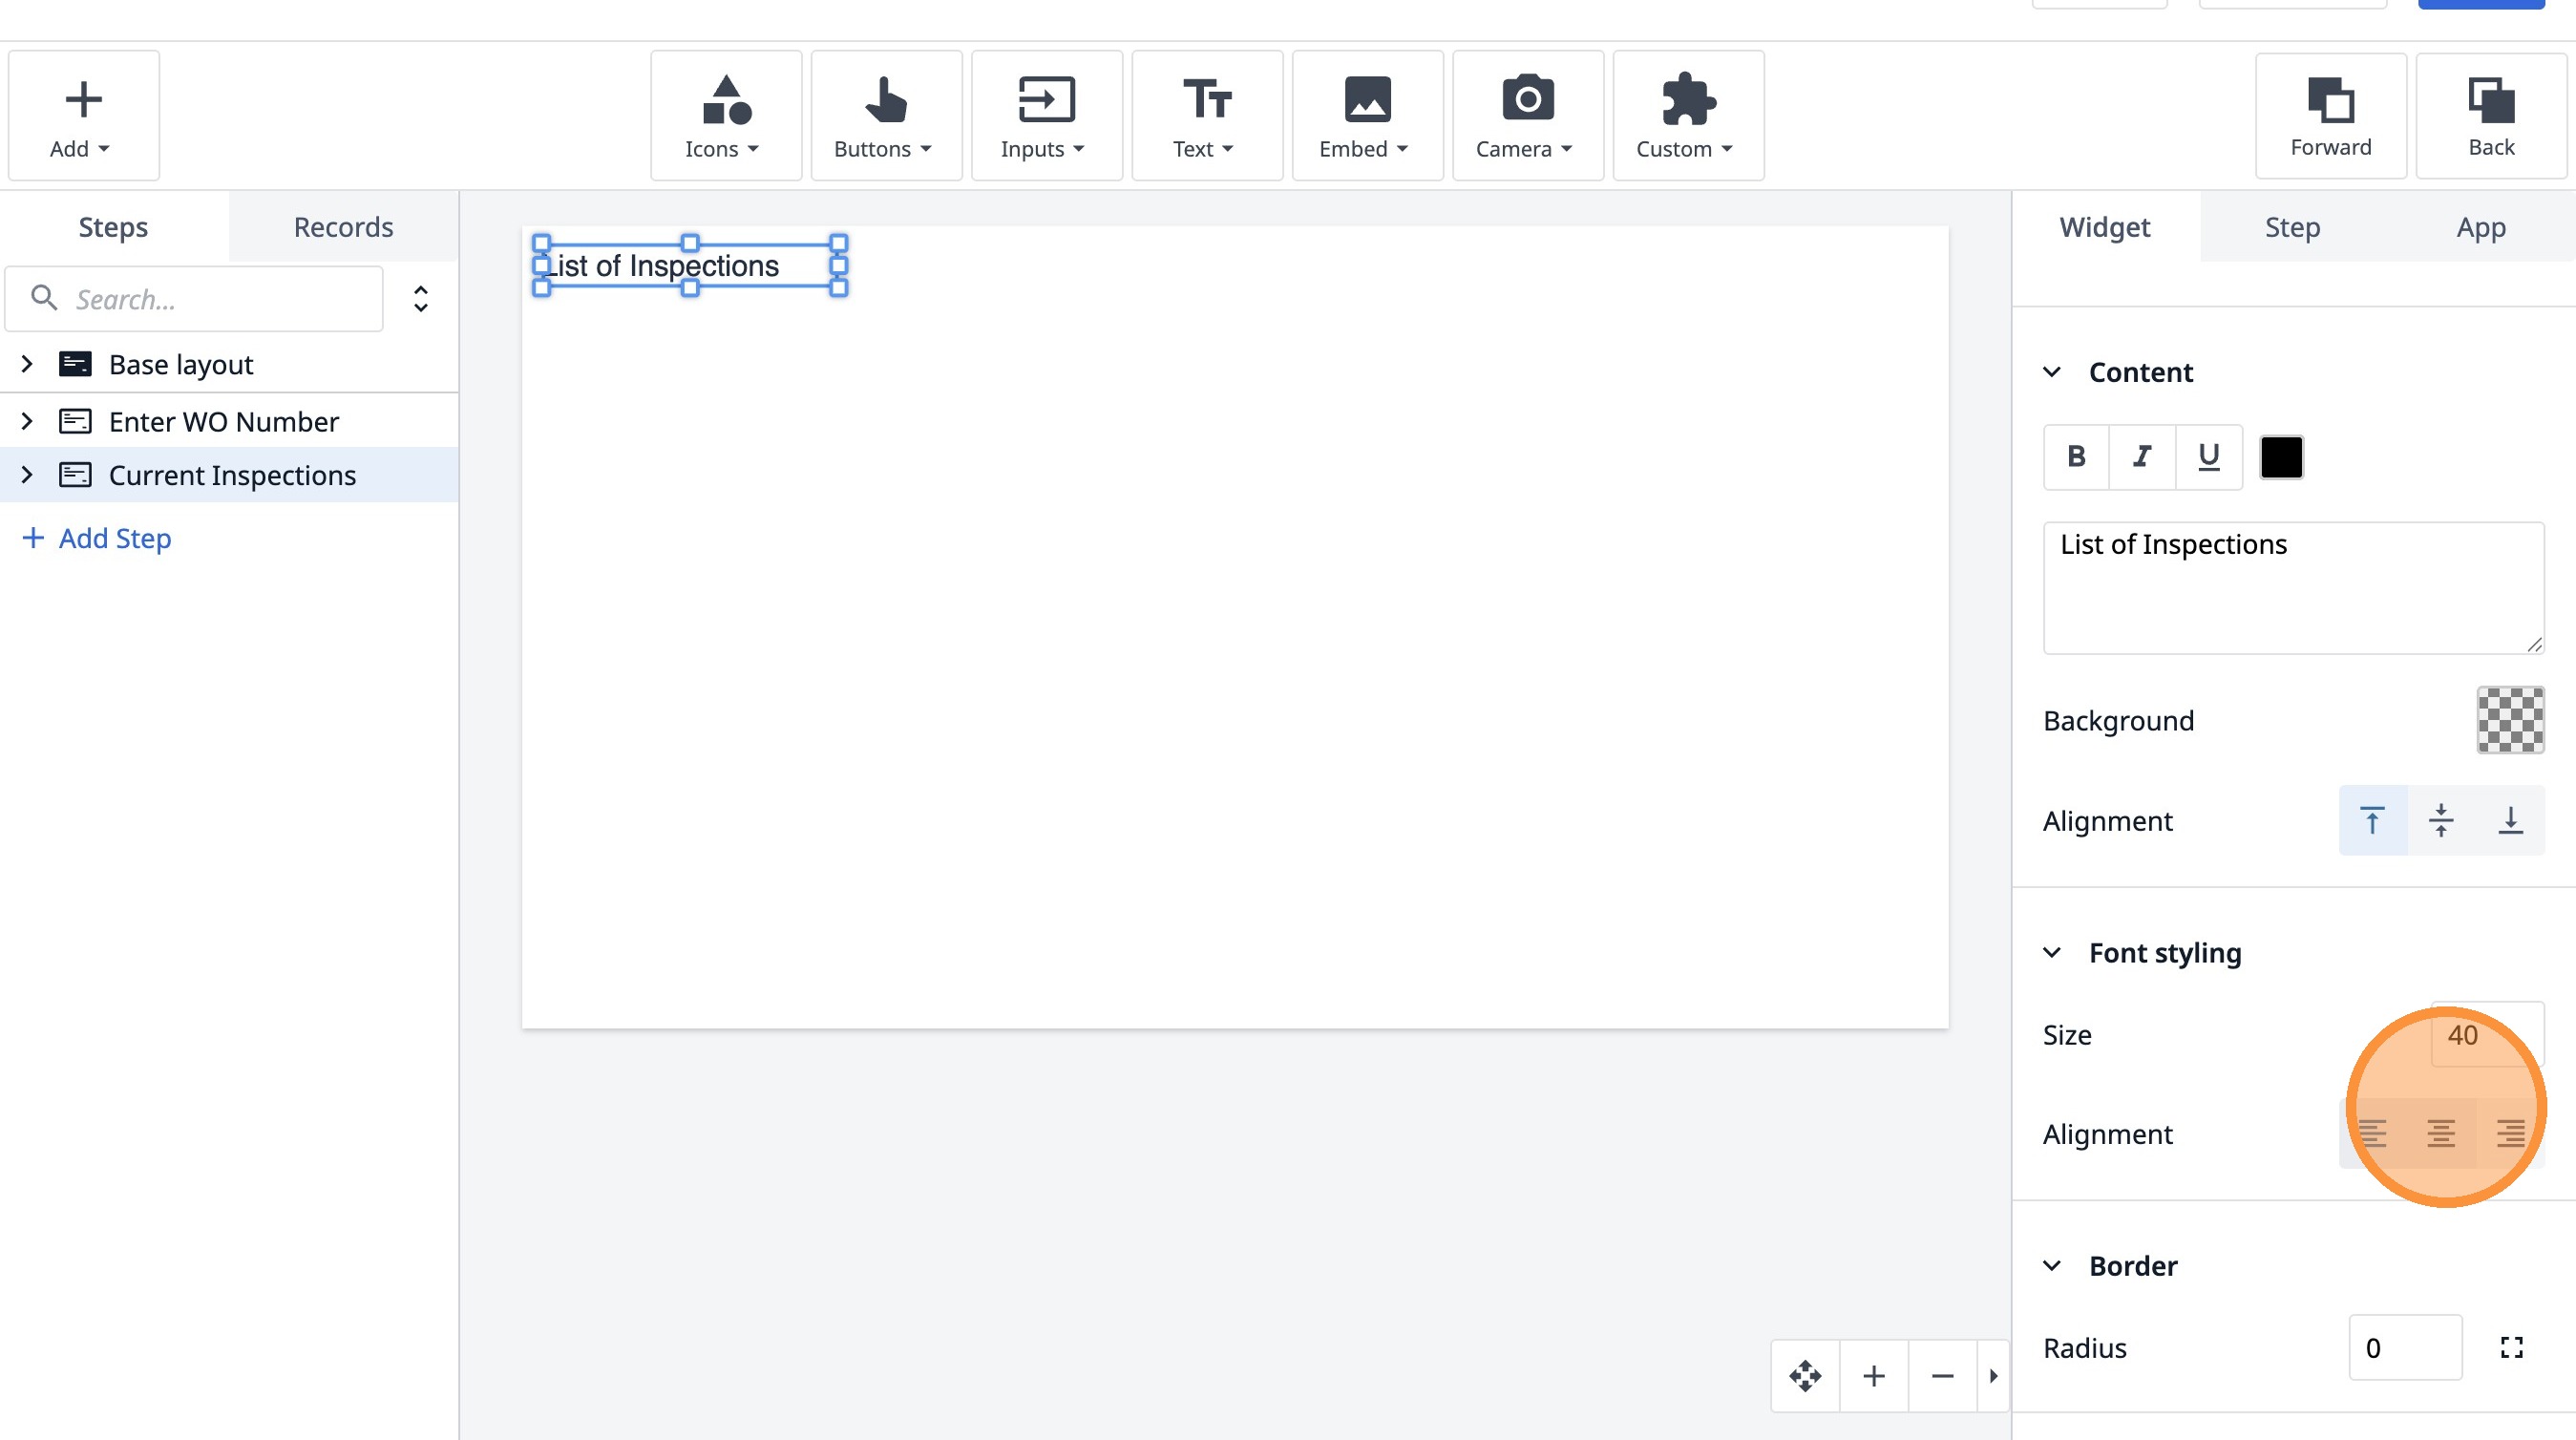
11. Click "List of Inspections"
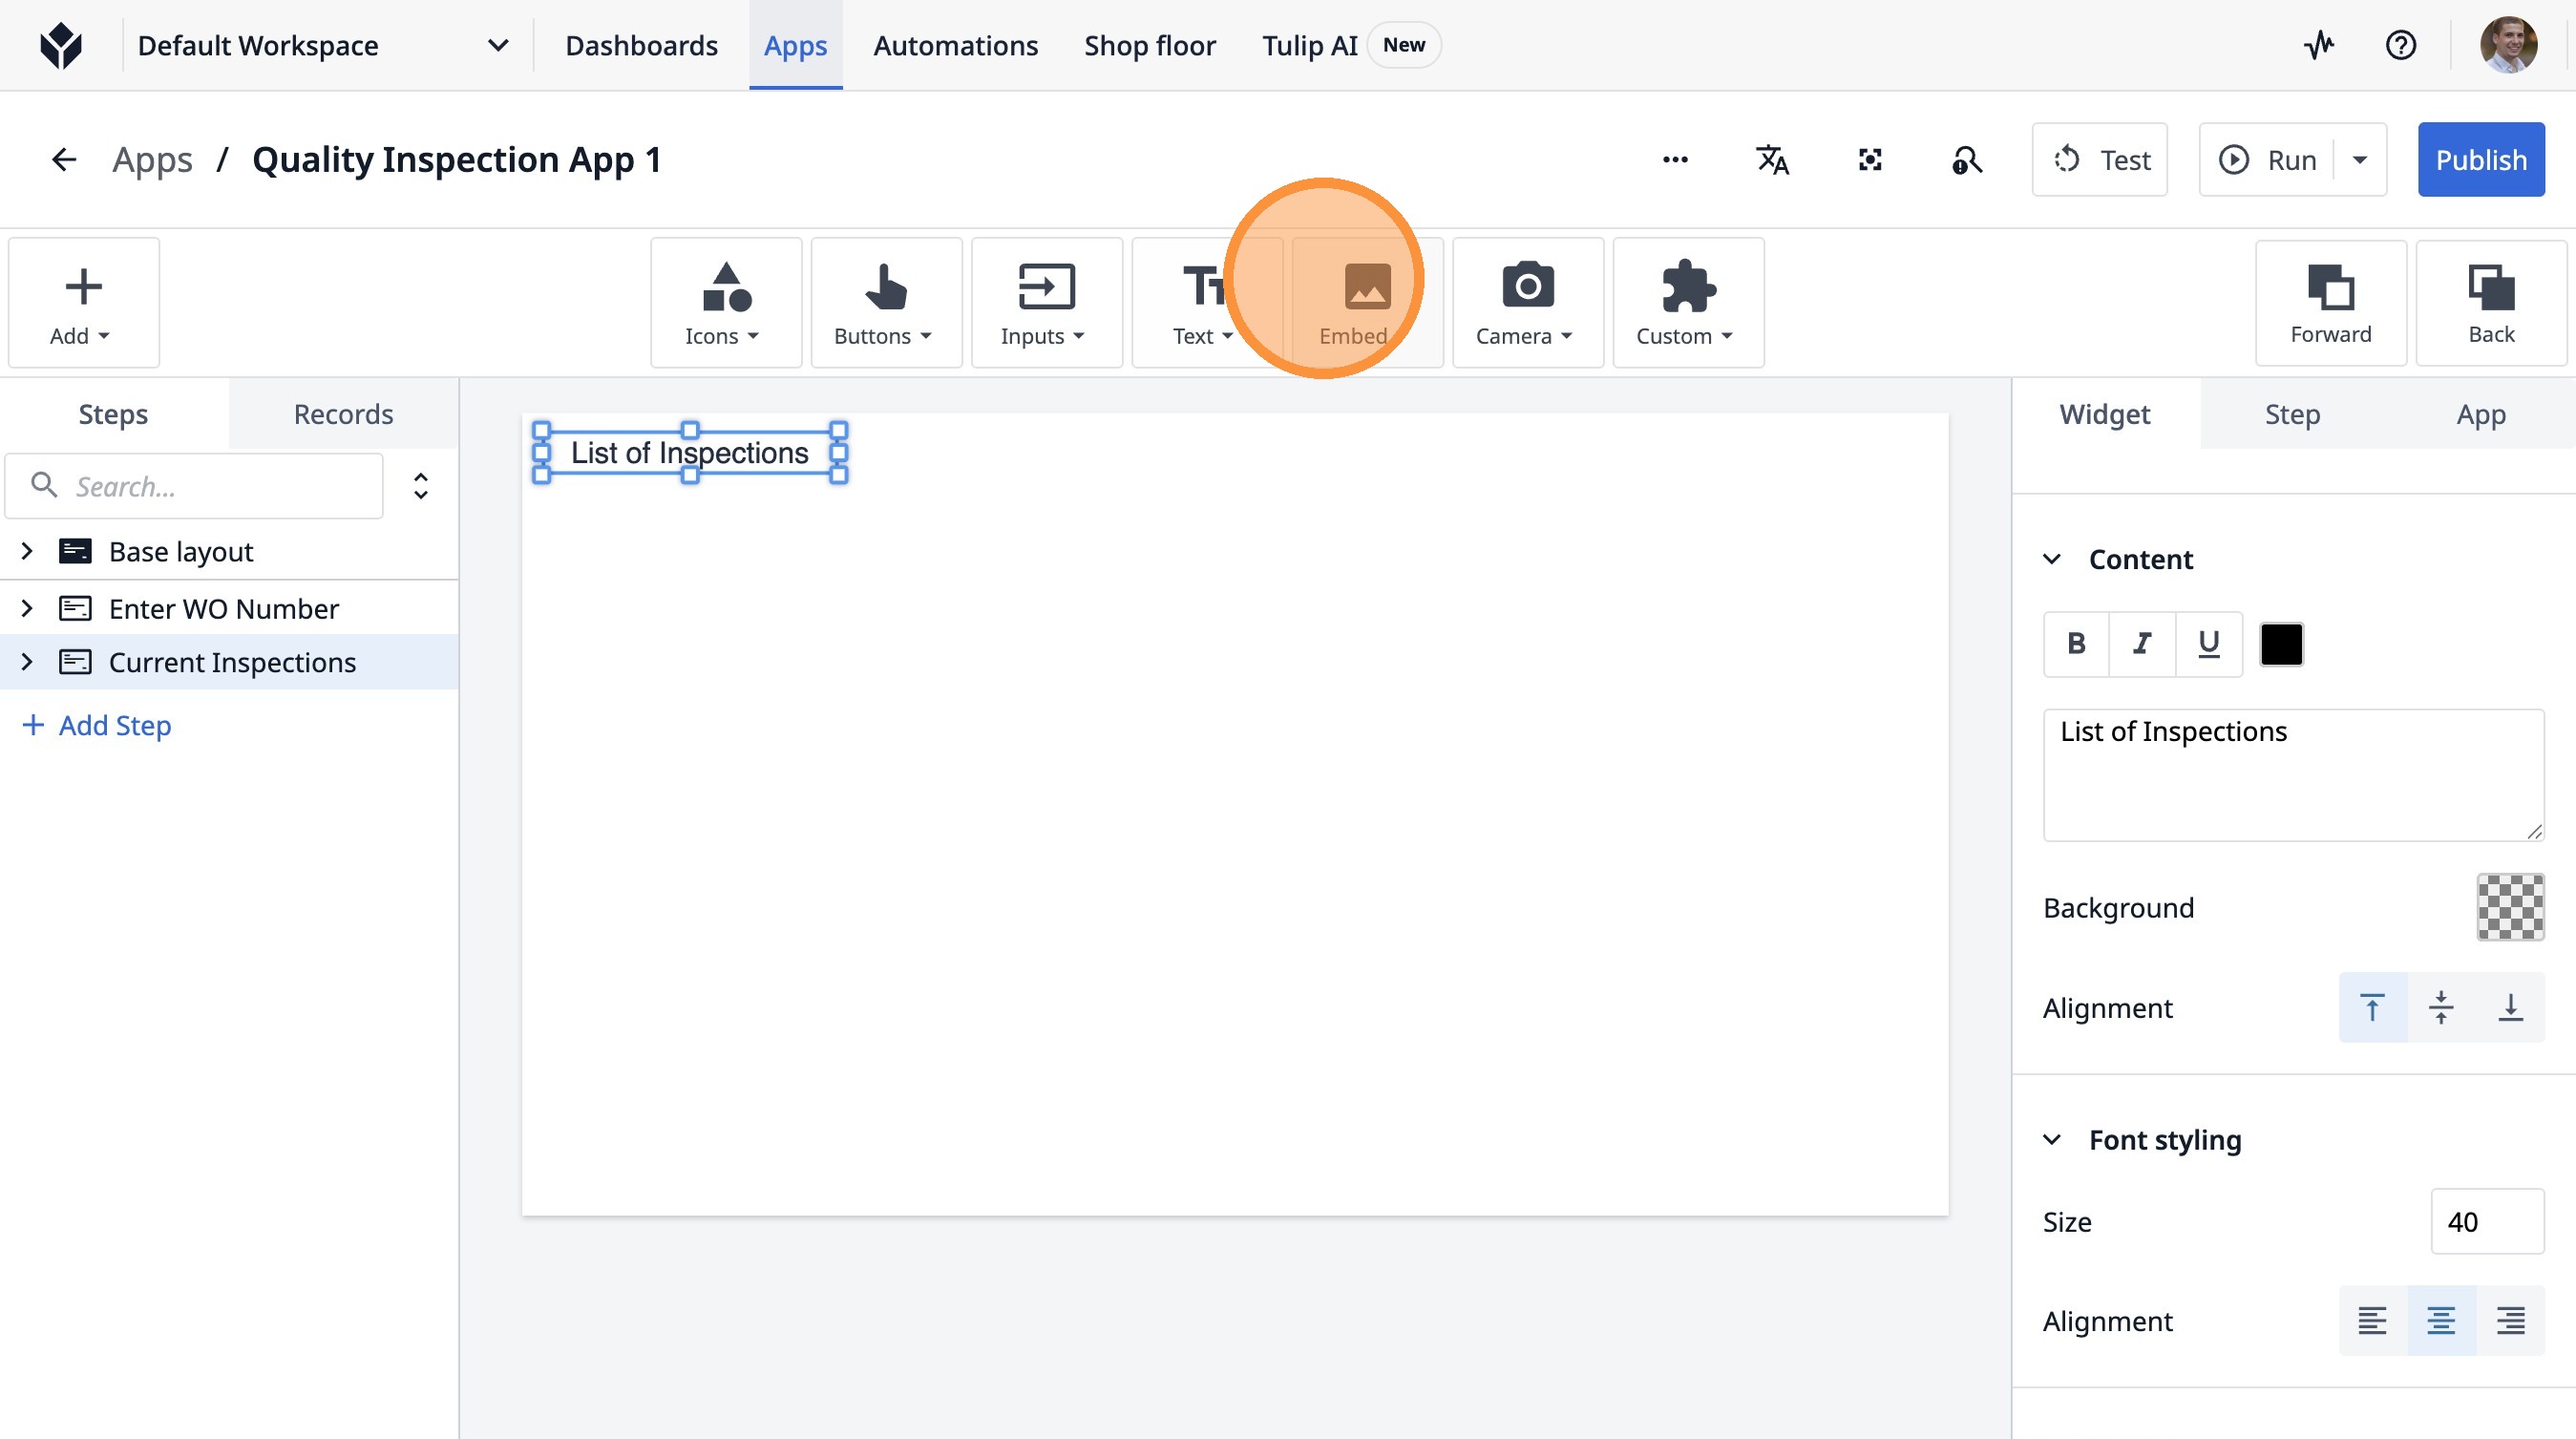
12. Click this button.
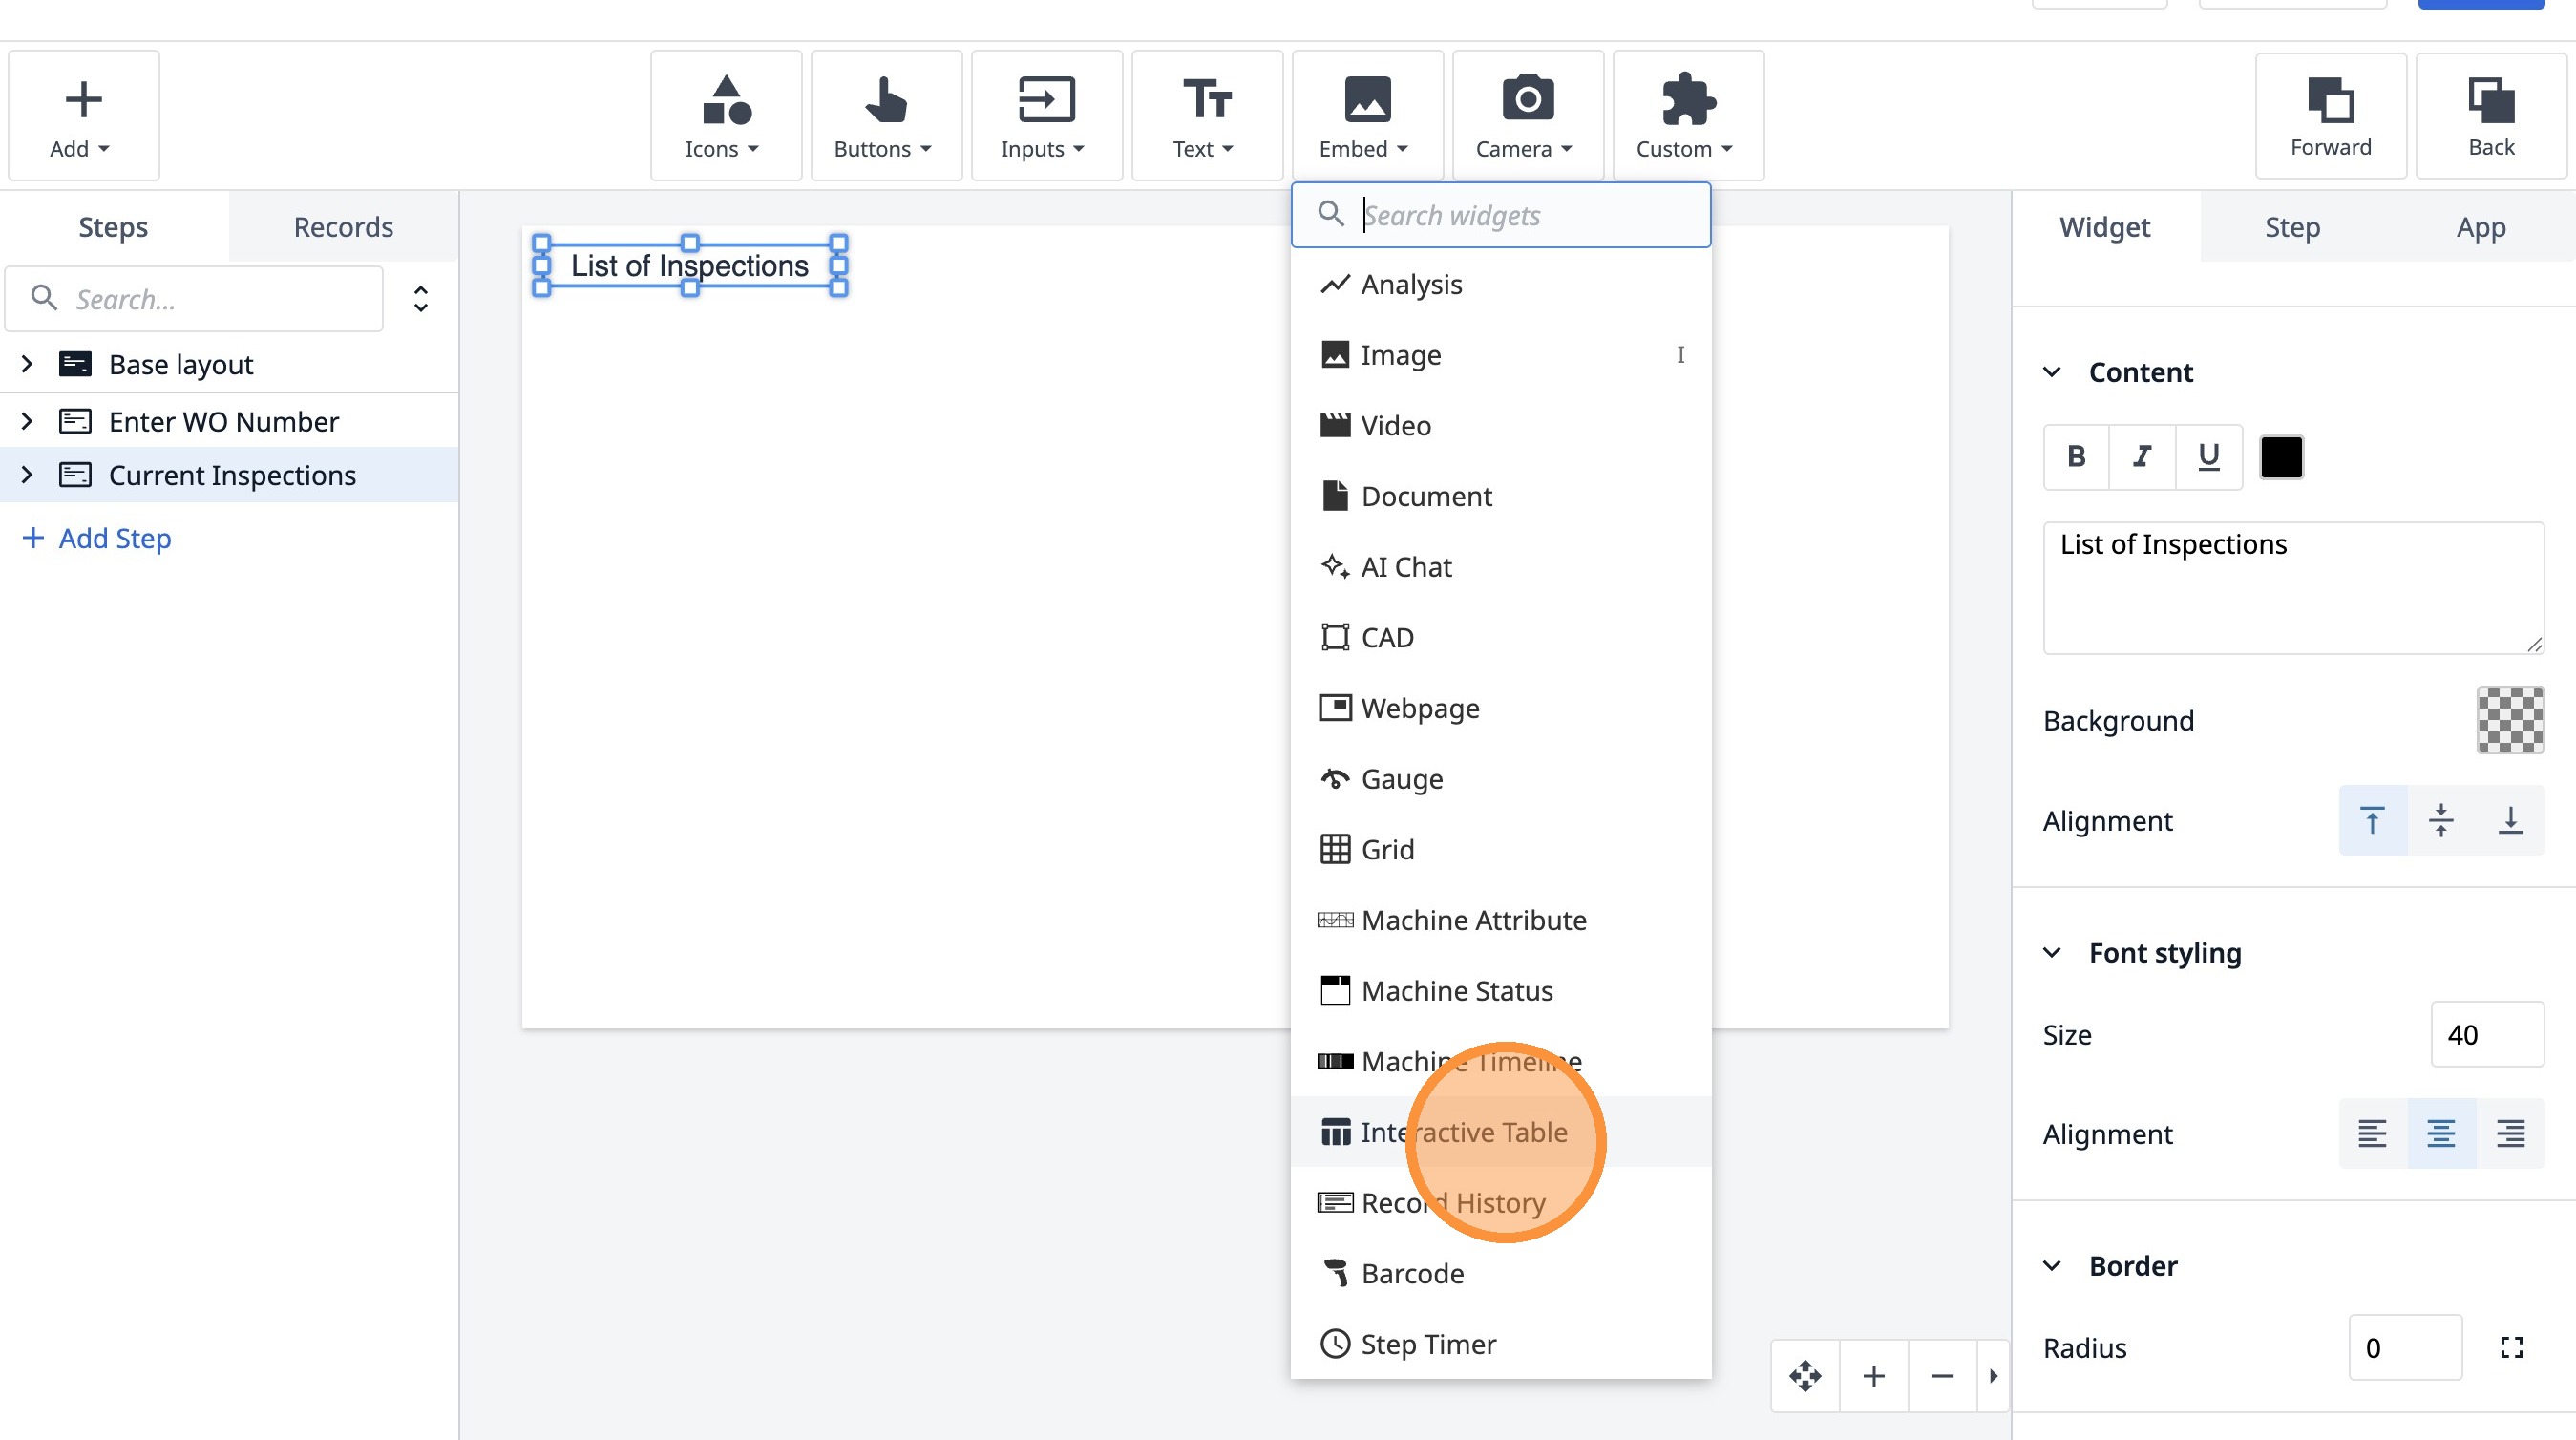
13. Click "Embed"
14. Click "Interactive Table"
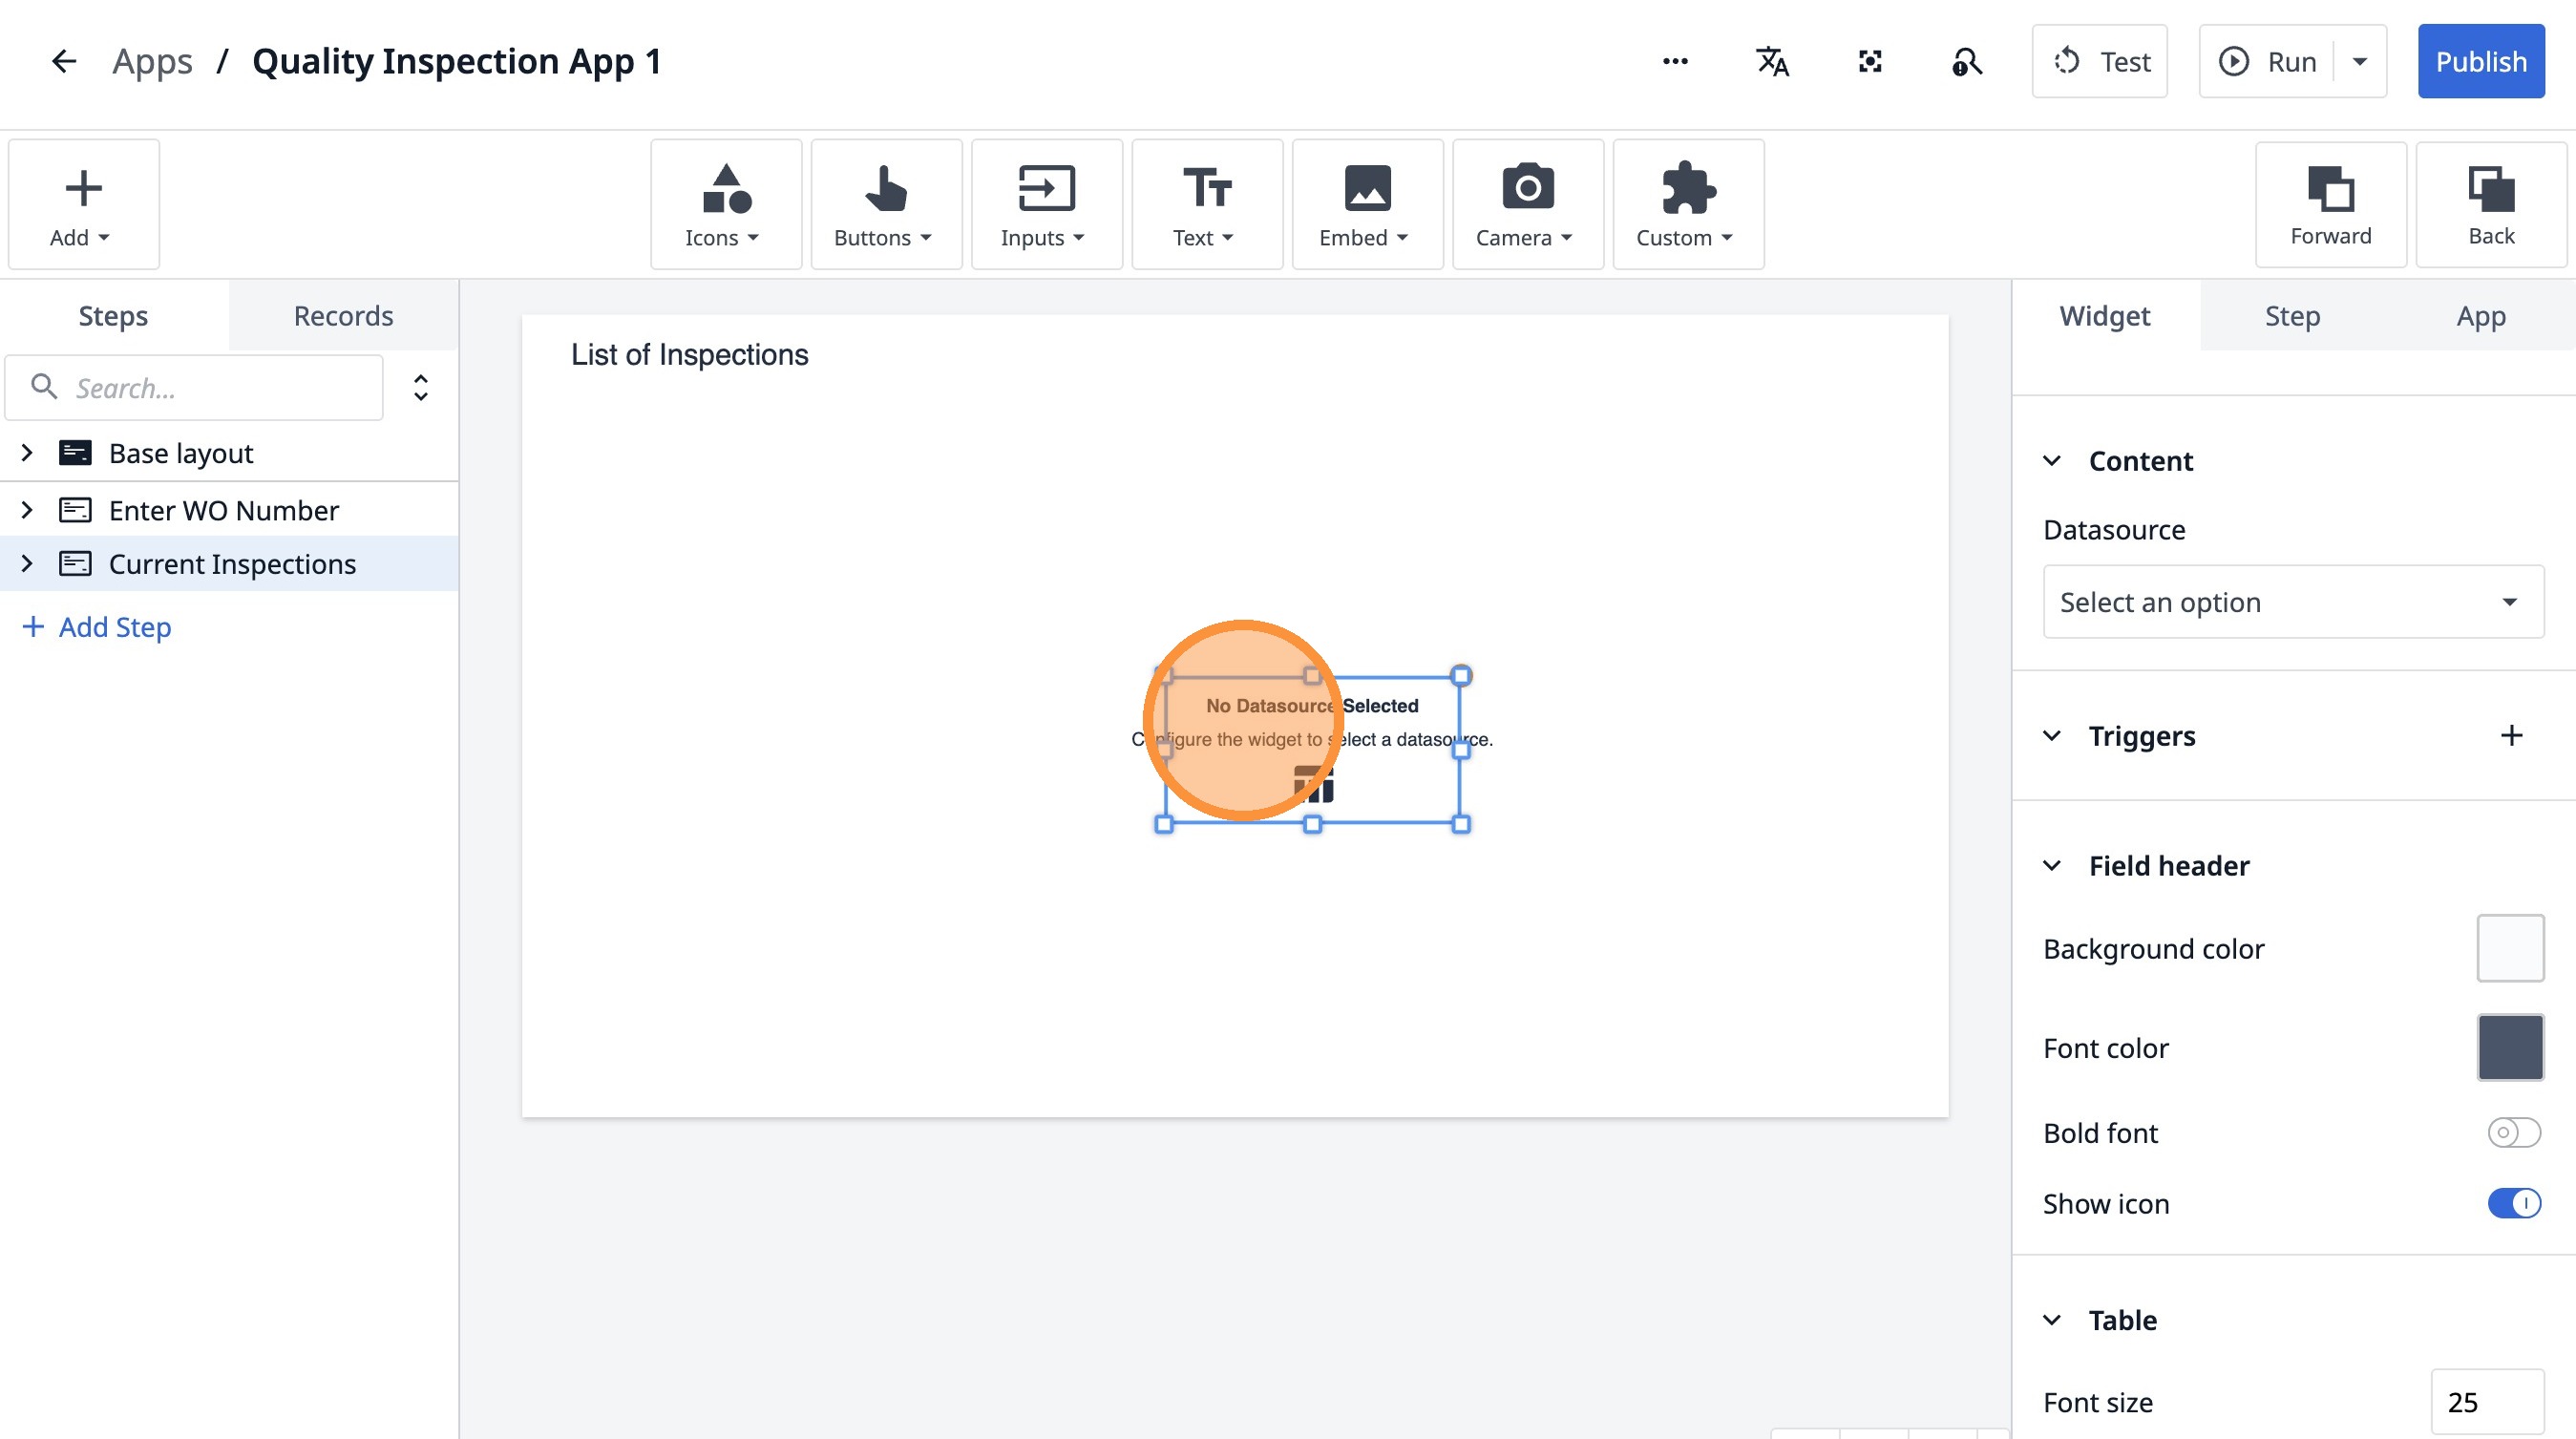
15. Click "No Datasource SelectedConfigure the widget to select a datasource."
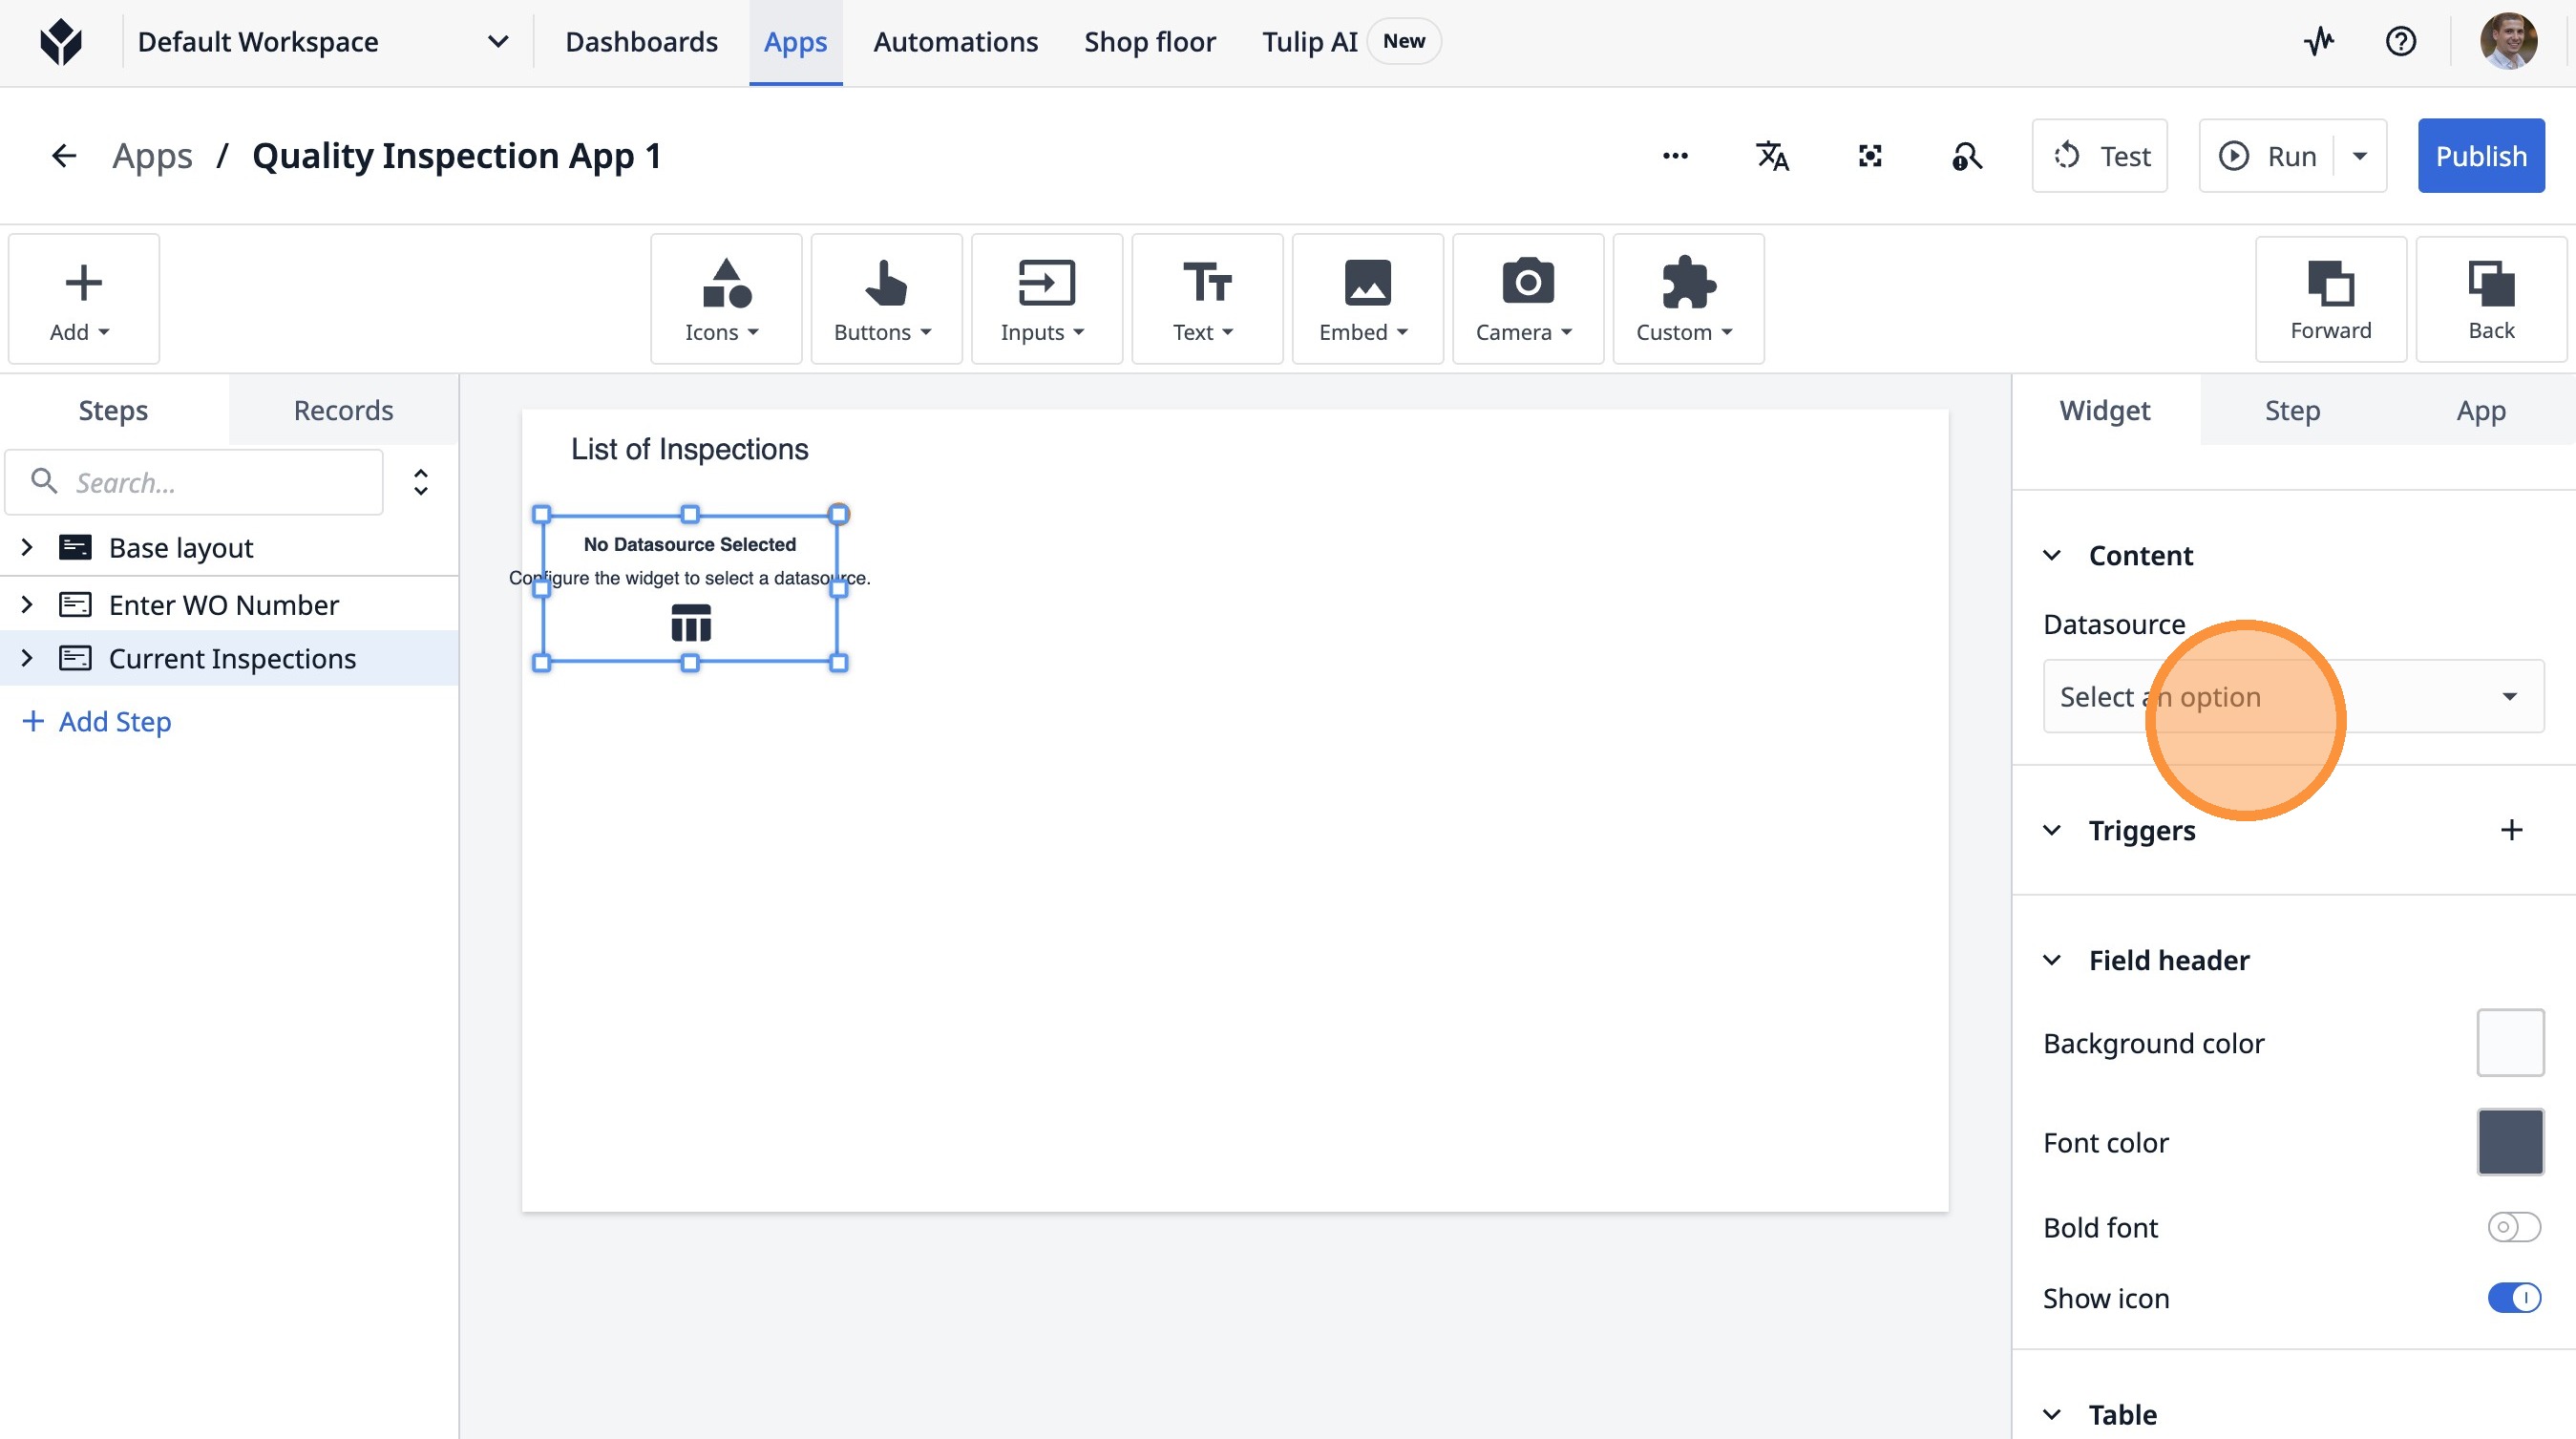
16. Click "Select an option"
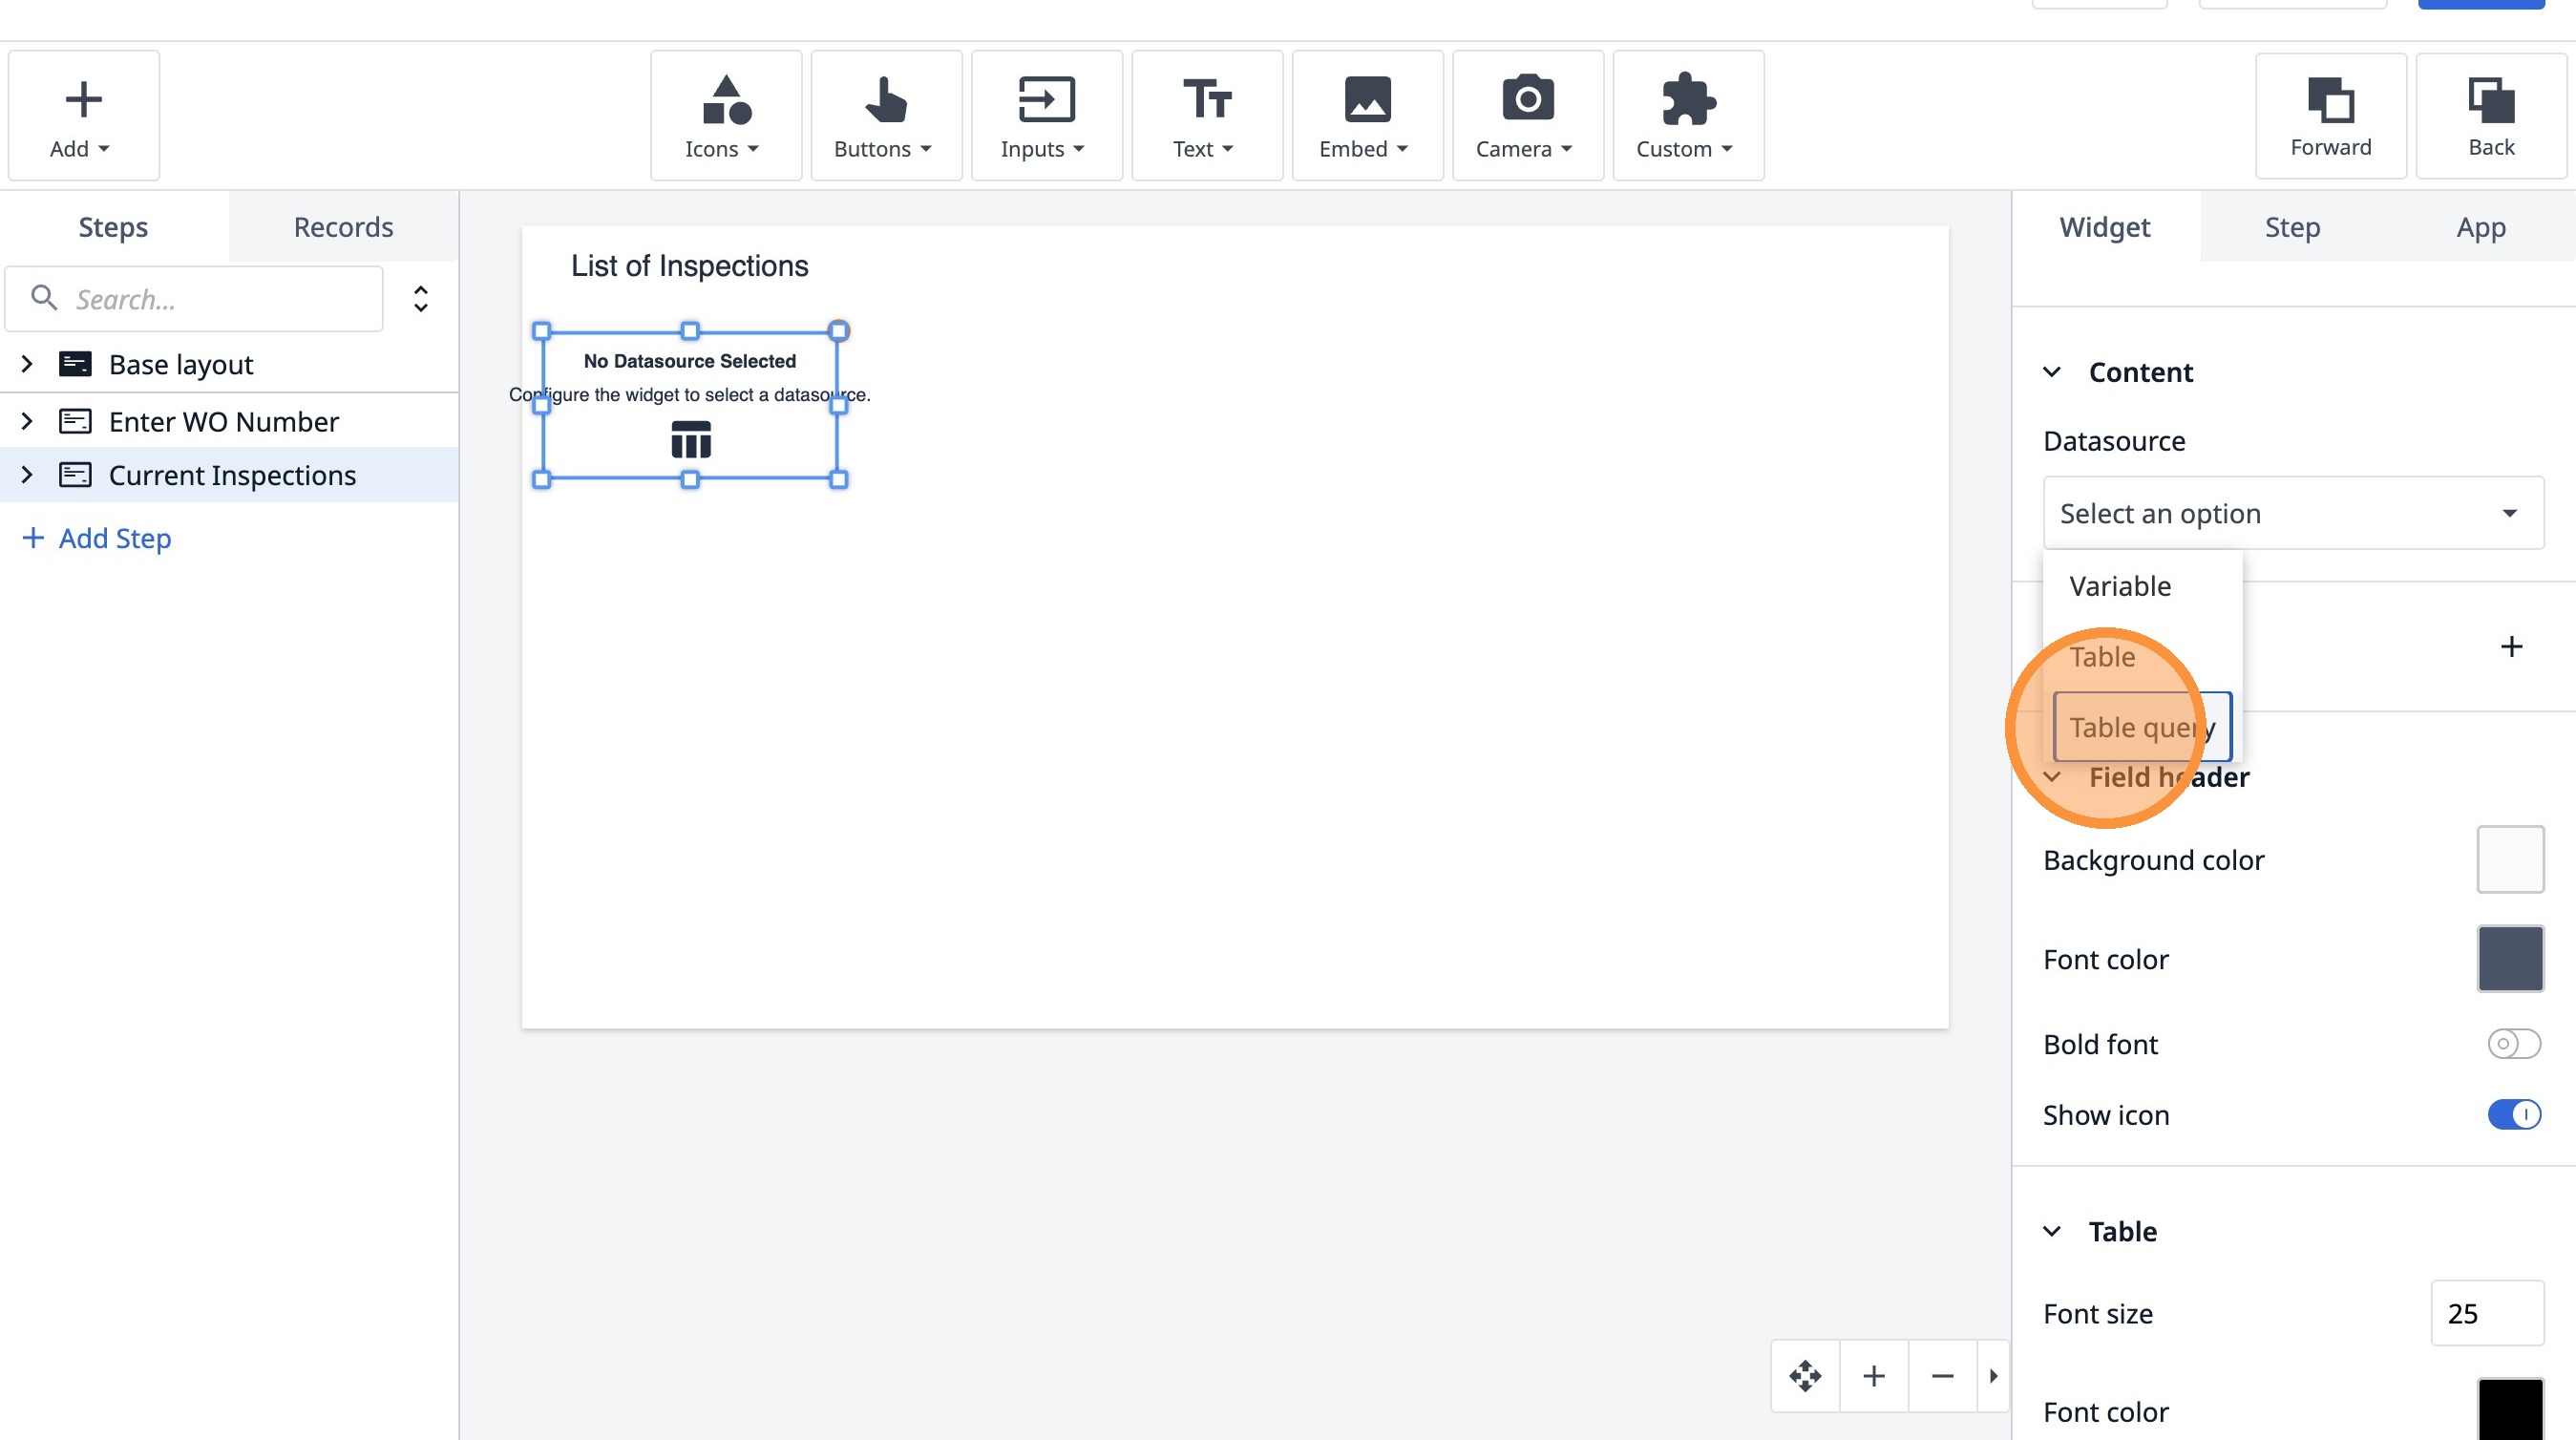
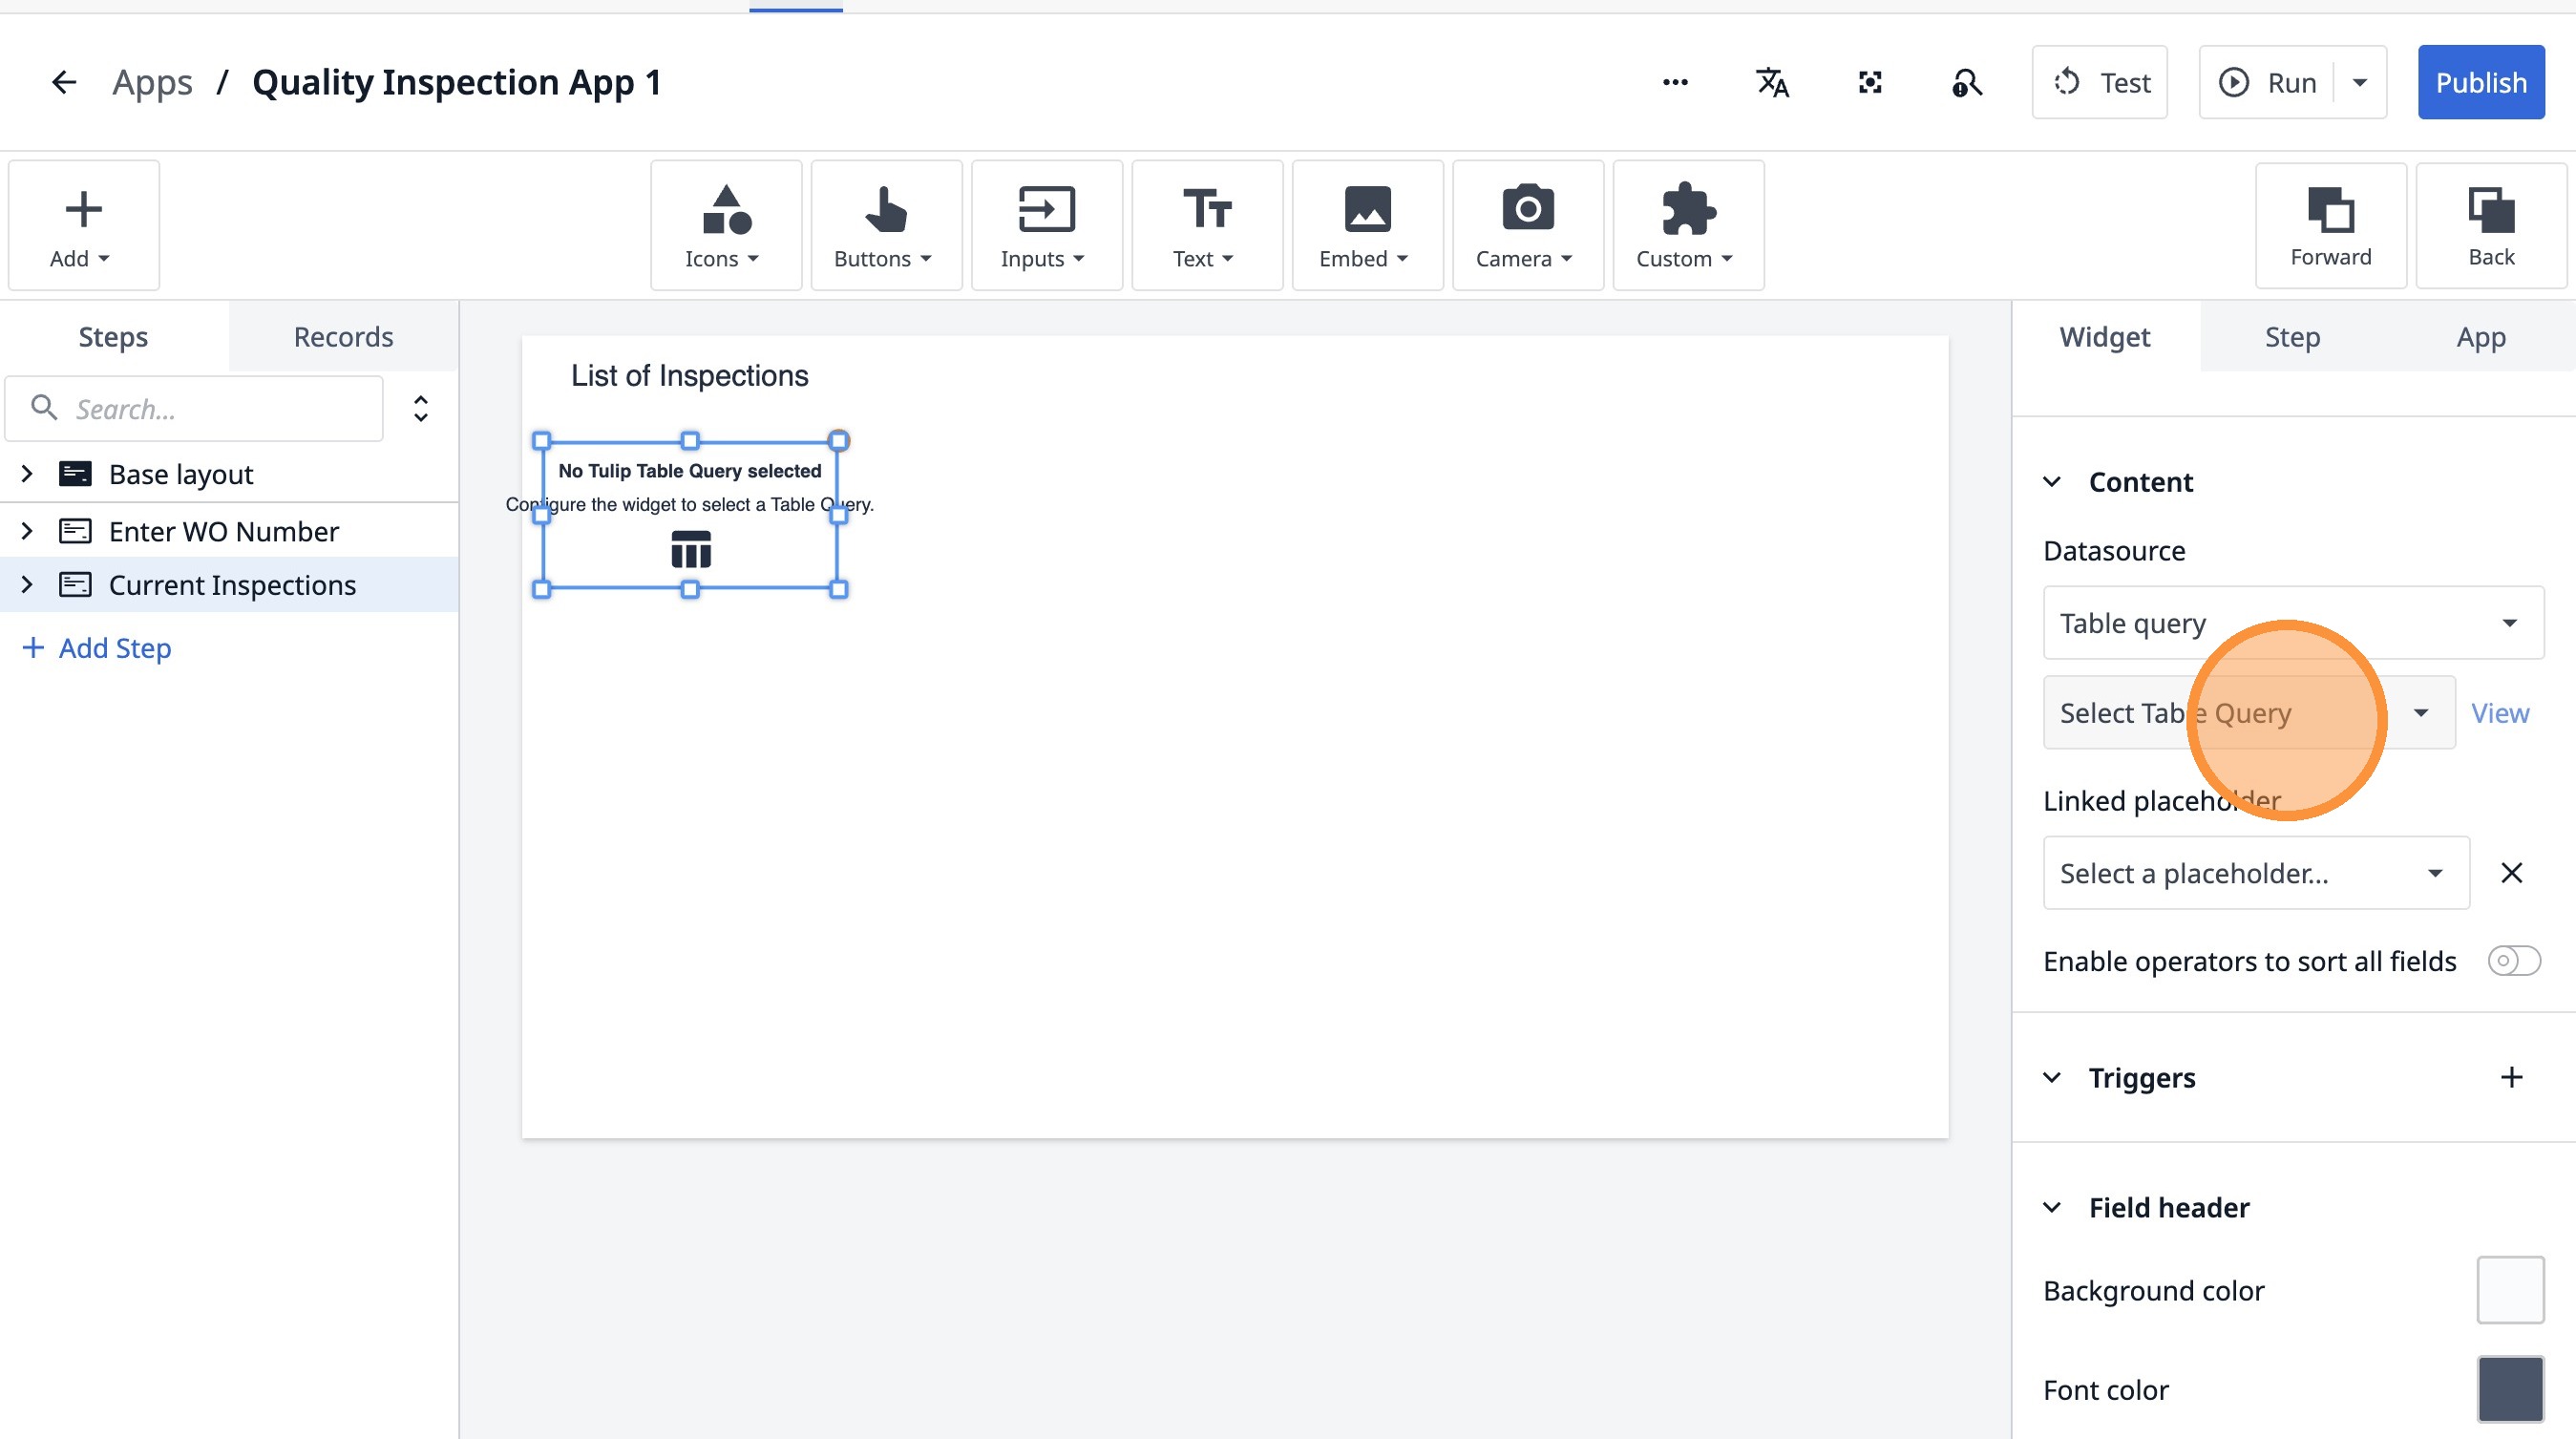
17. Click "Table query"
18. Click "Select Table Query"
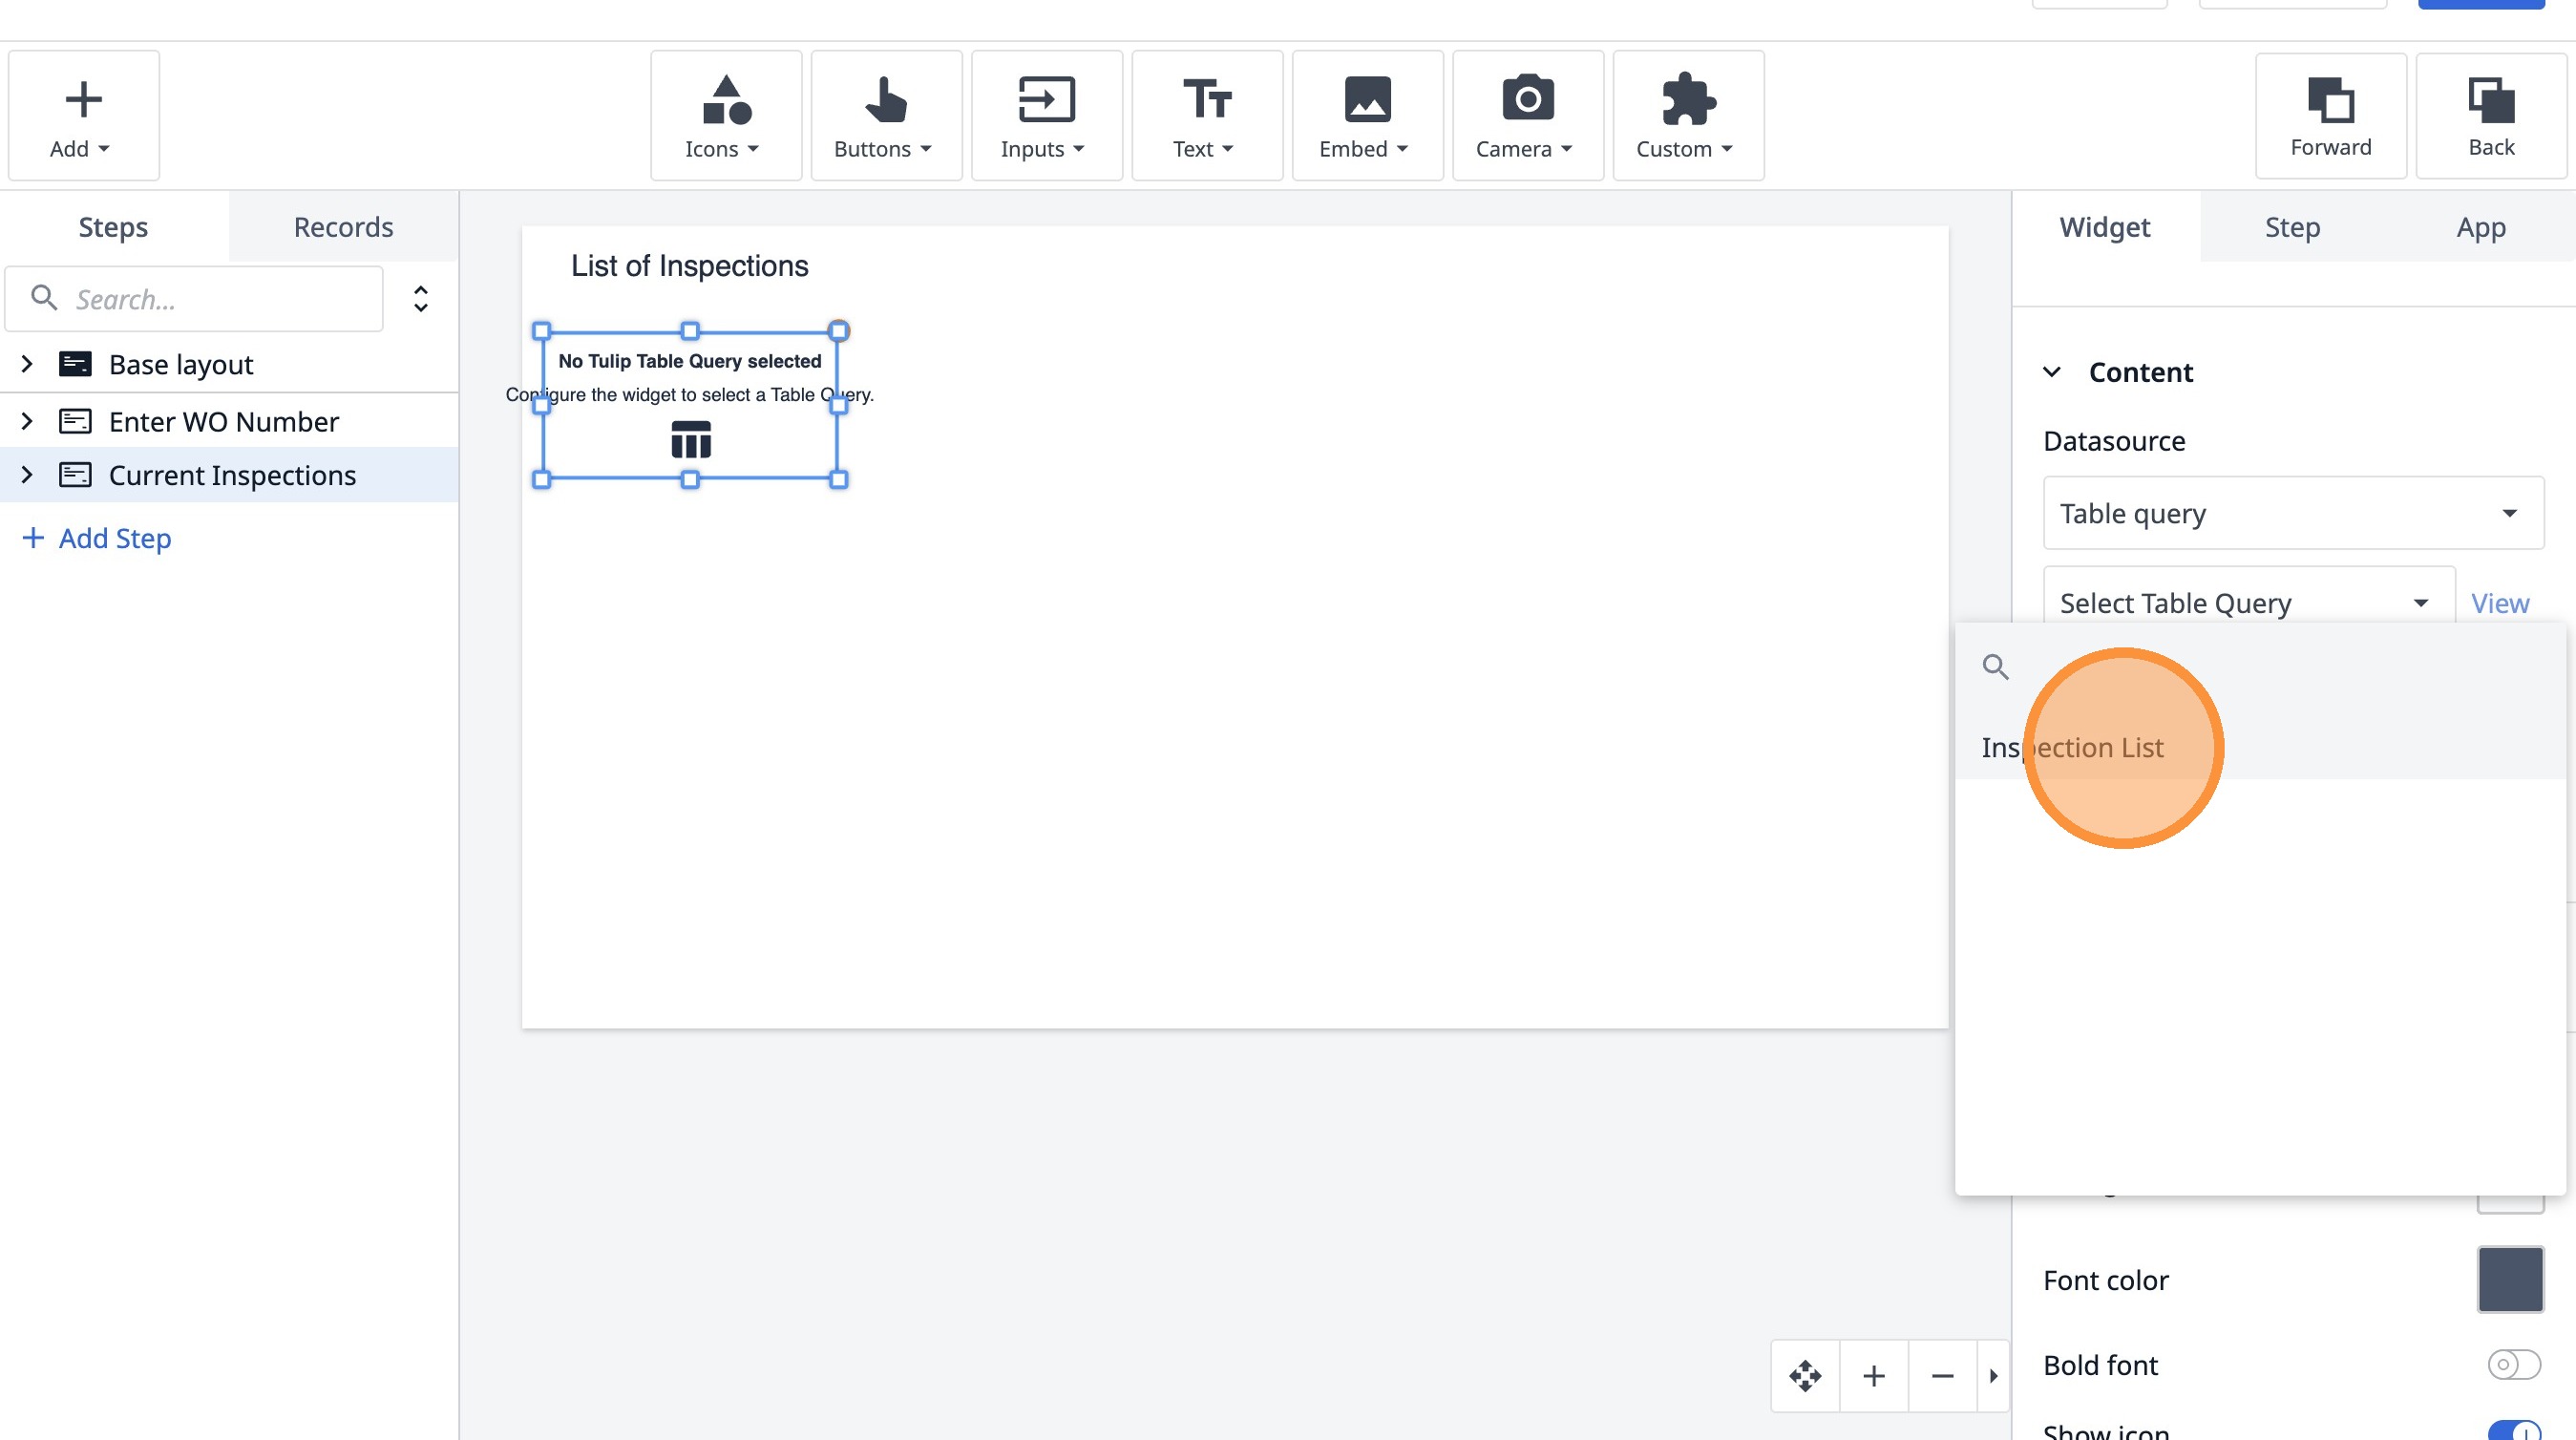
19. Click "Inspection List"
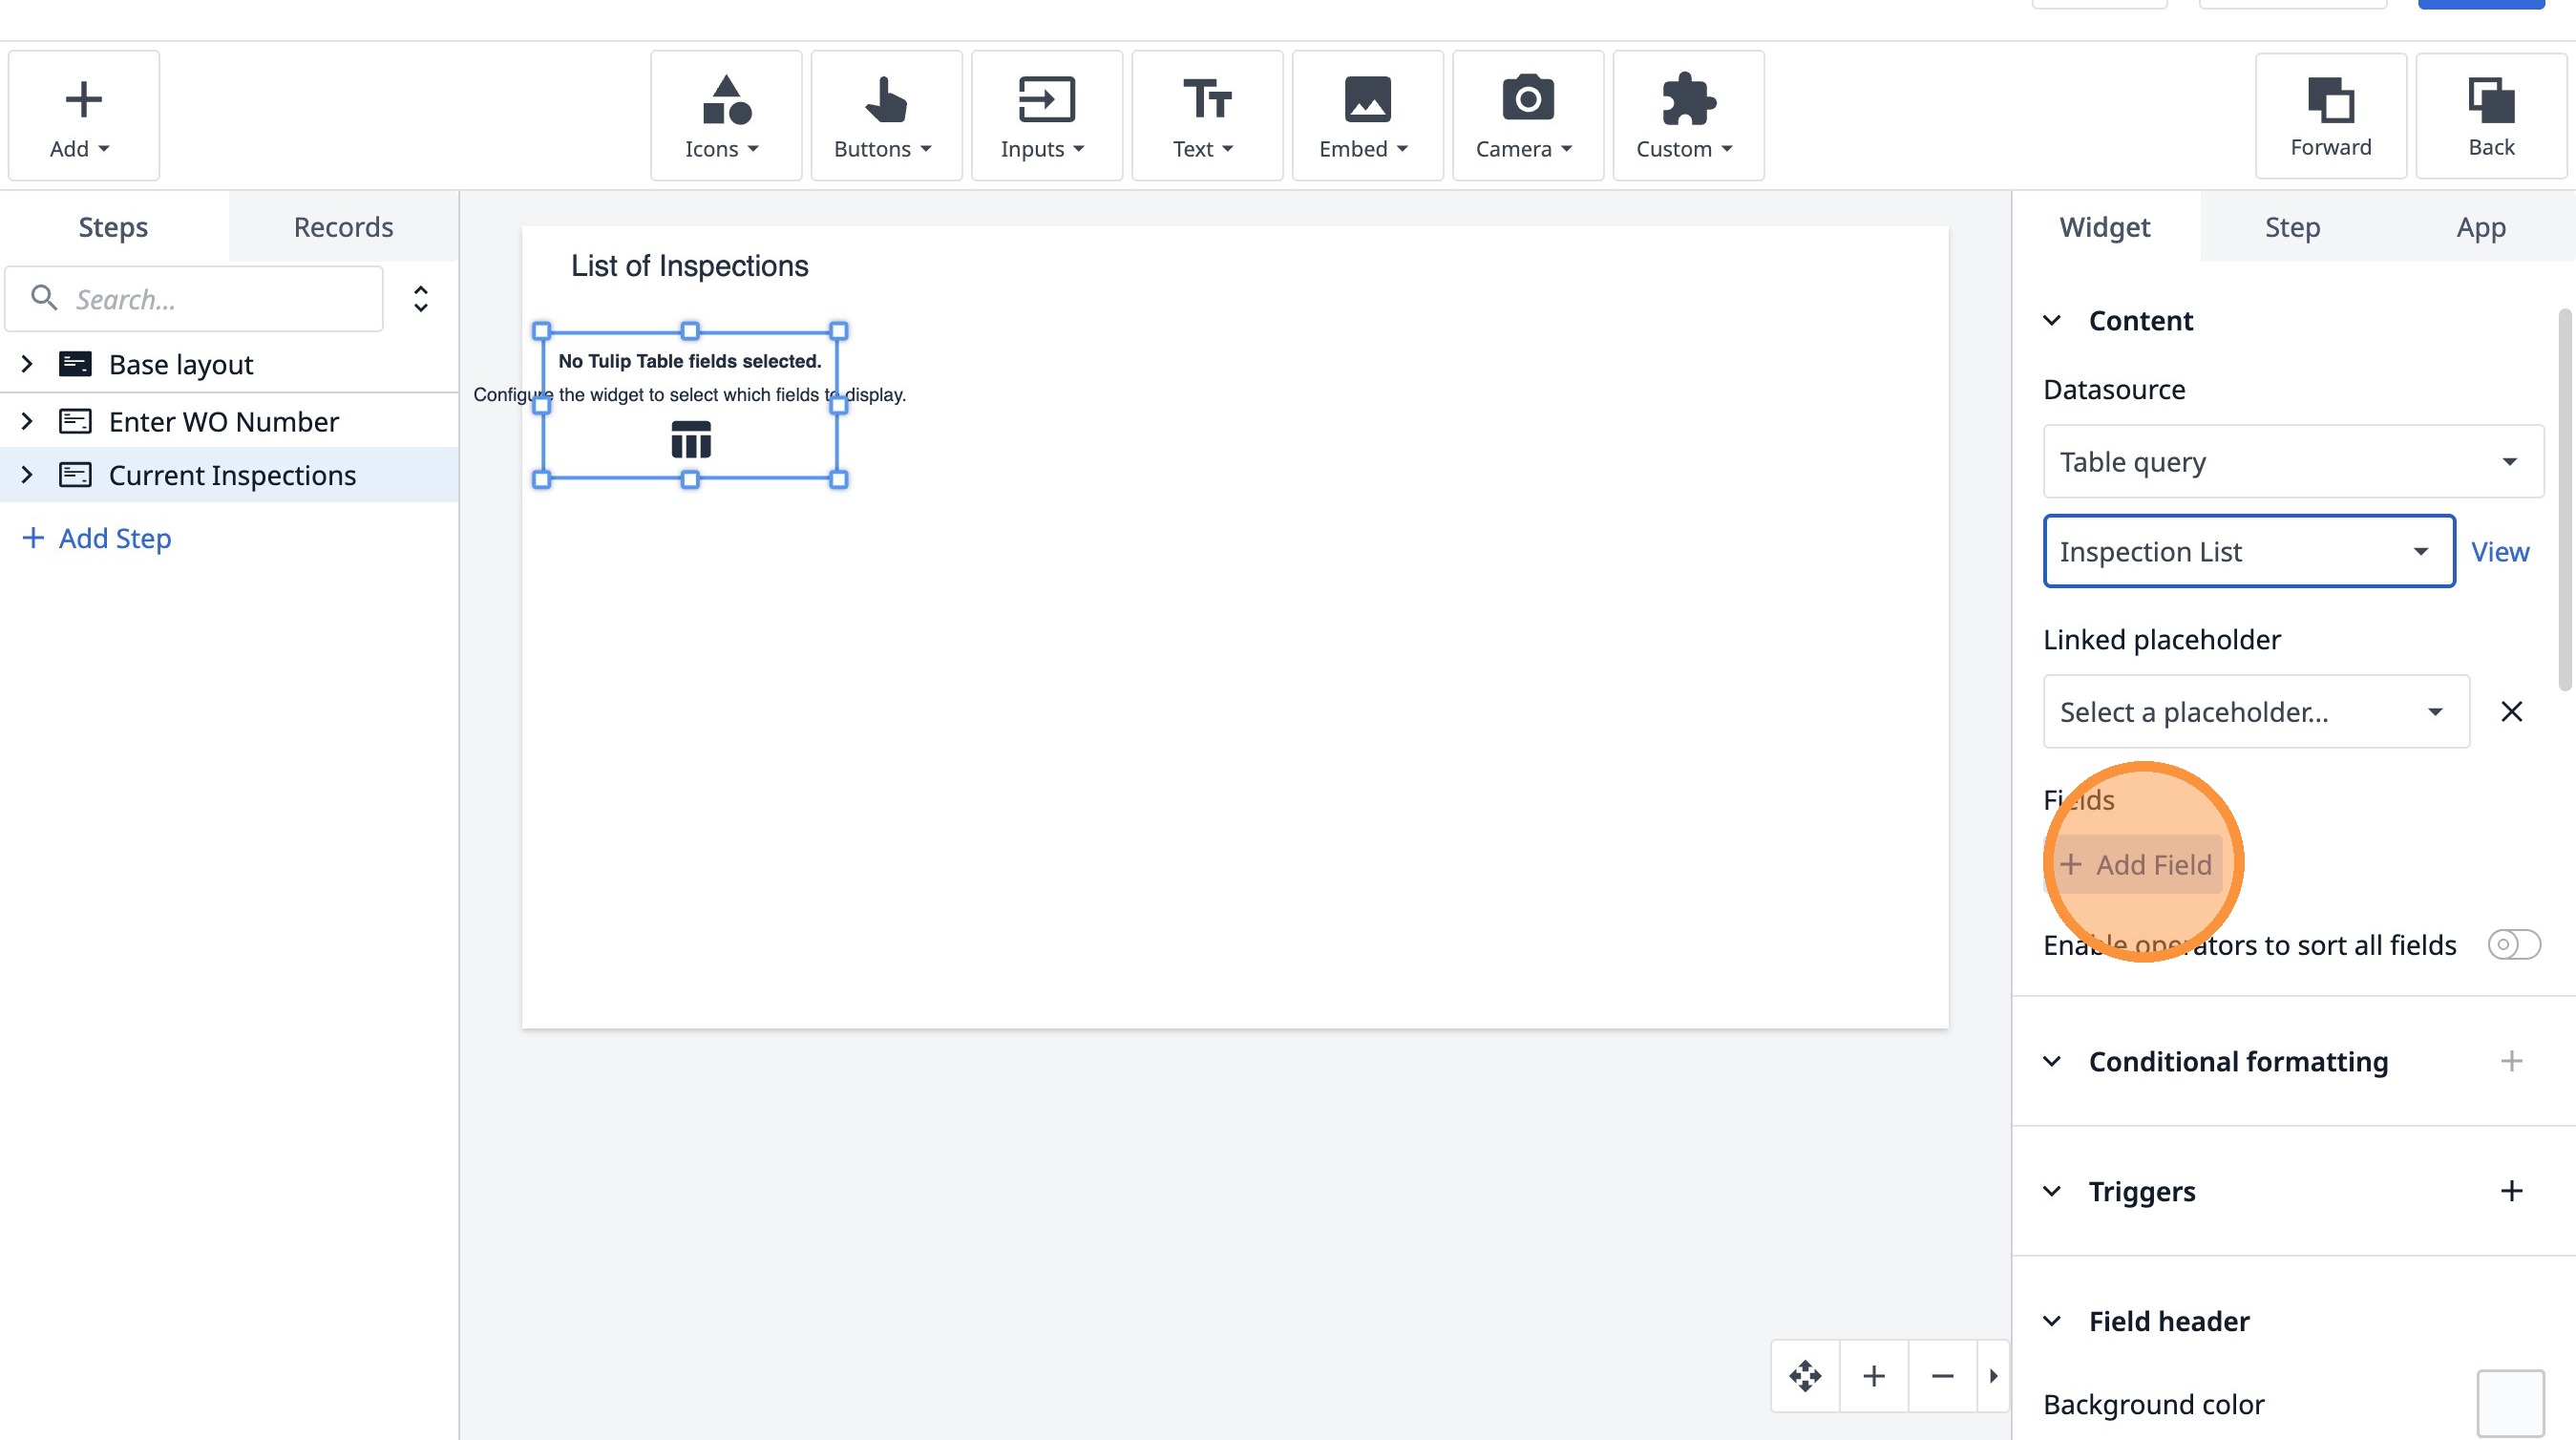
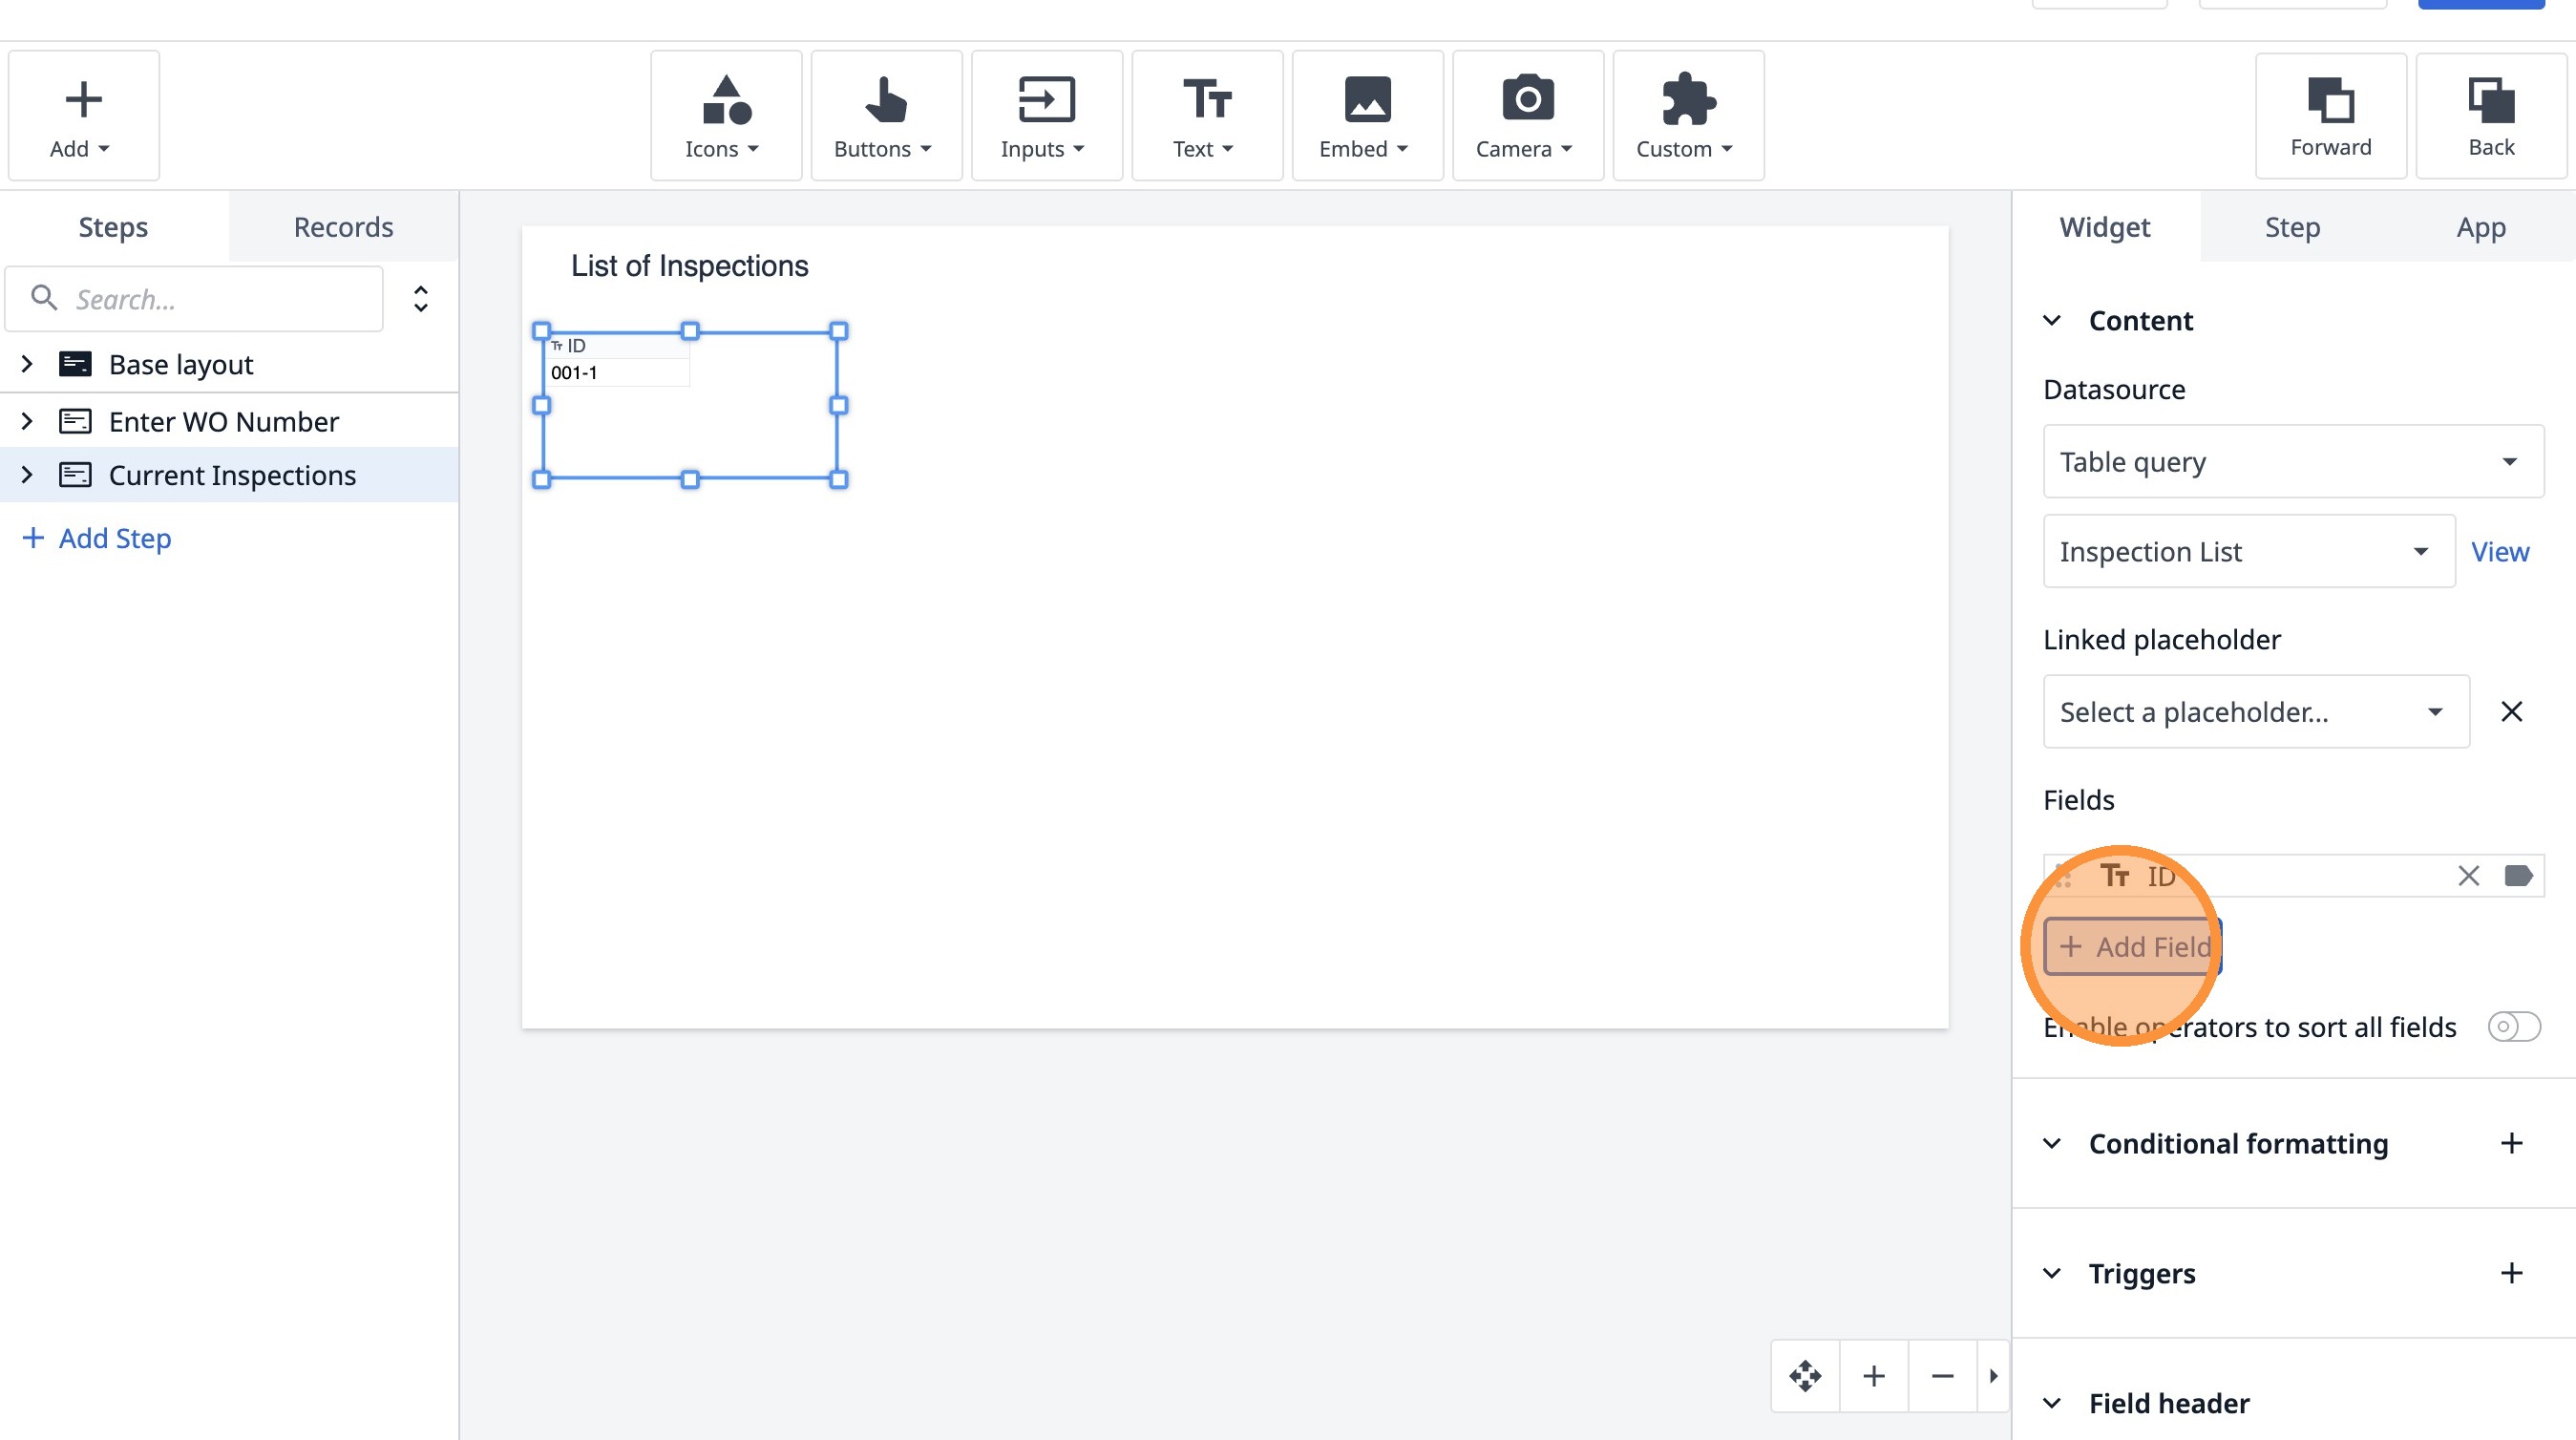
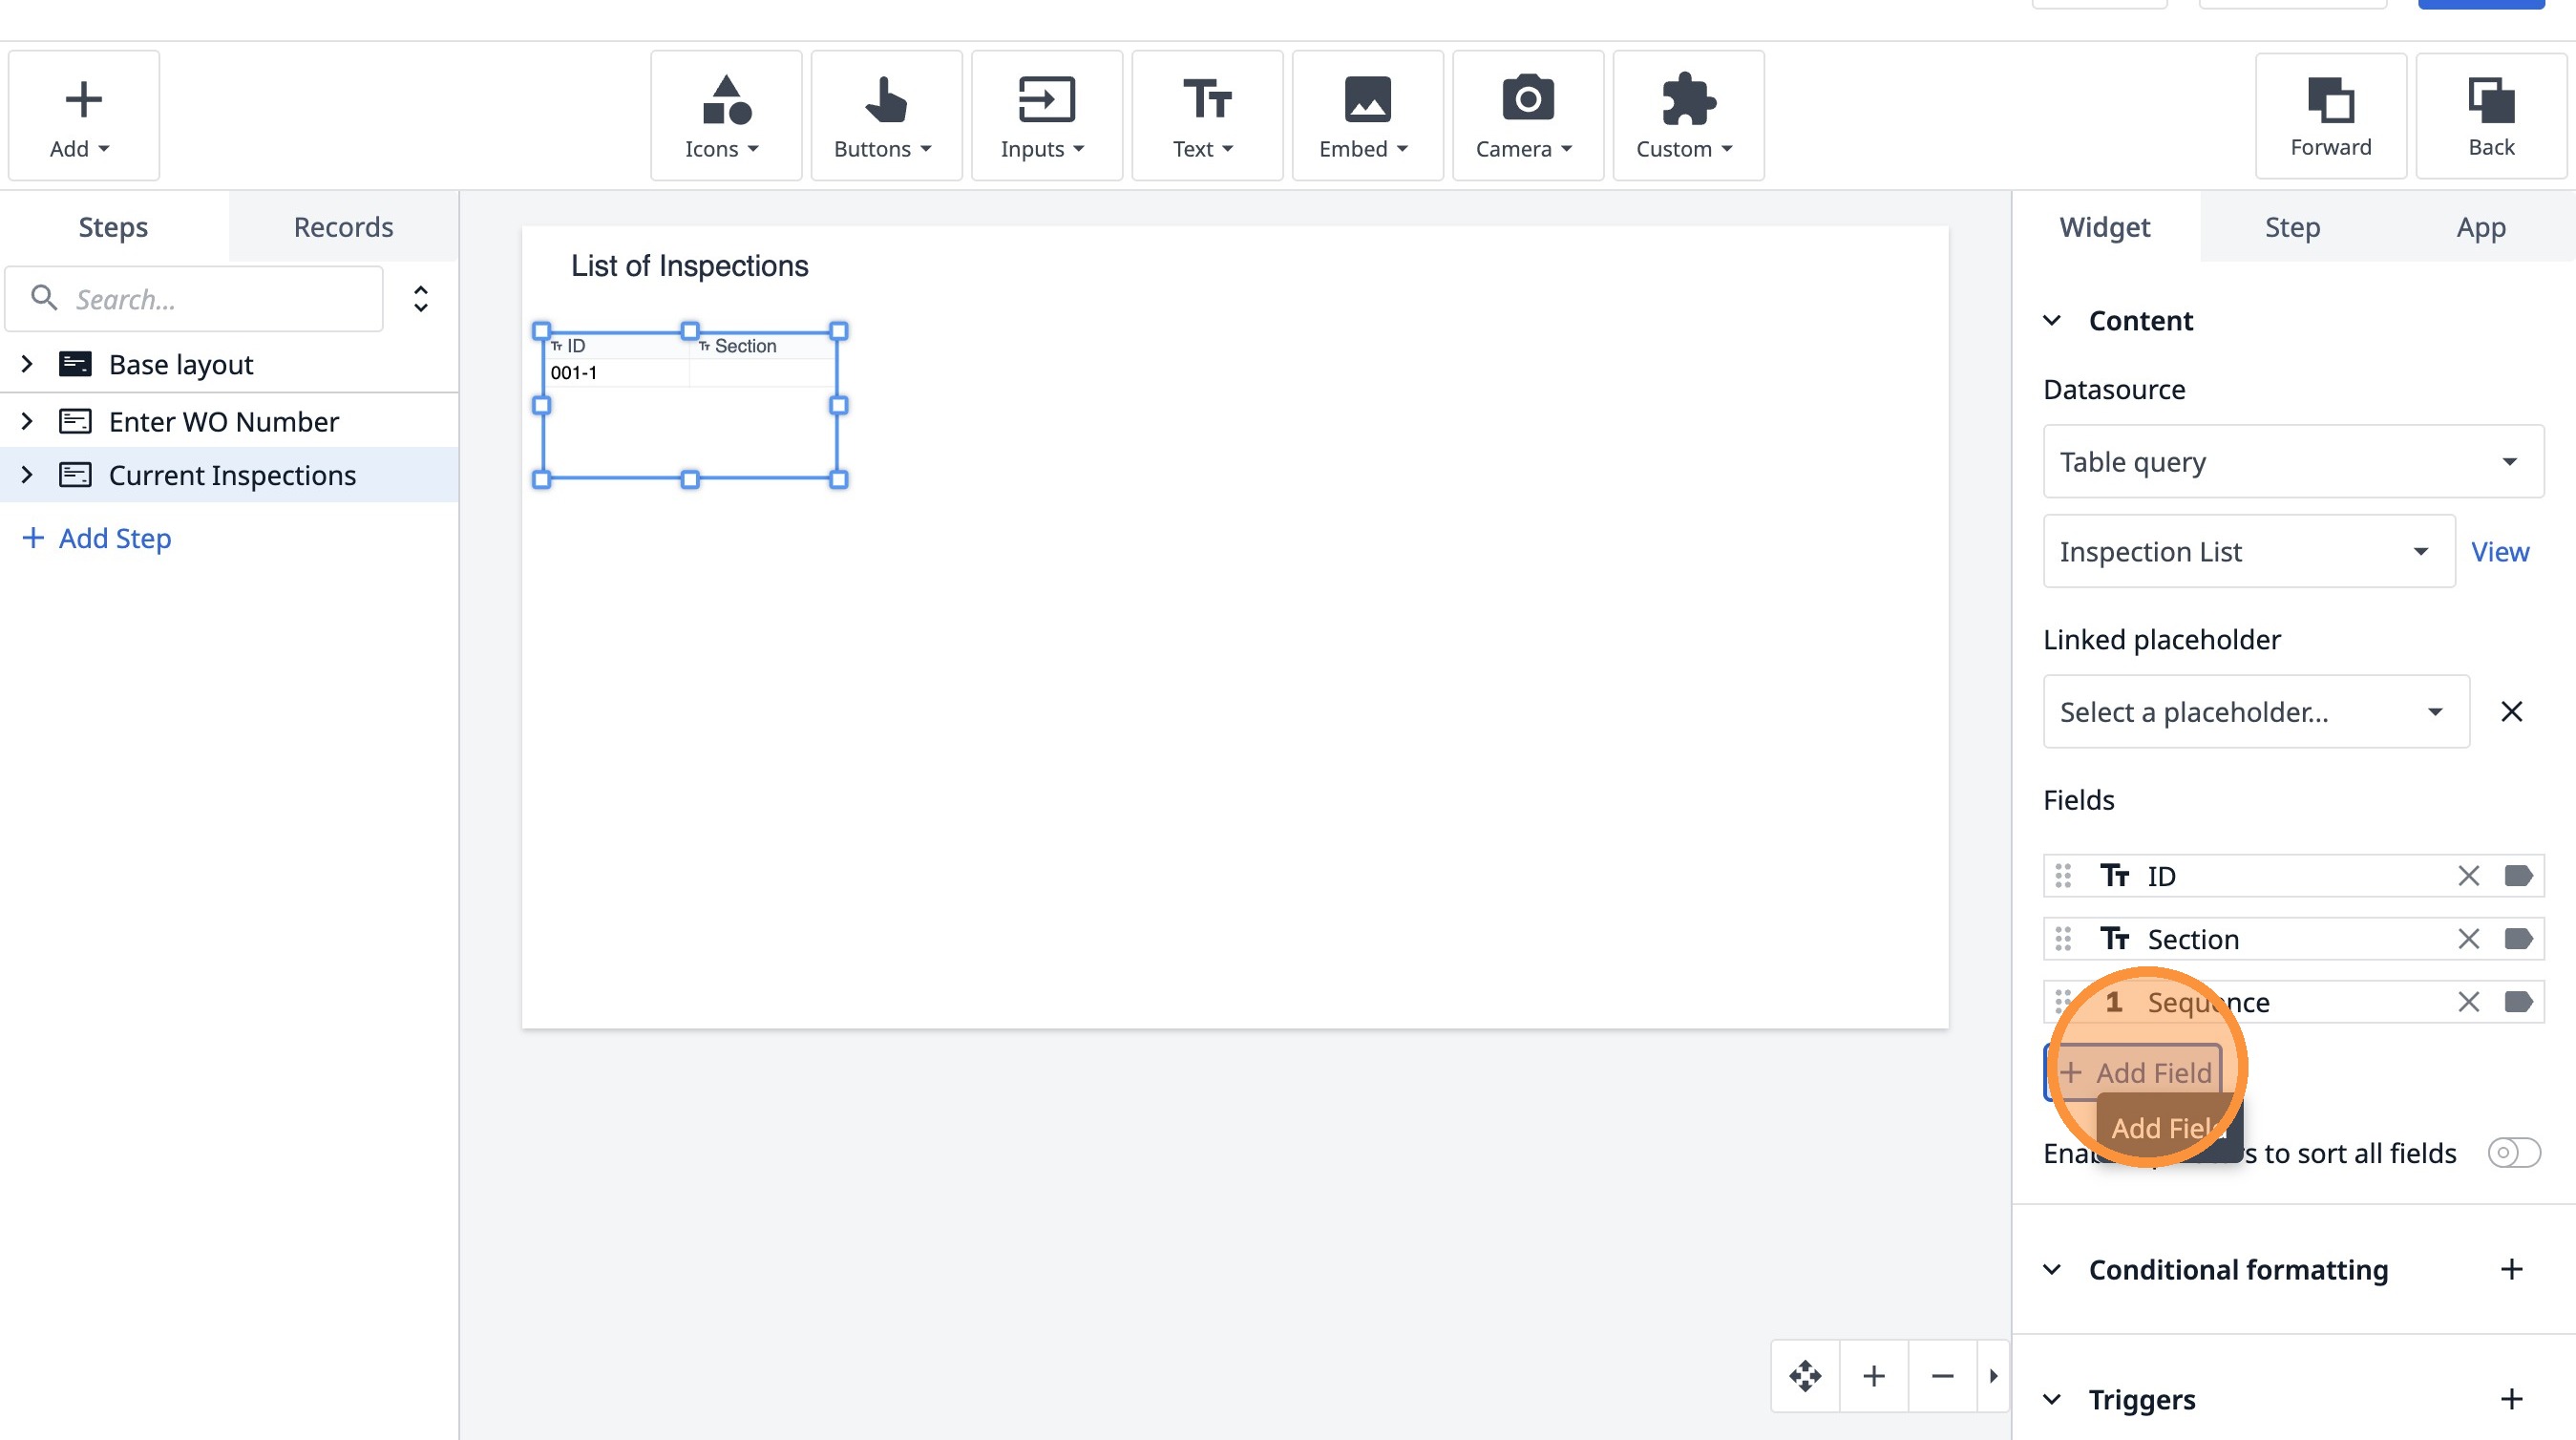
20. Click "Add Field"
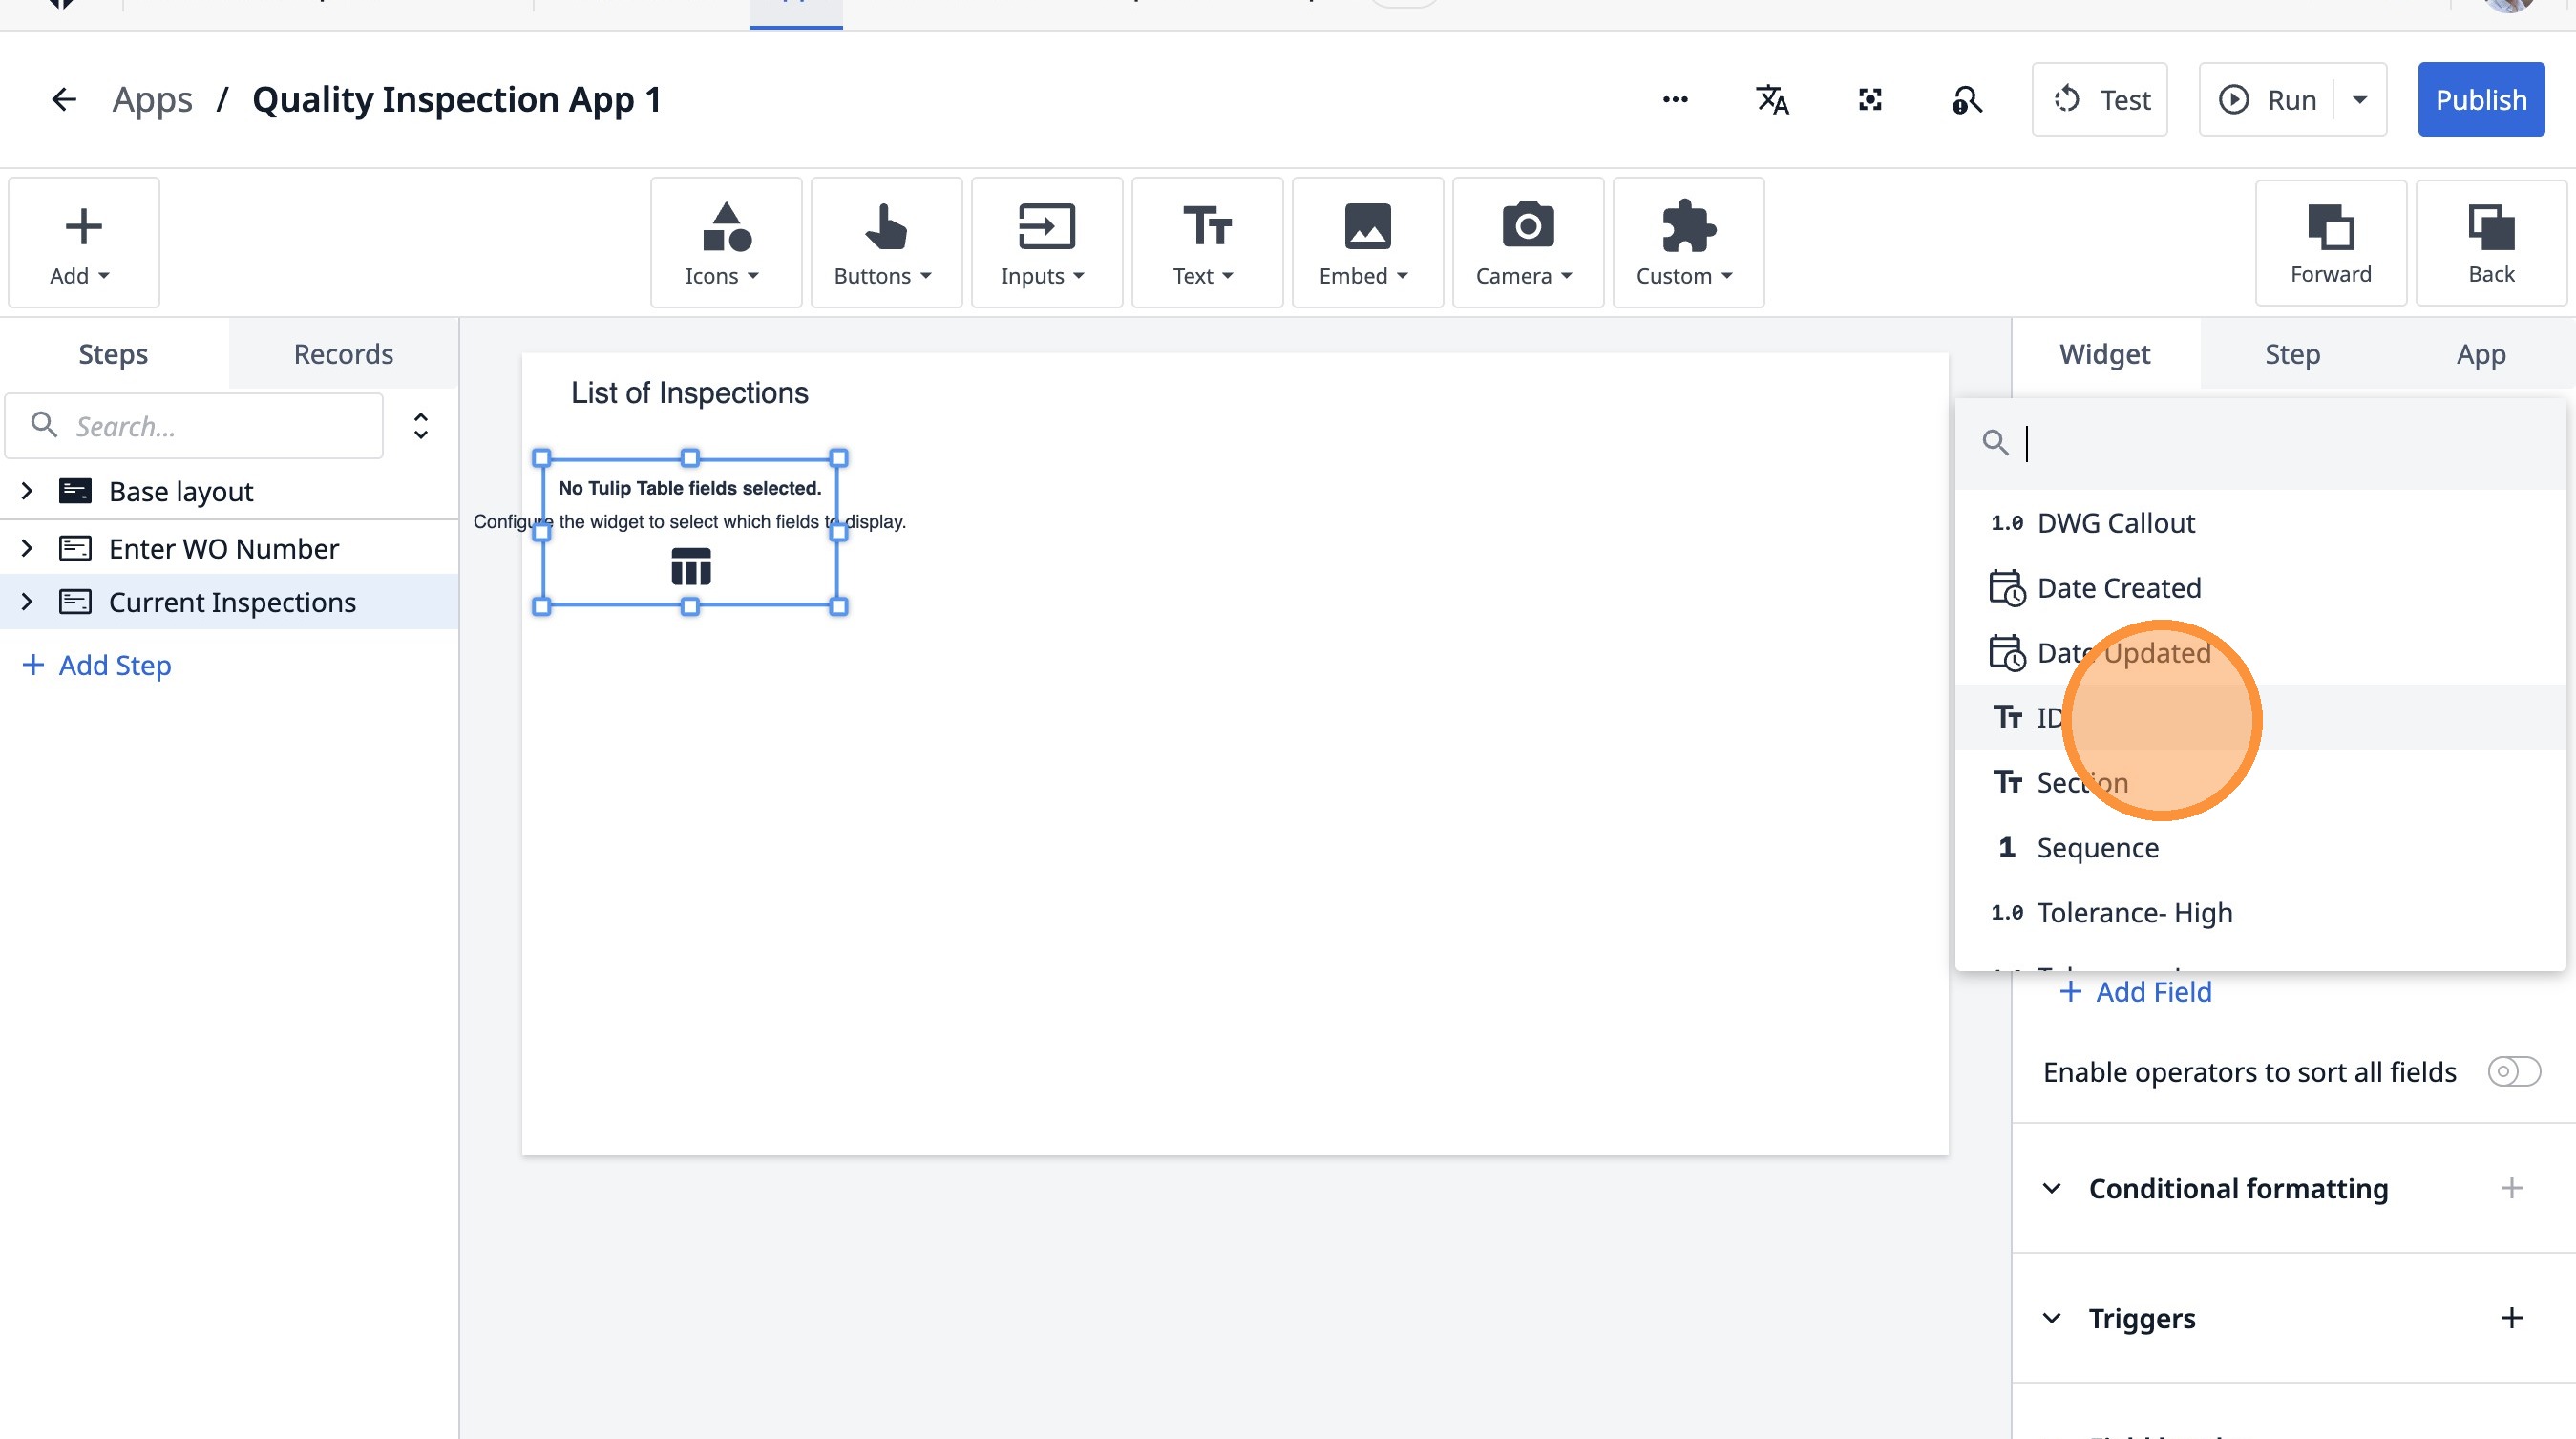
21. Click "ID"
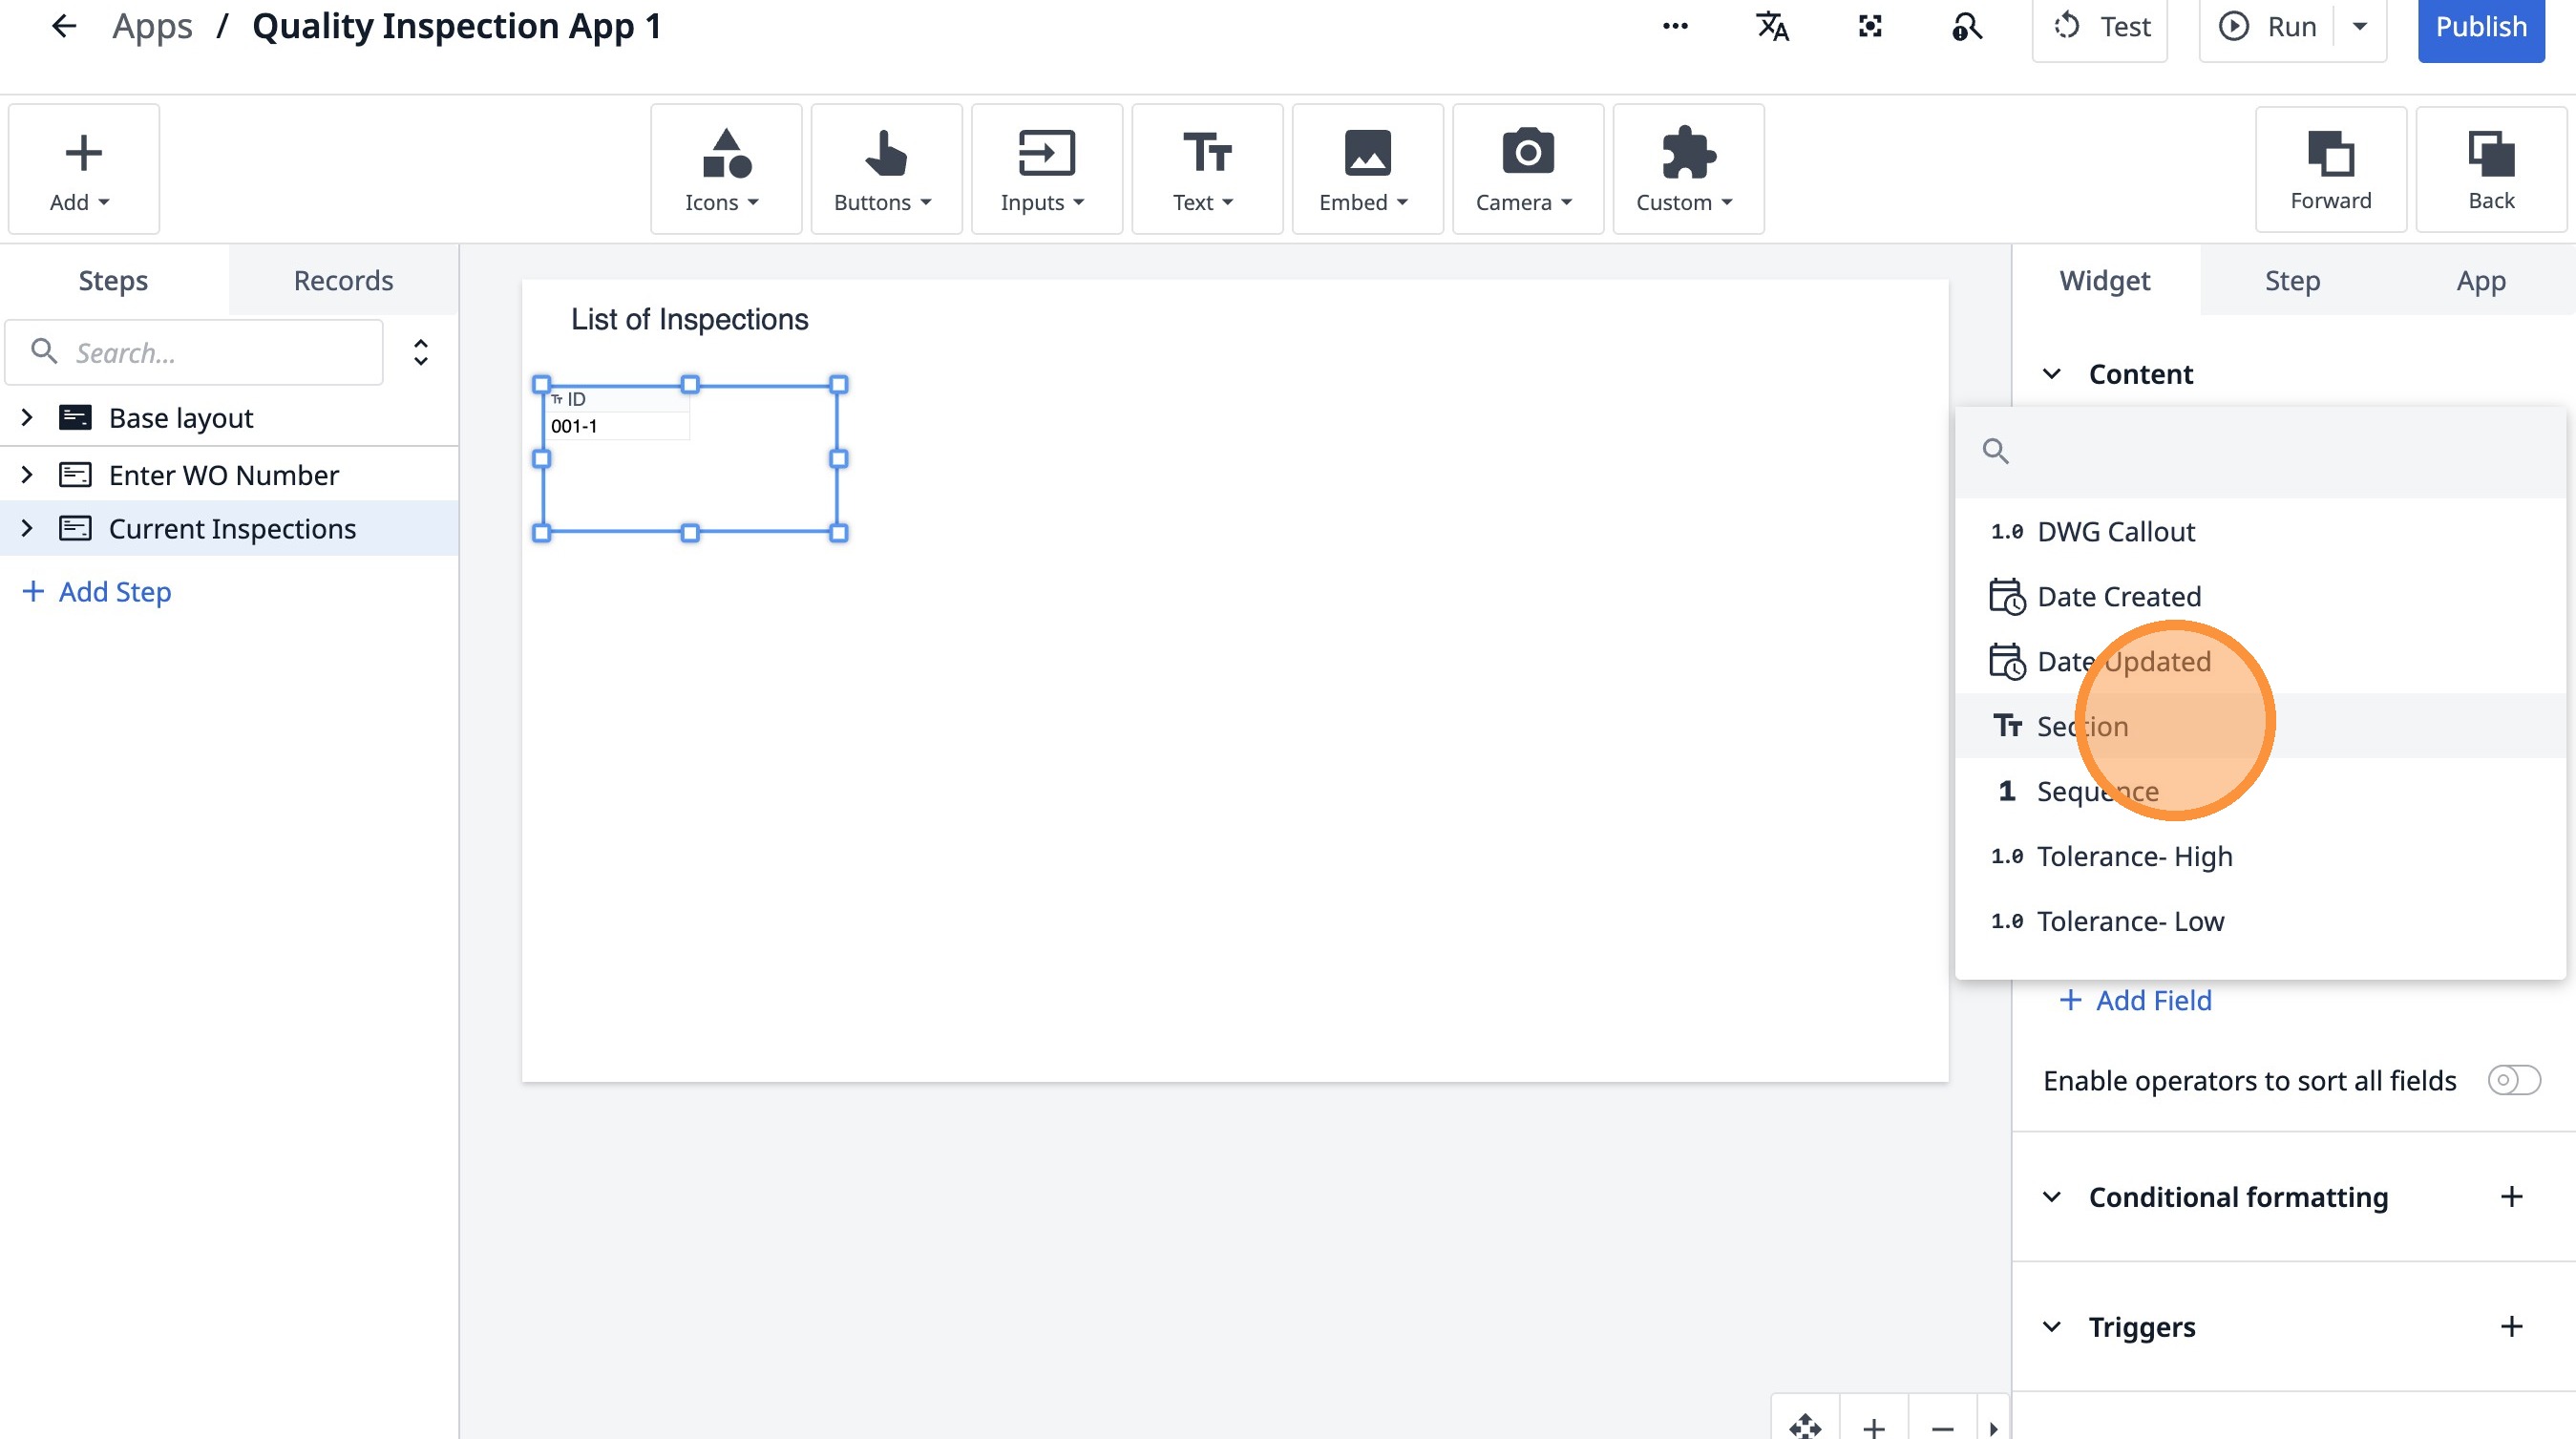
22. Click "Add Field"
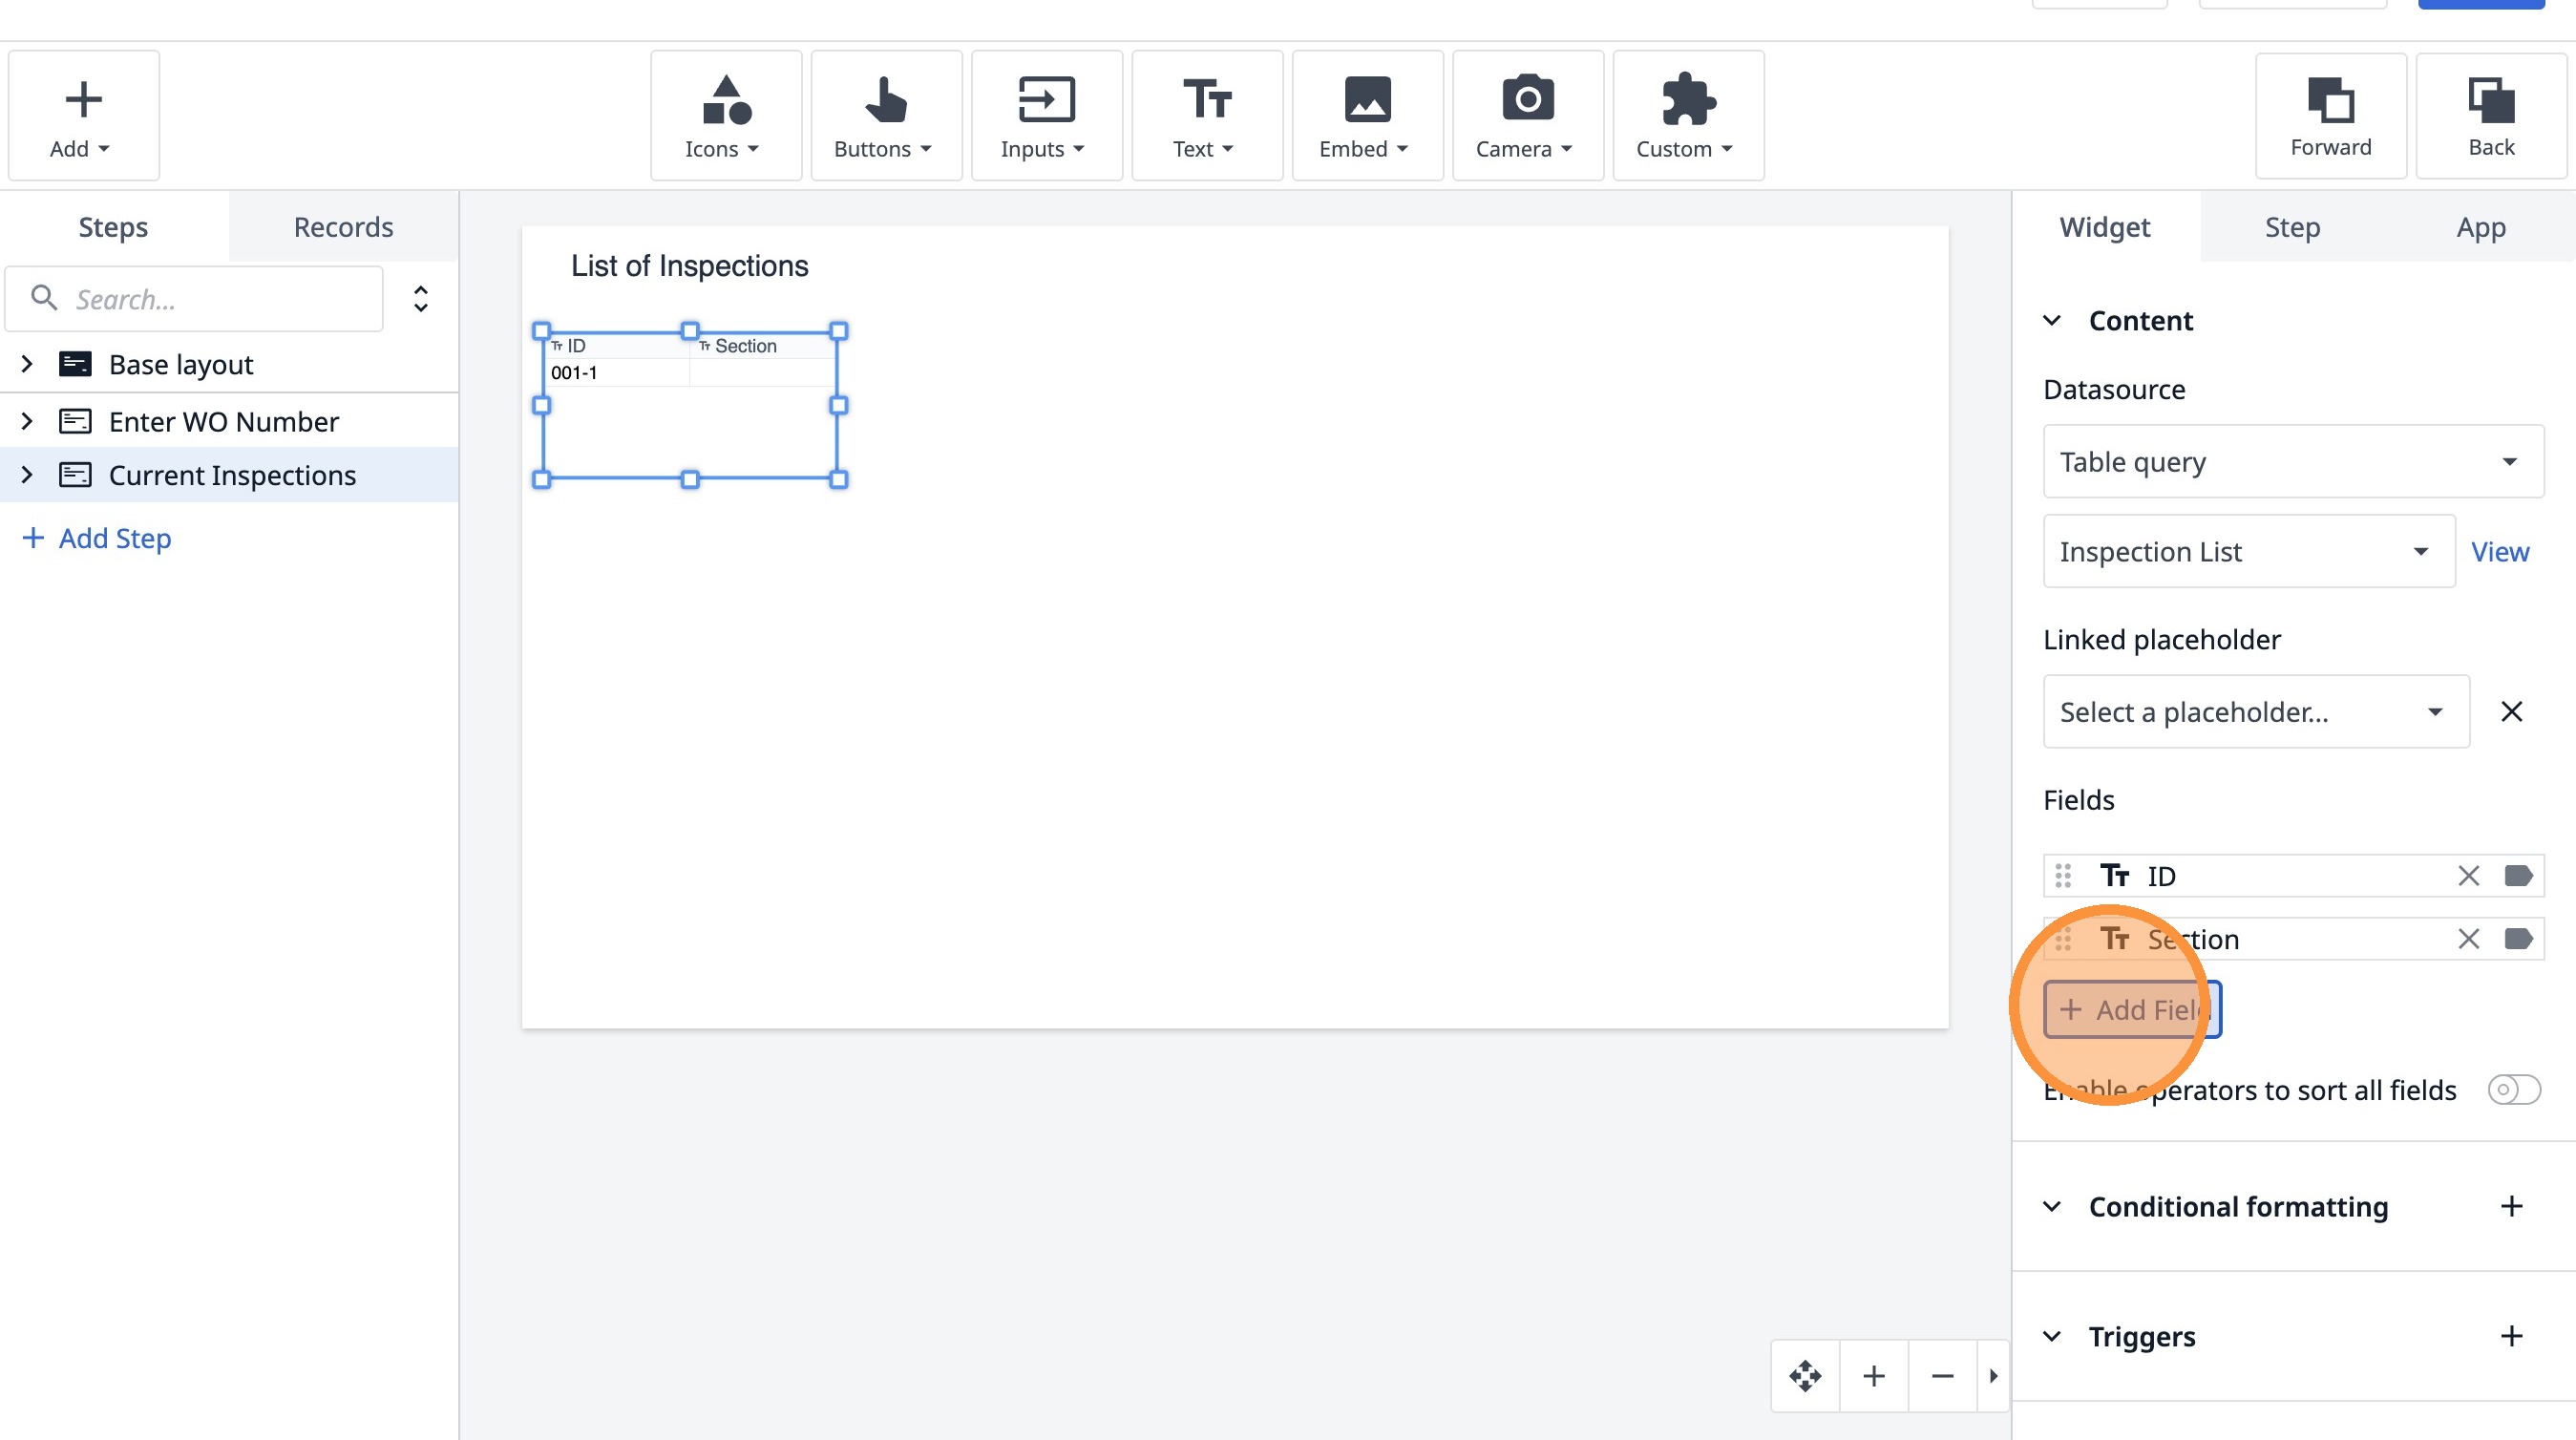
23. Click "Section"
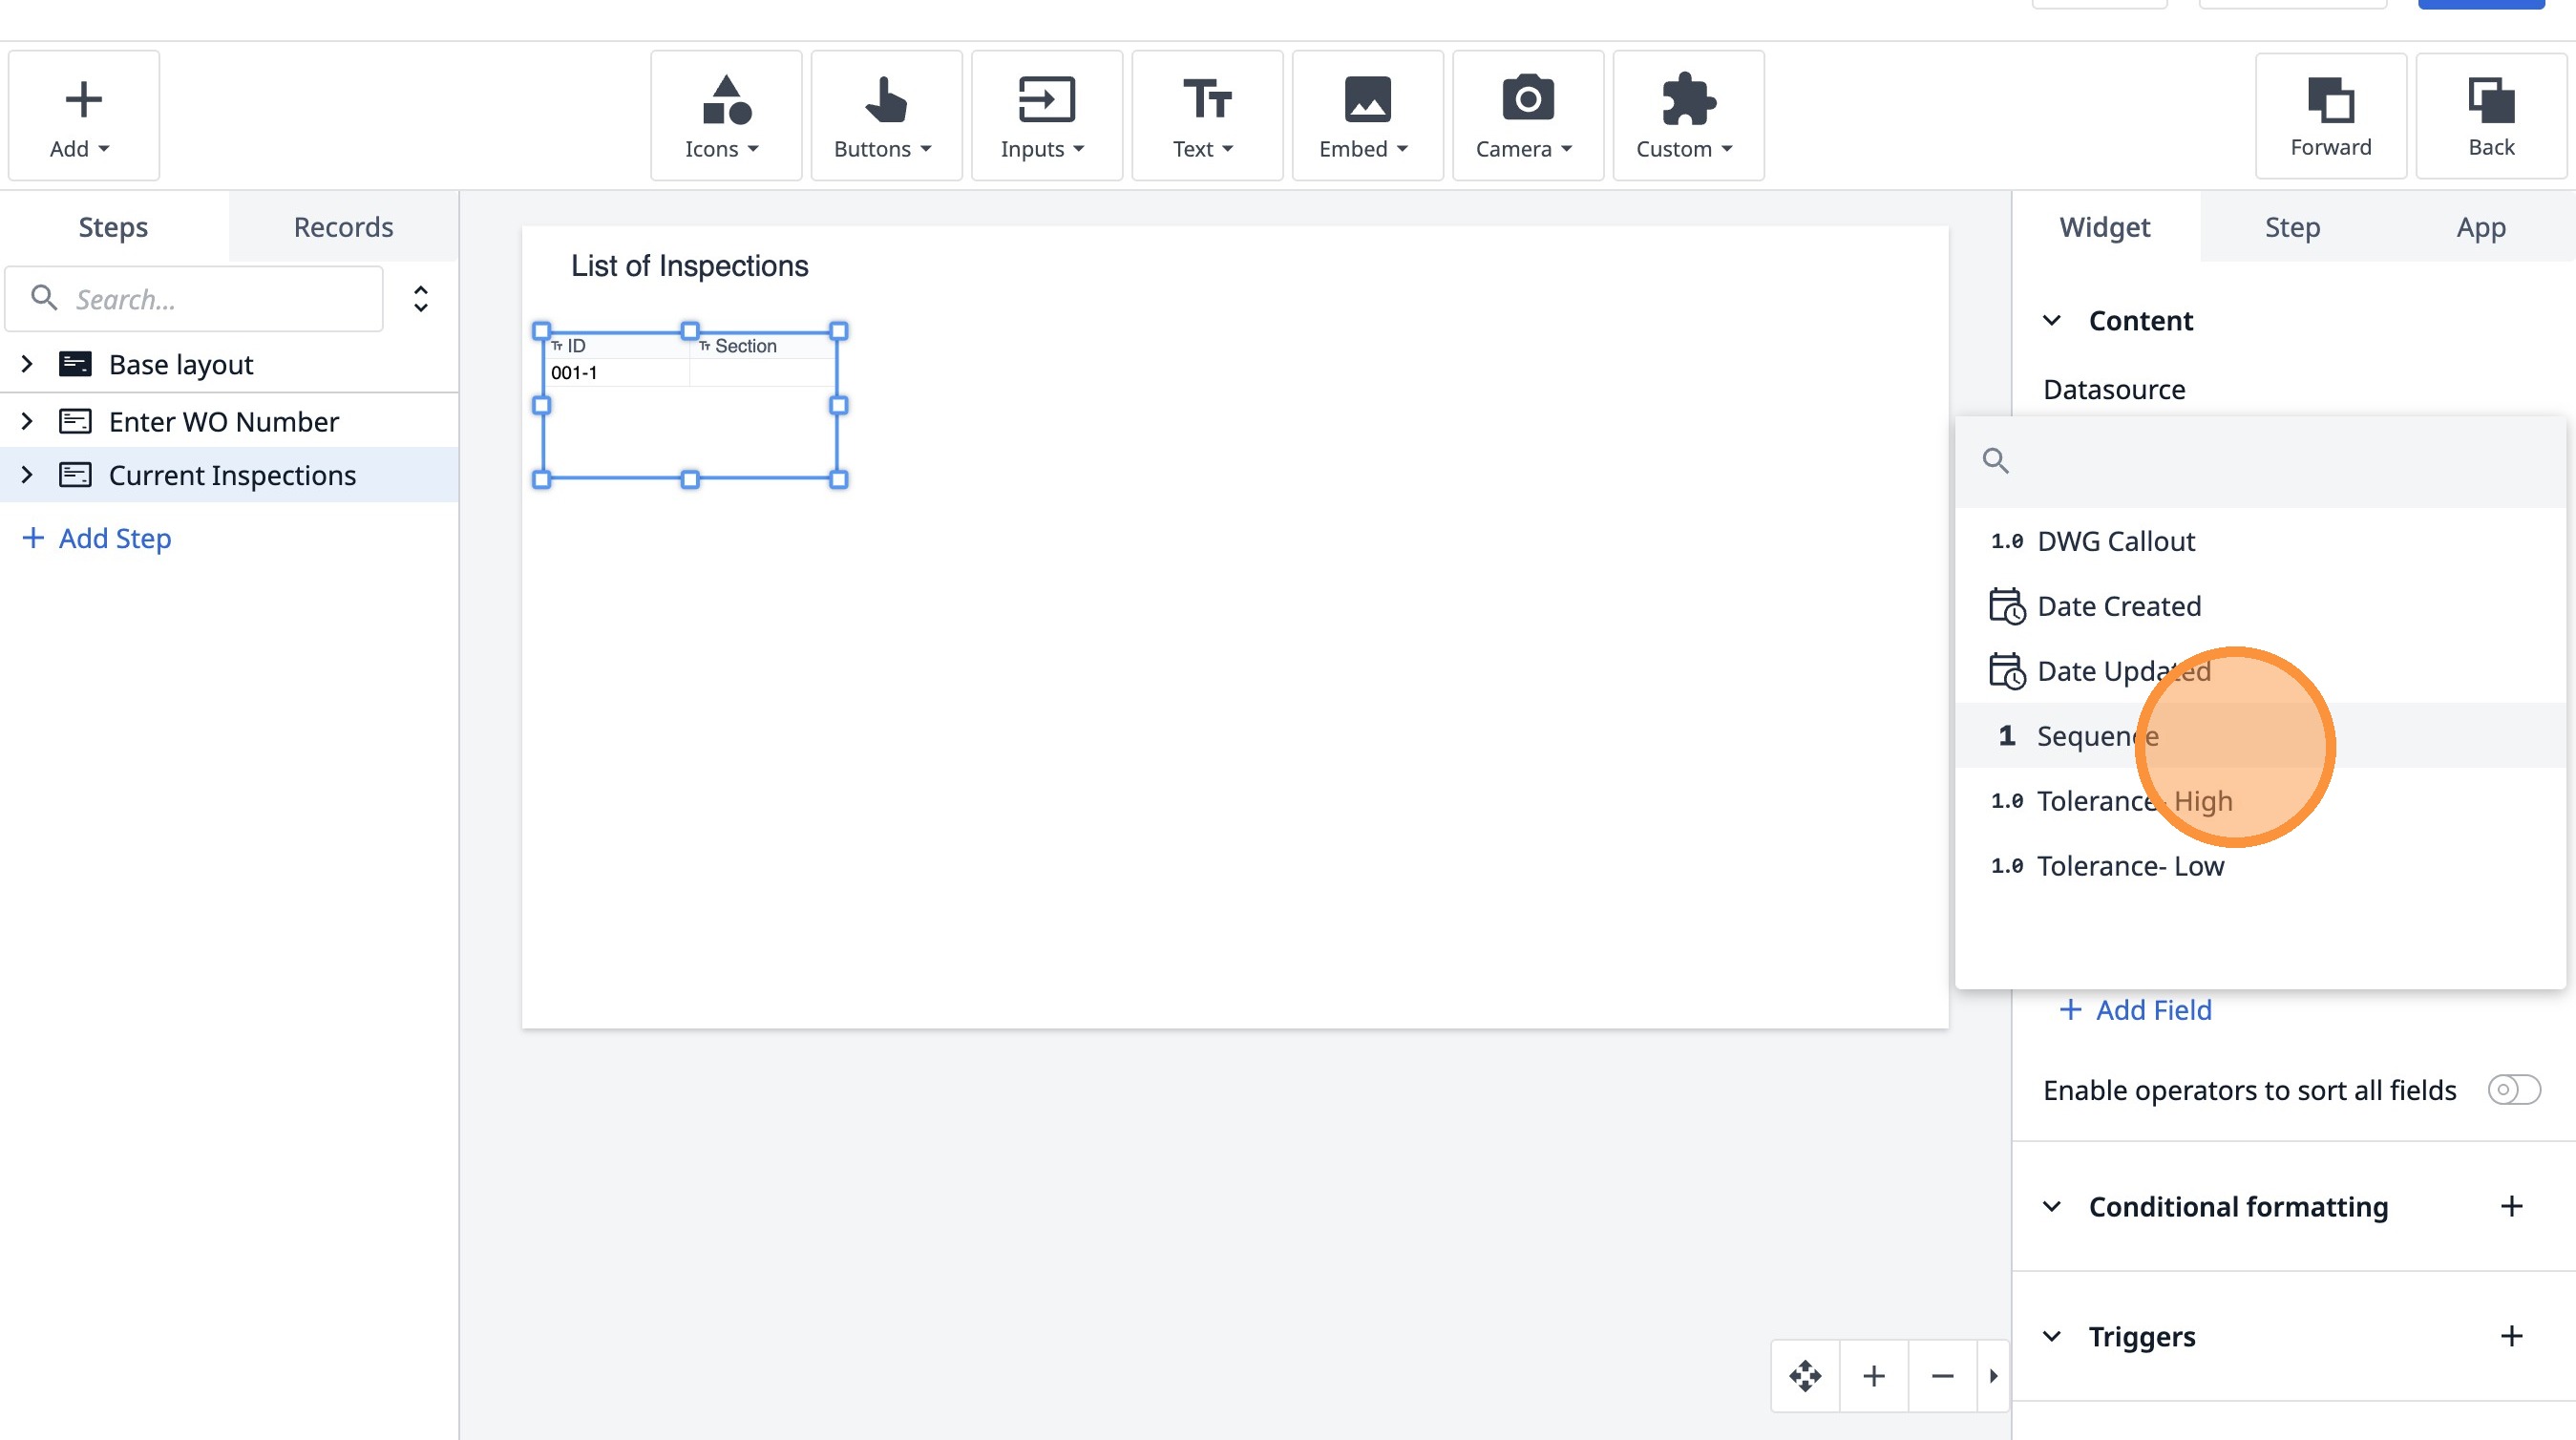
24. Click "Add Field"
25. Click "Sequence"
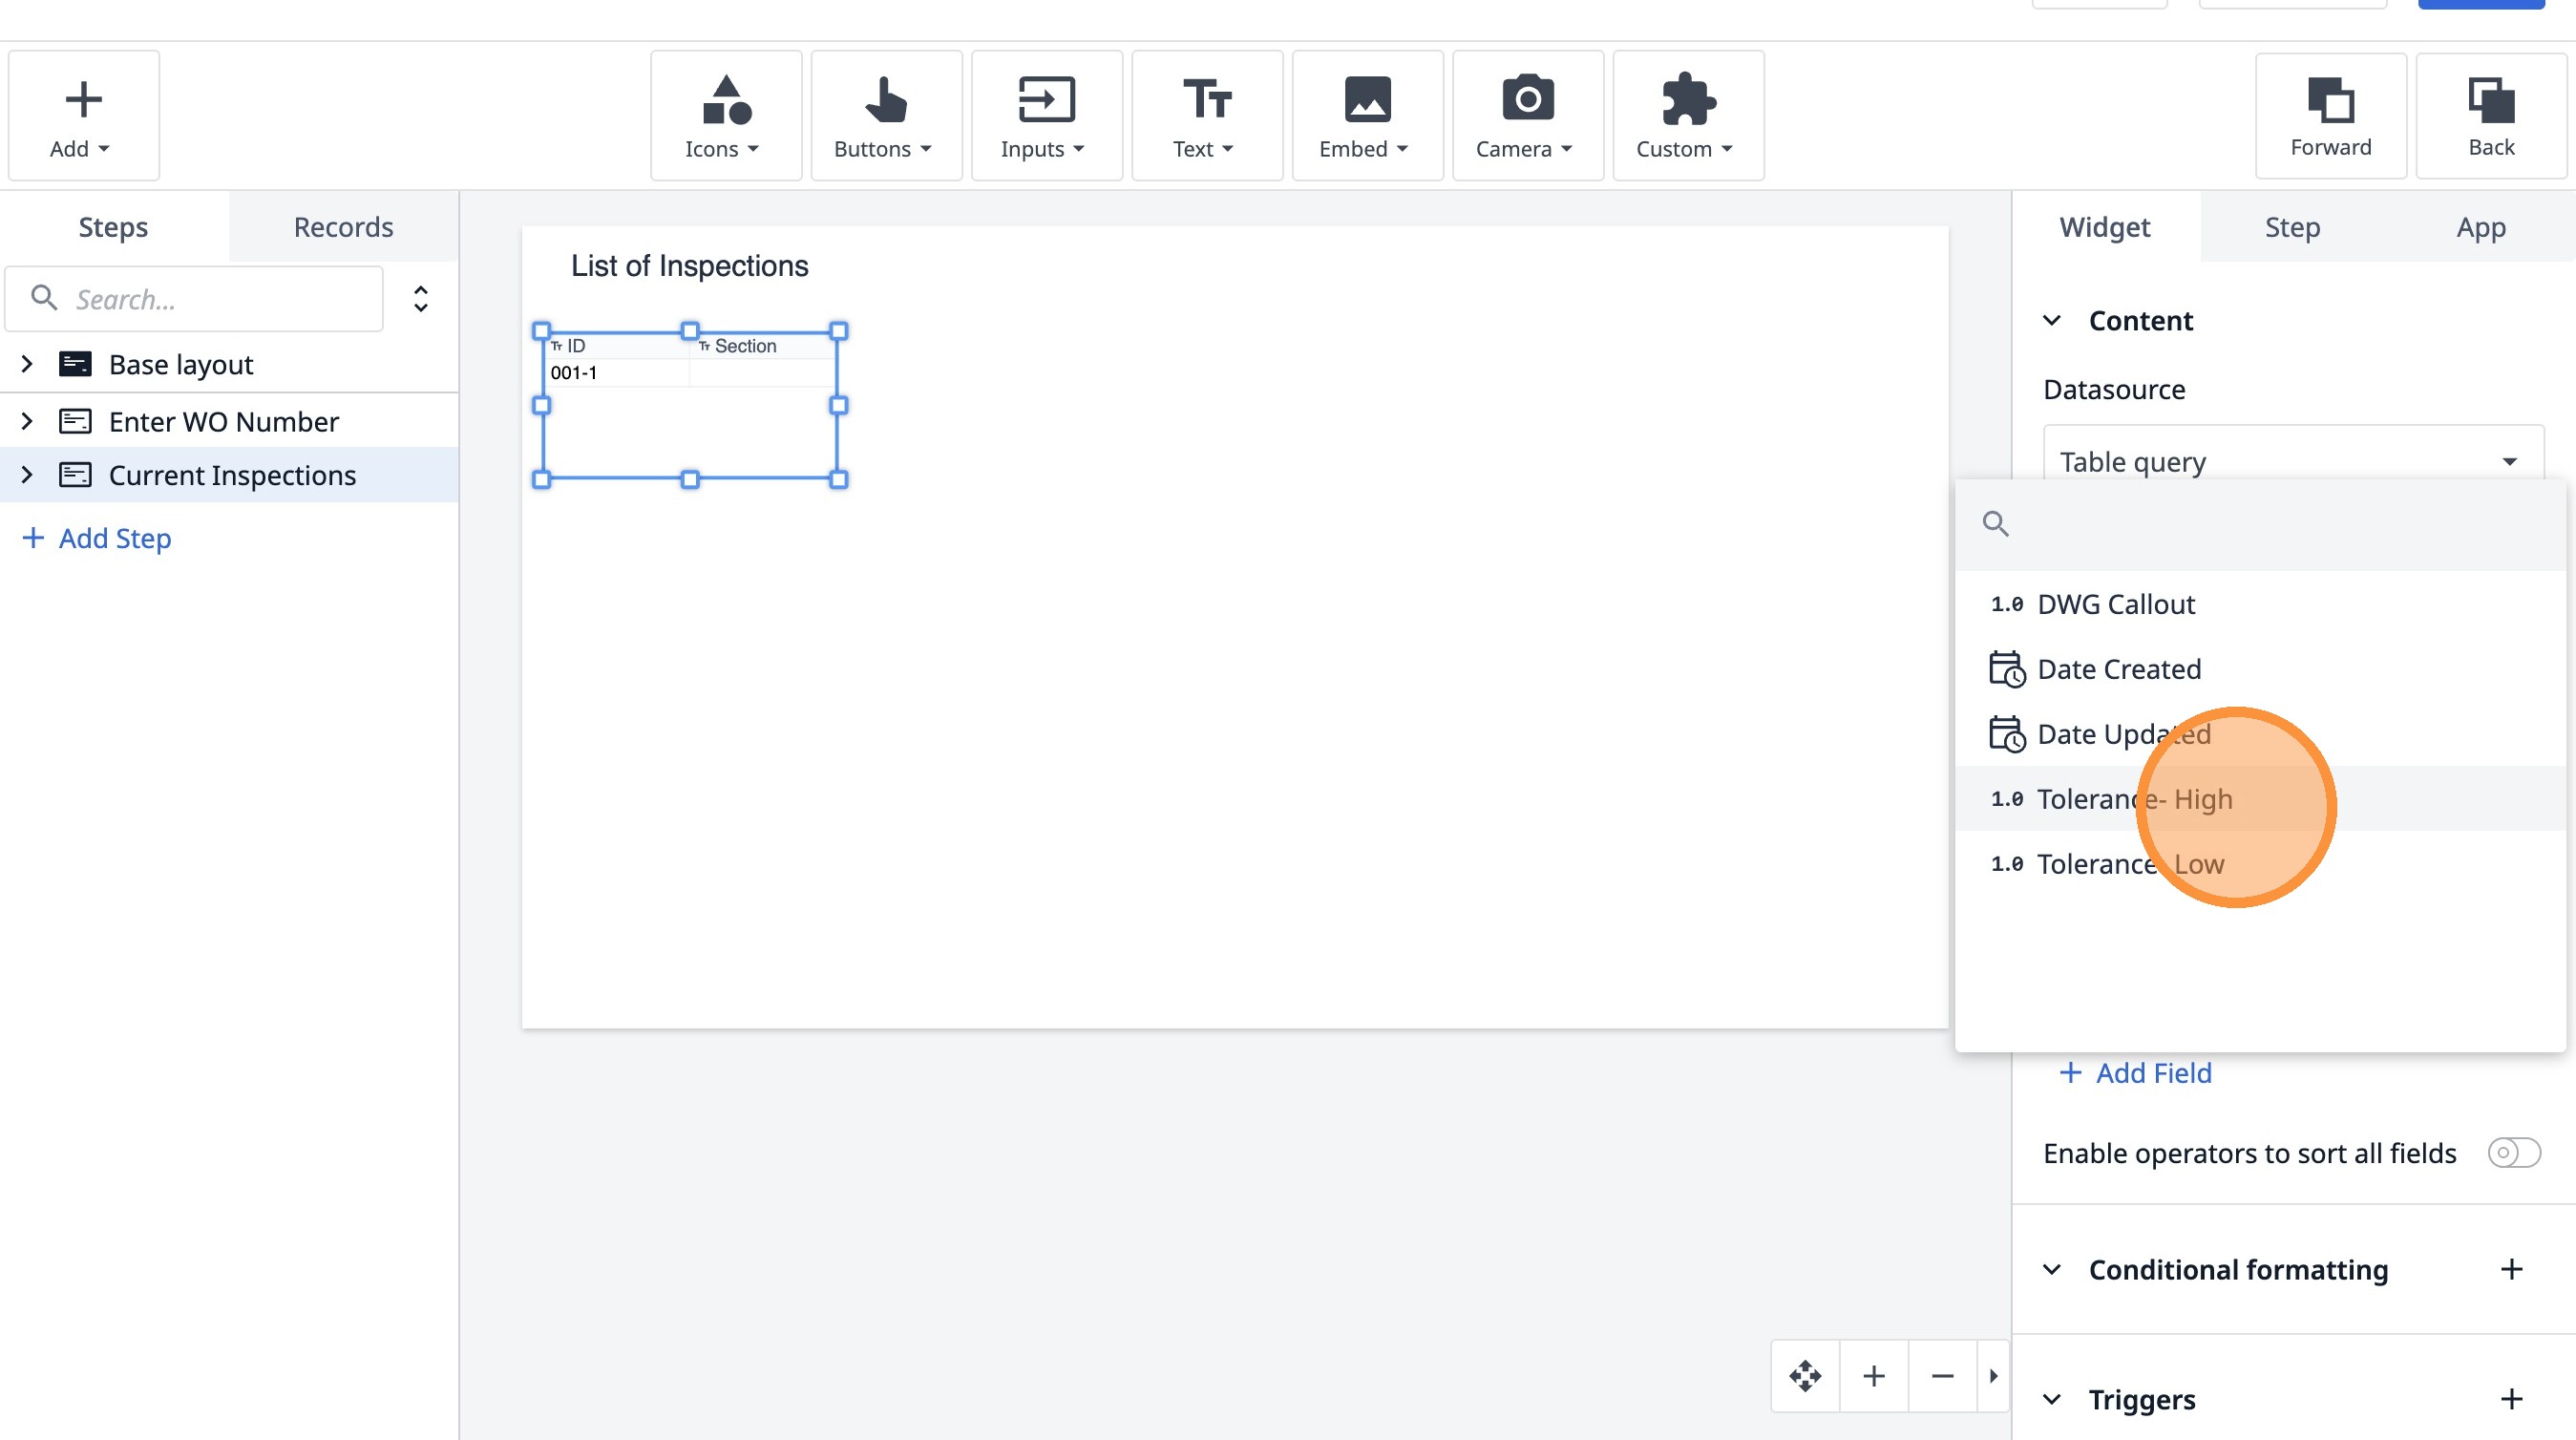
26. Click "Add Field"
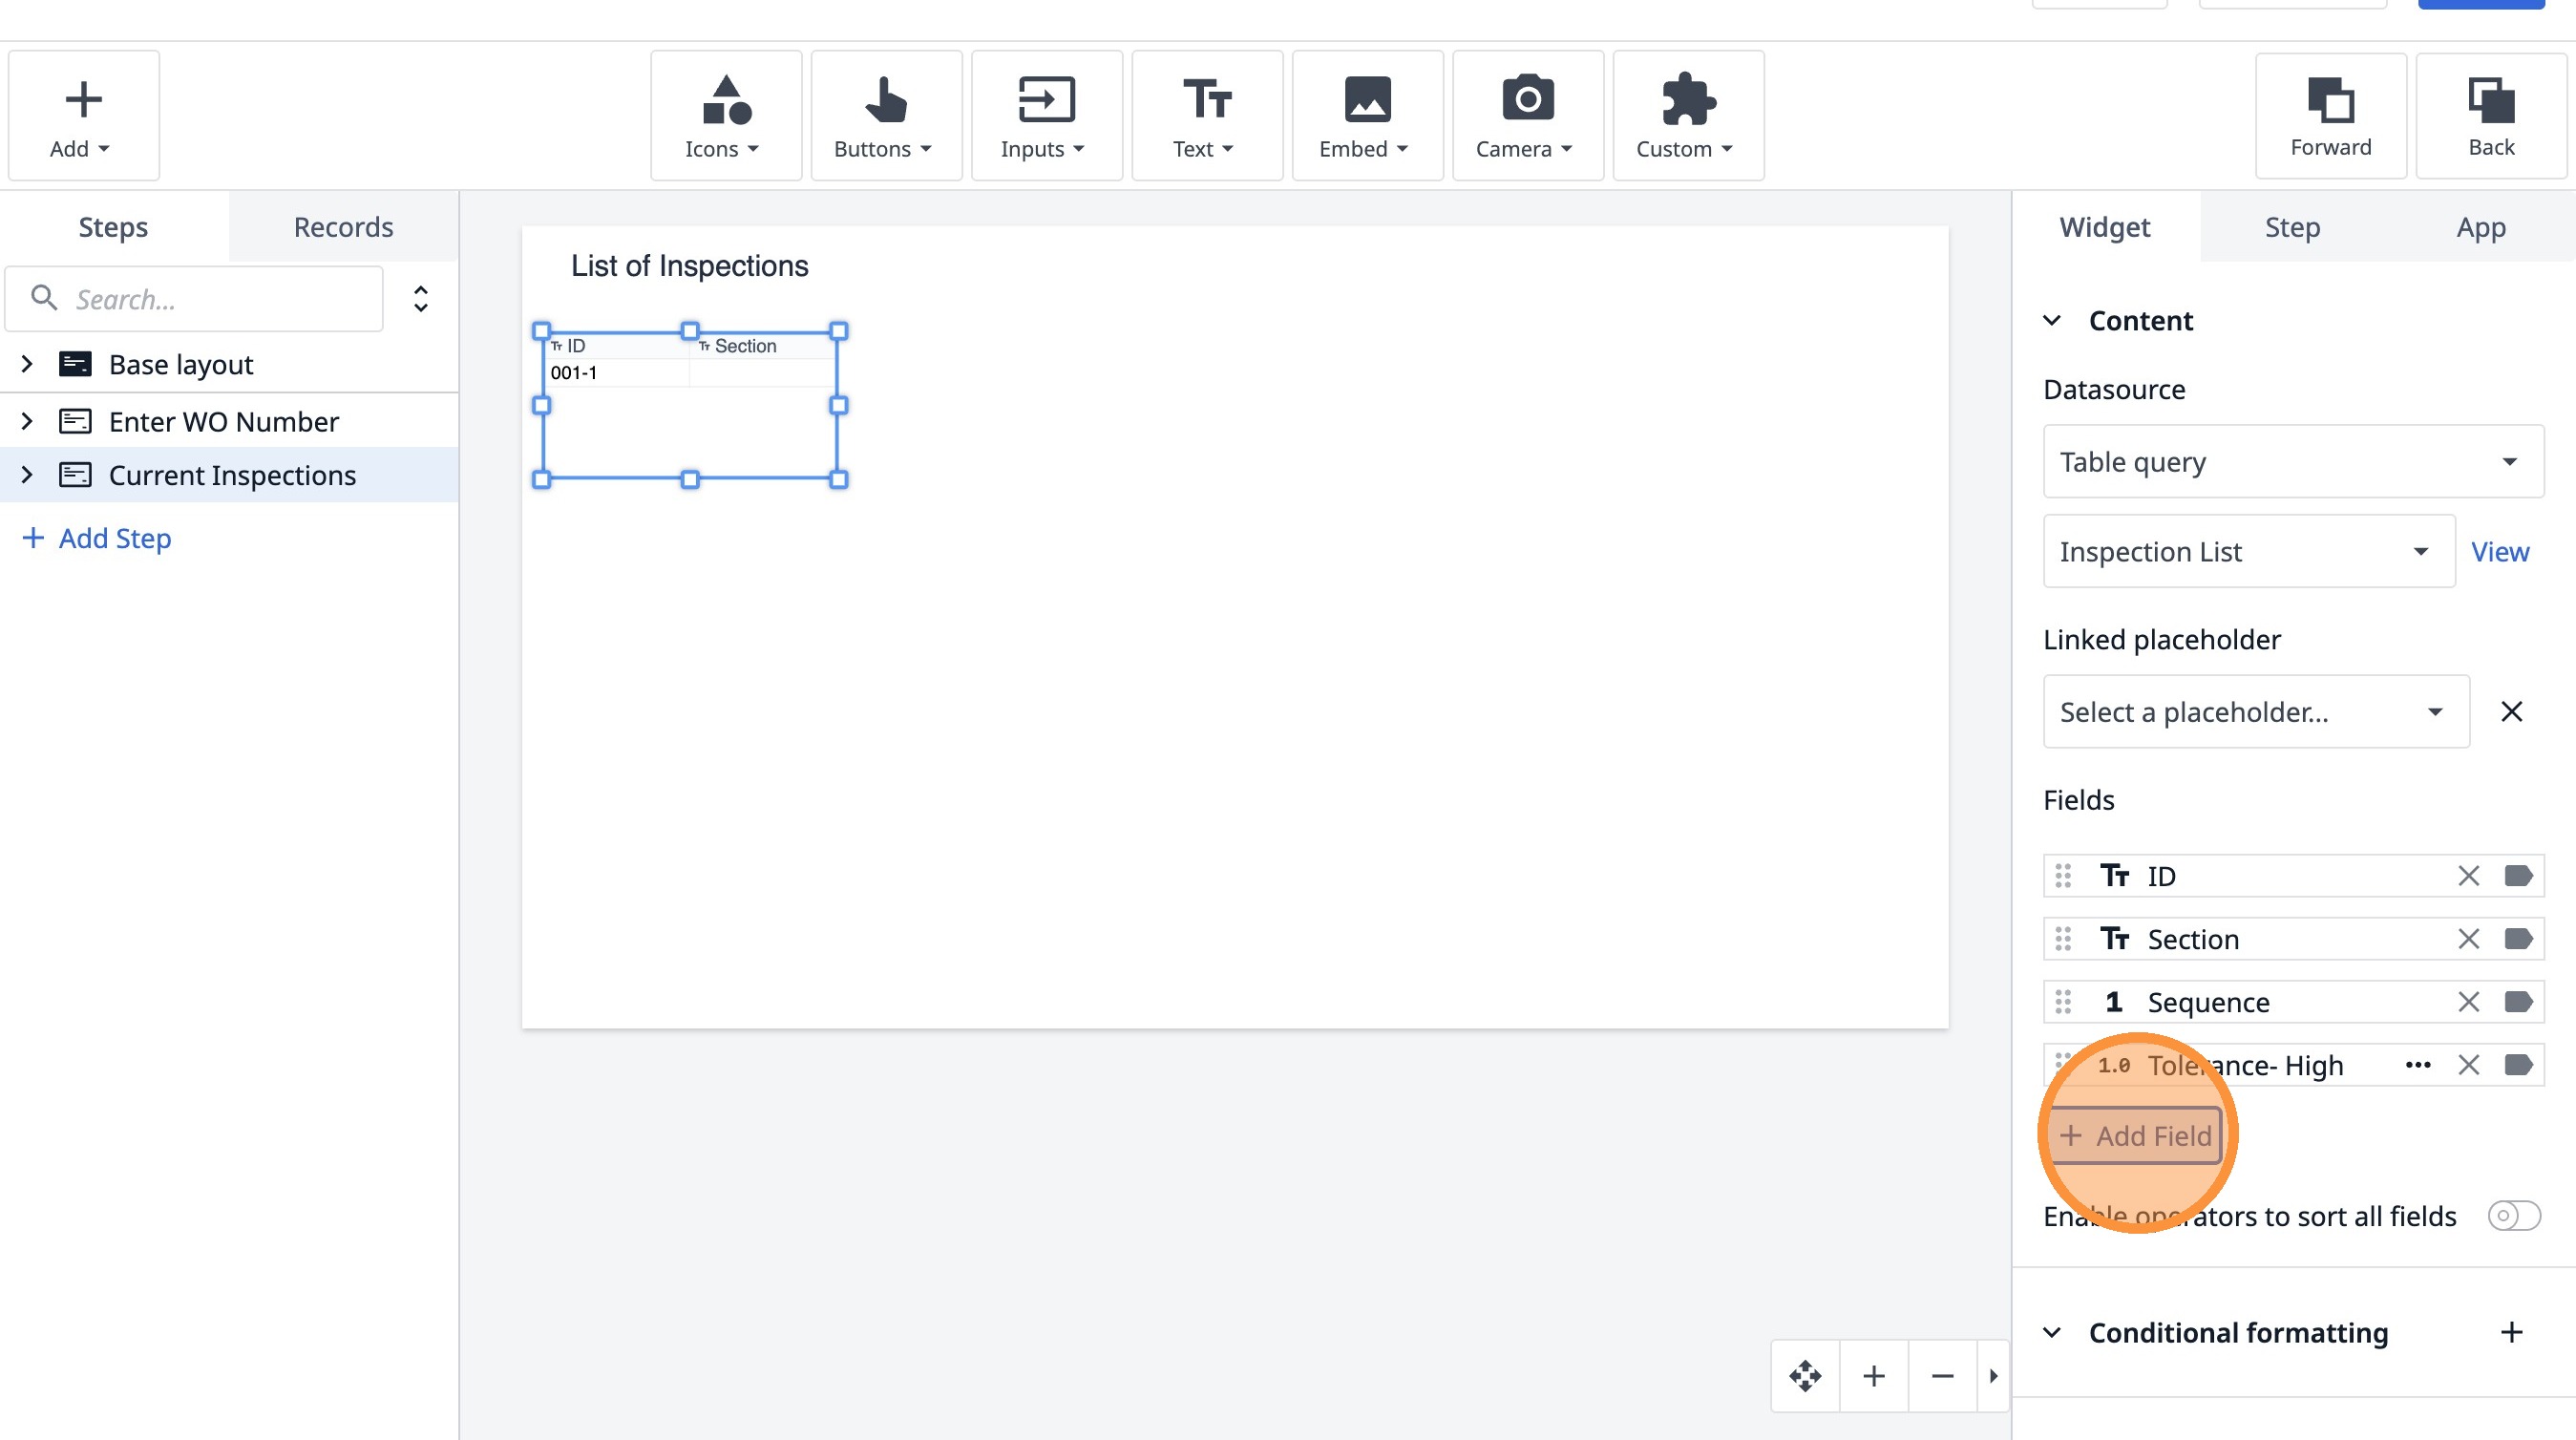
27. Click "Tolerance- High"
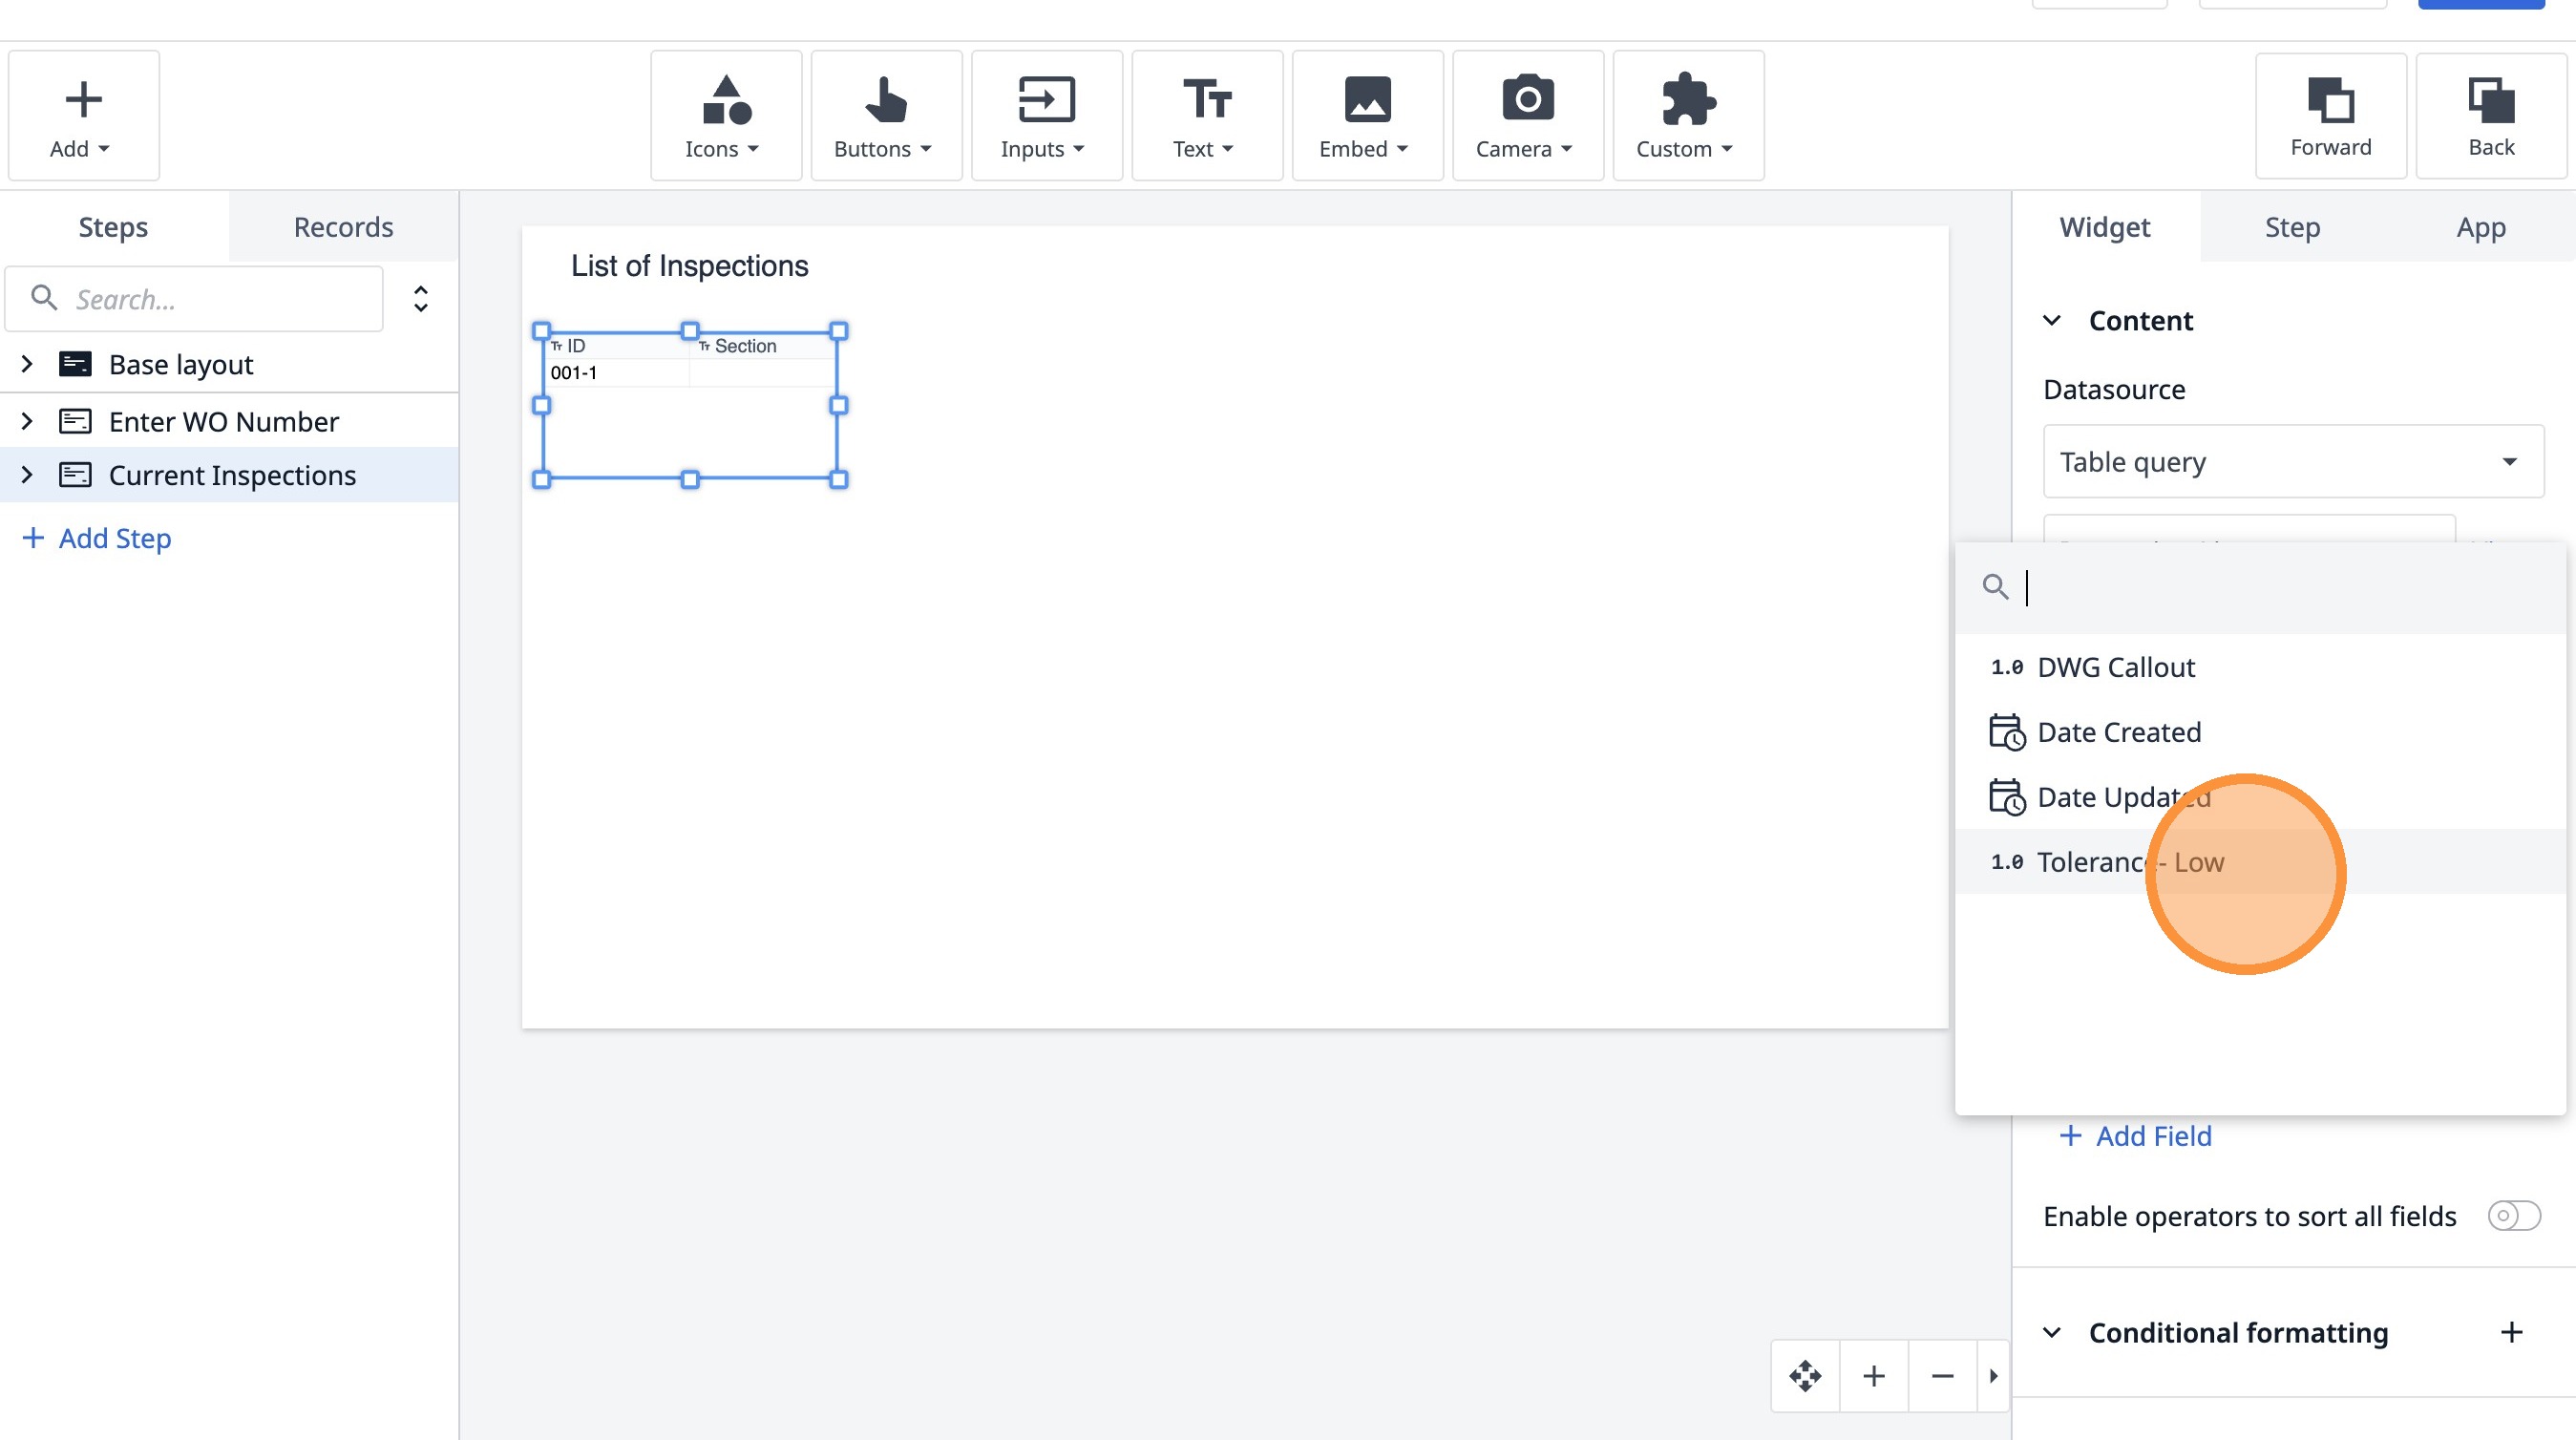
28. Click "Add Field"
29. Click "Tolerance- Low"
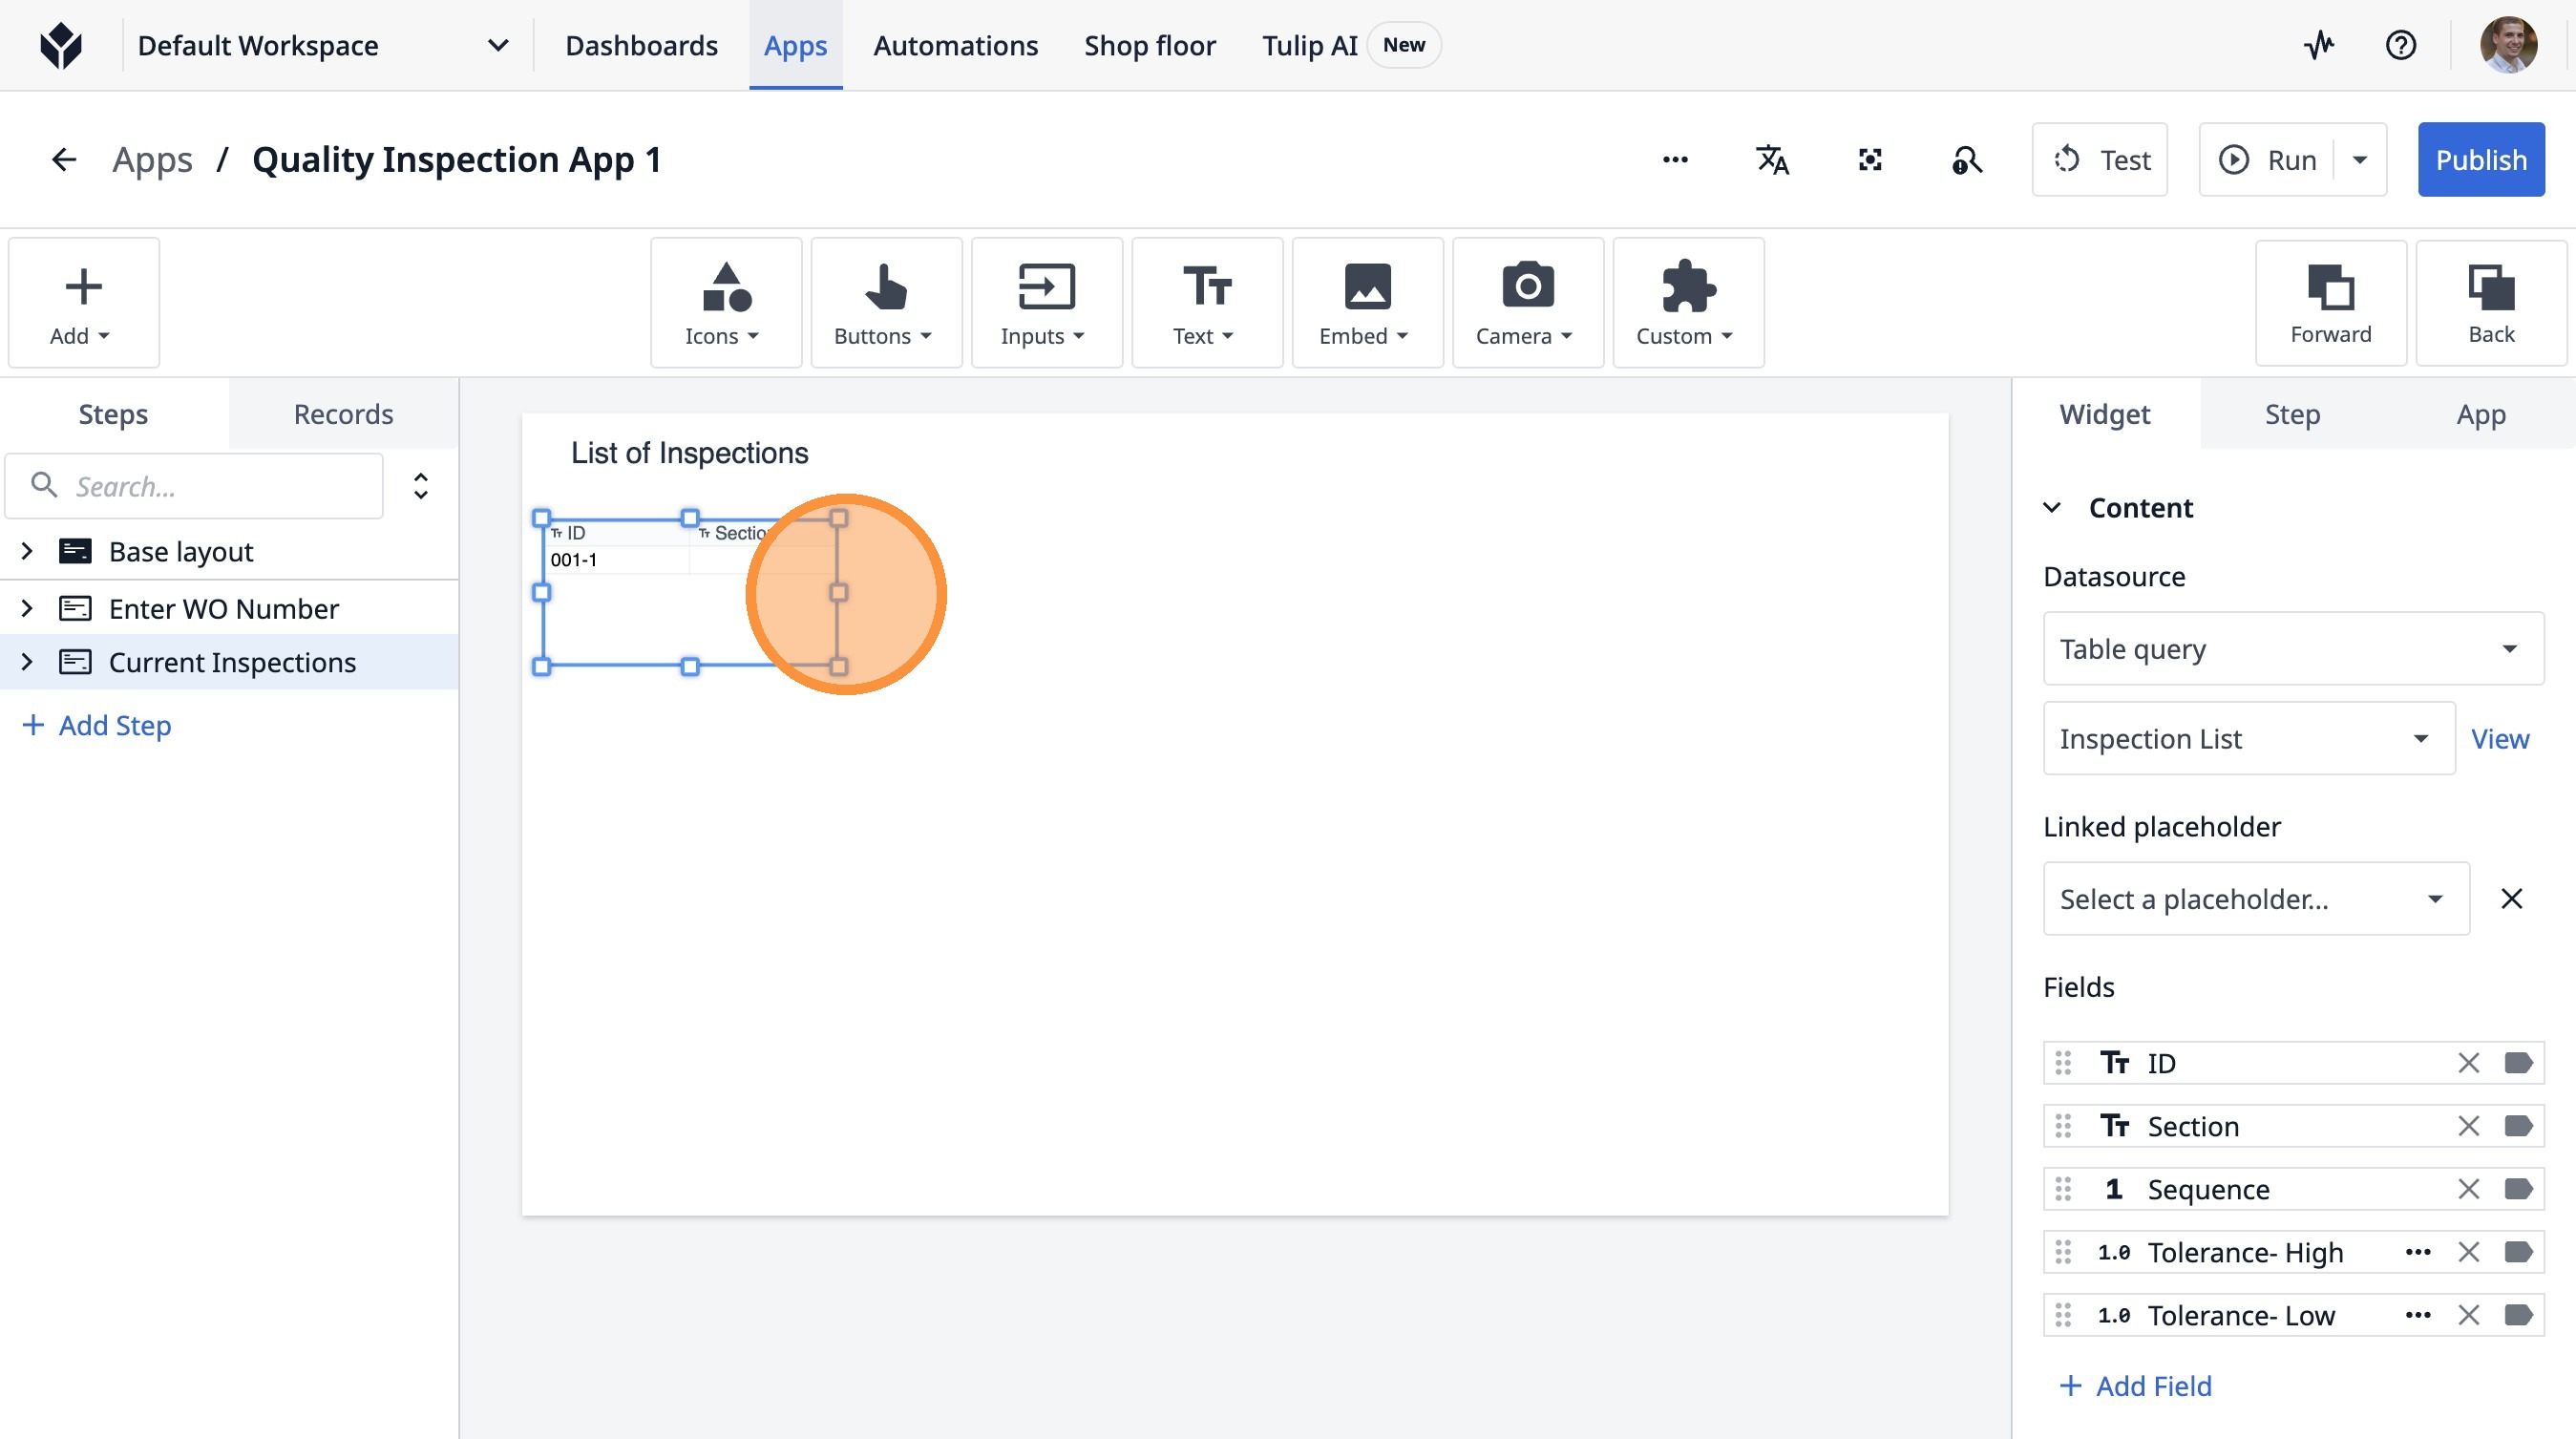
30. Click here.

31. Click here.
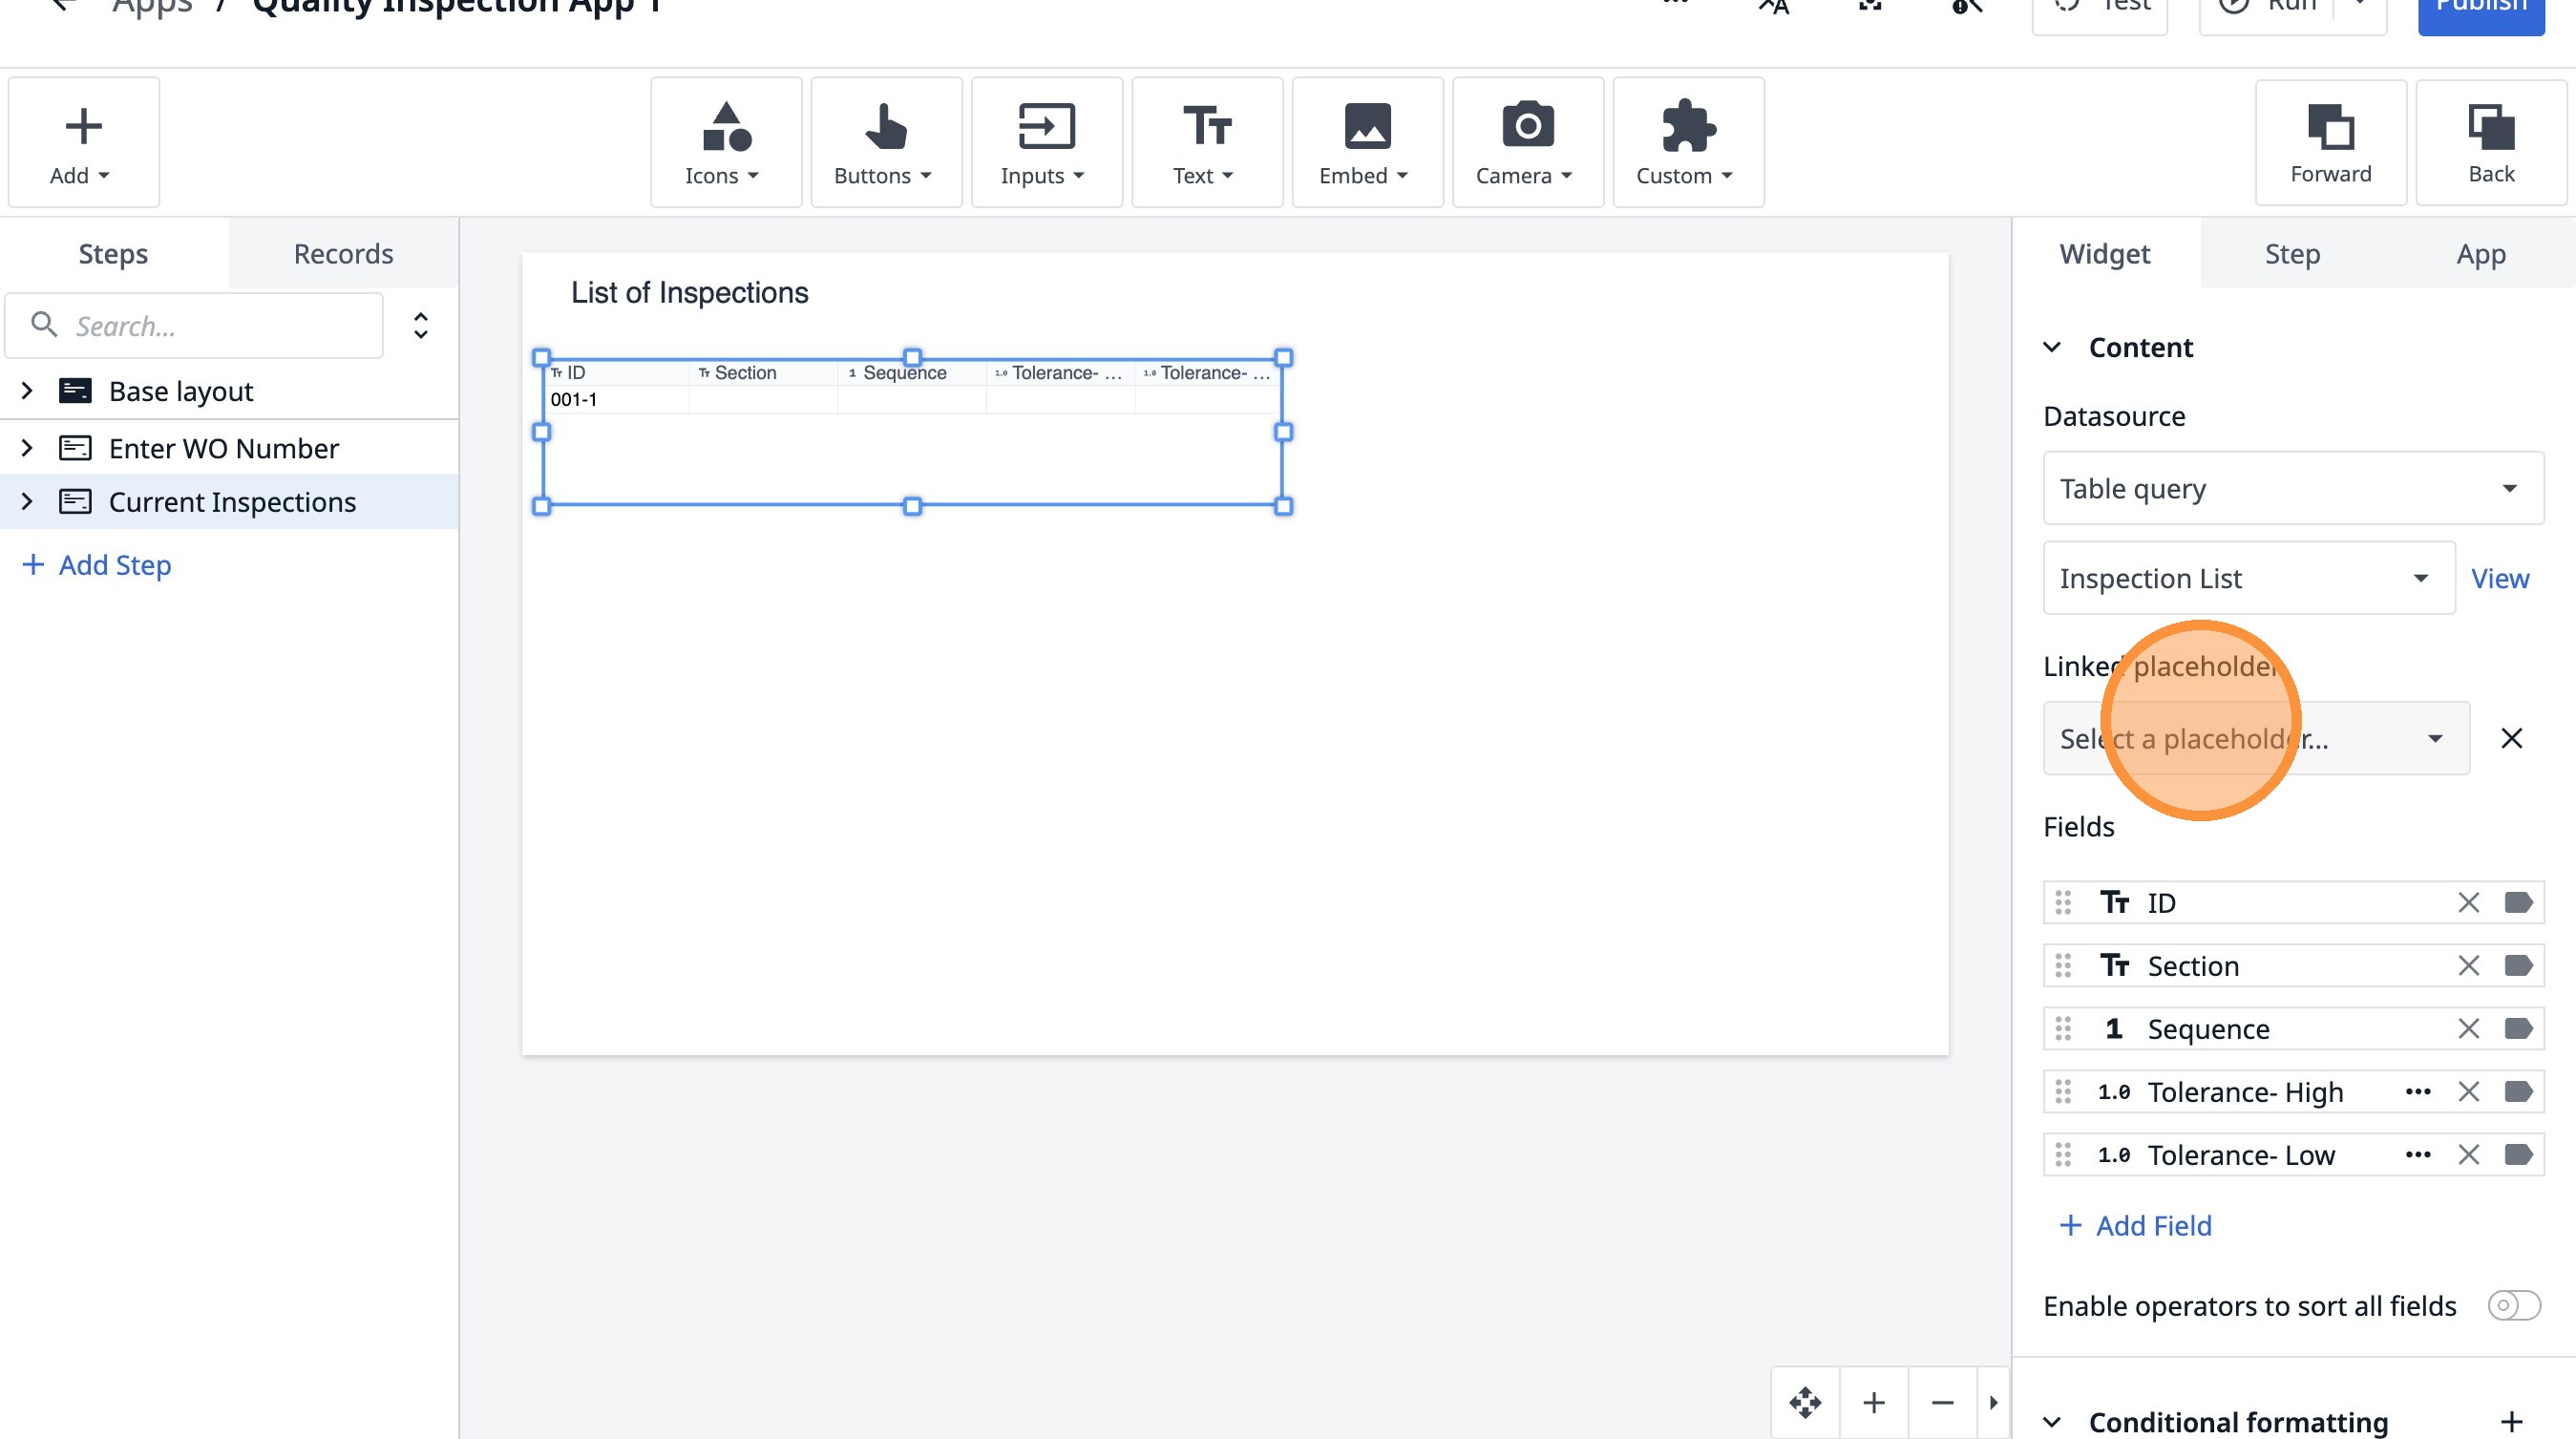
32. Click "Select a placeholder..."
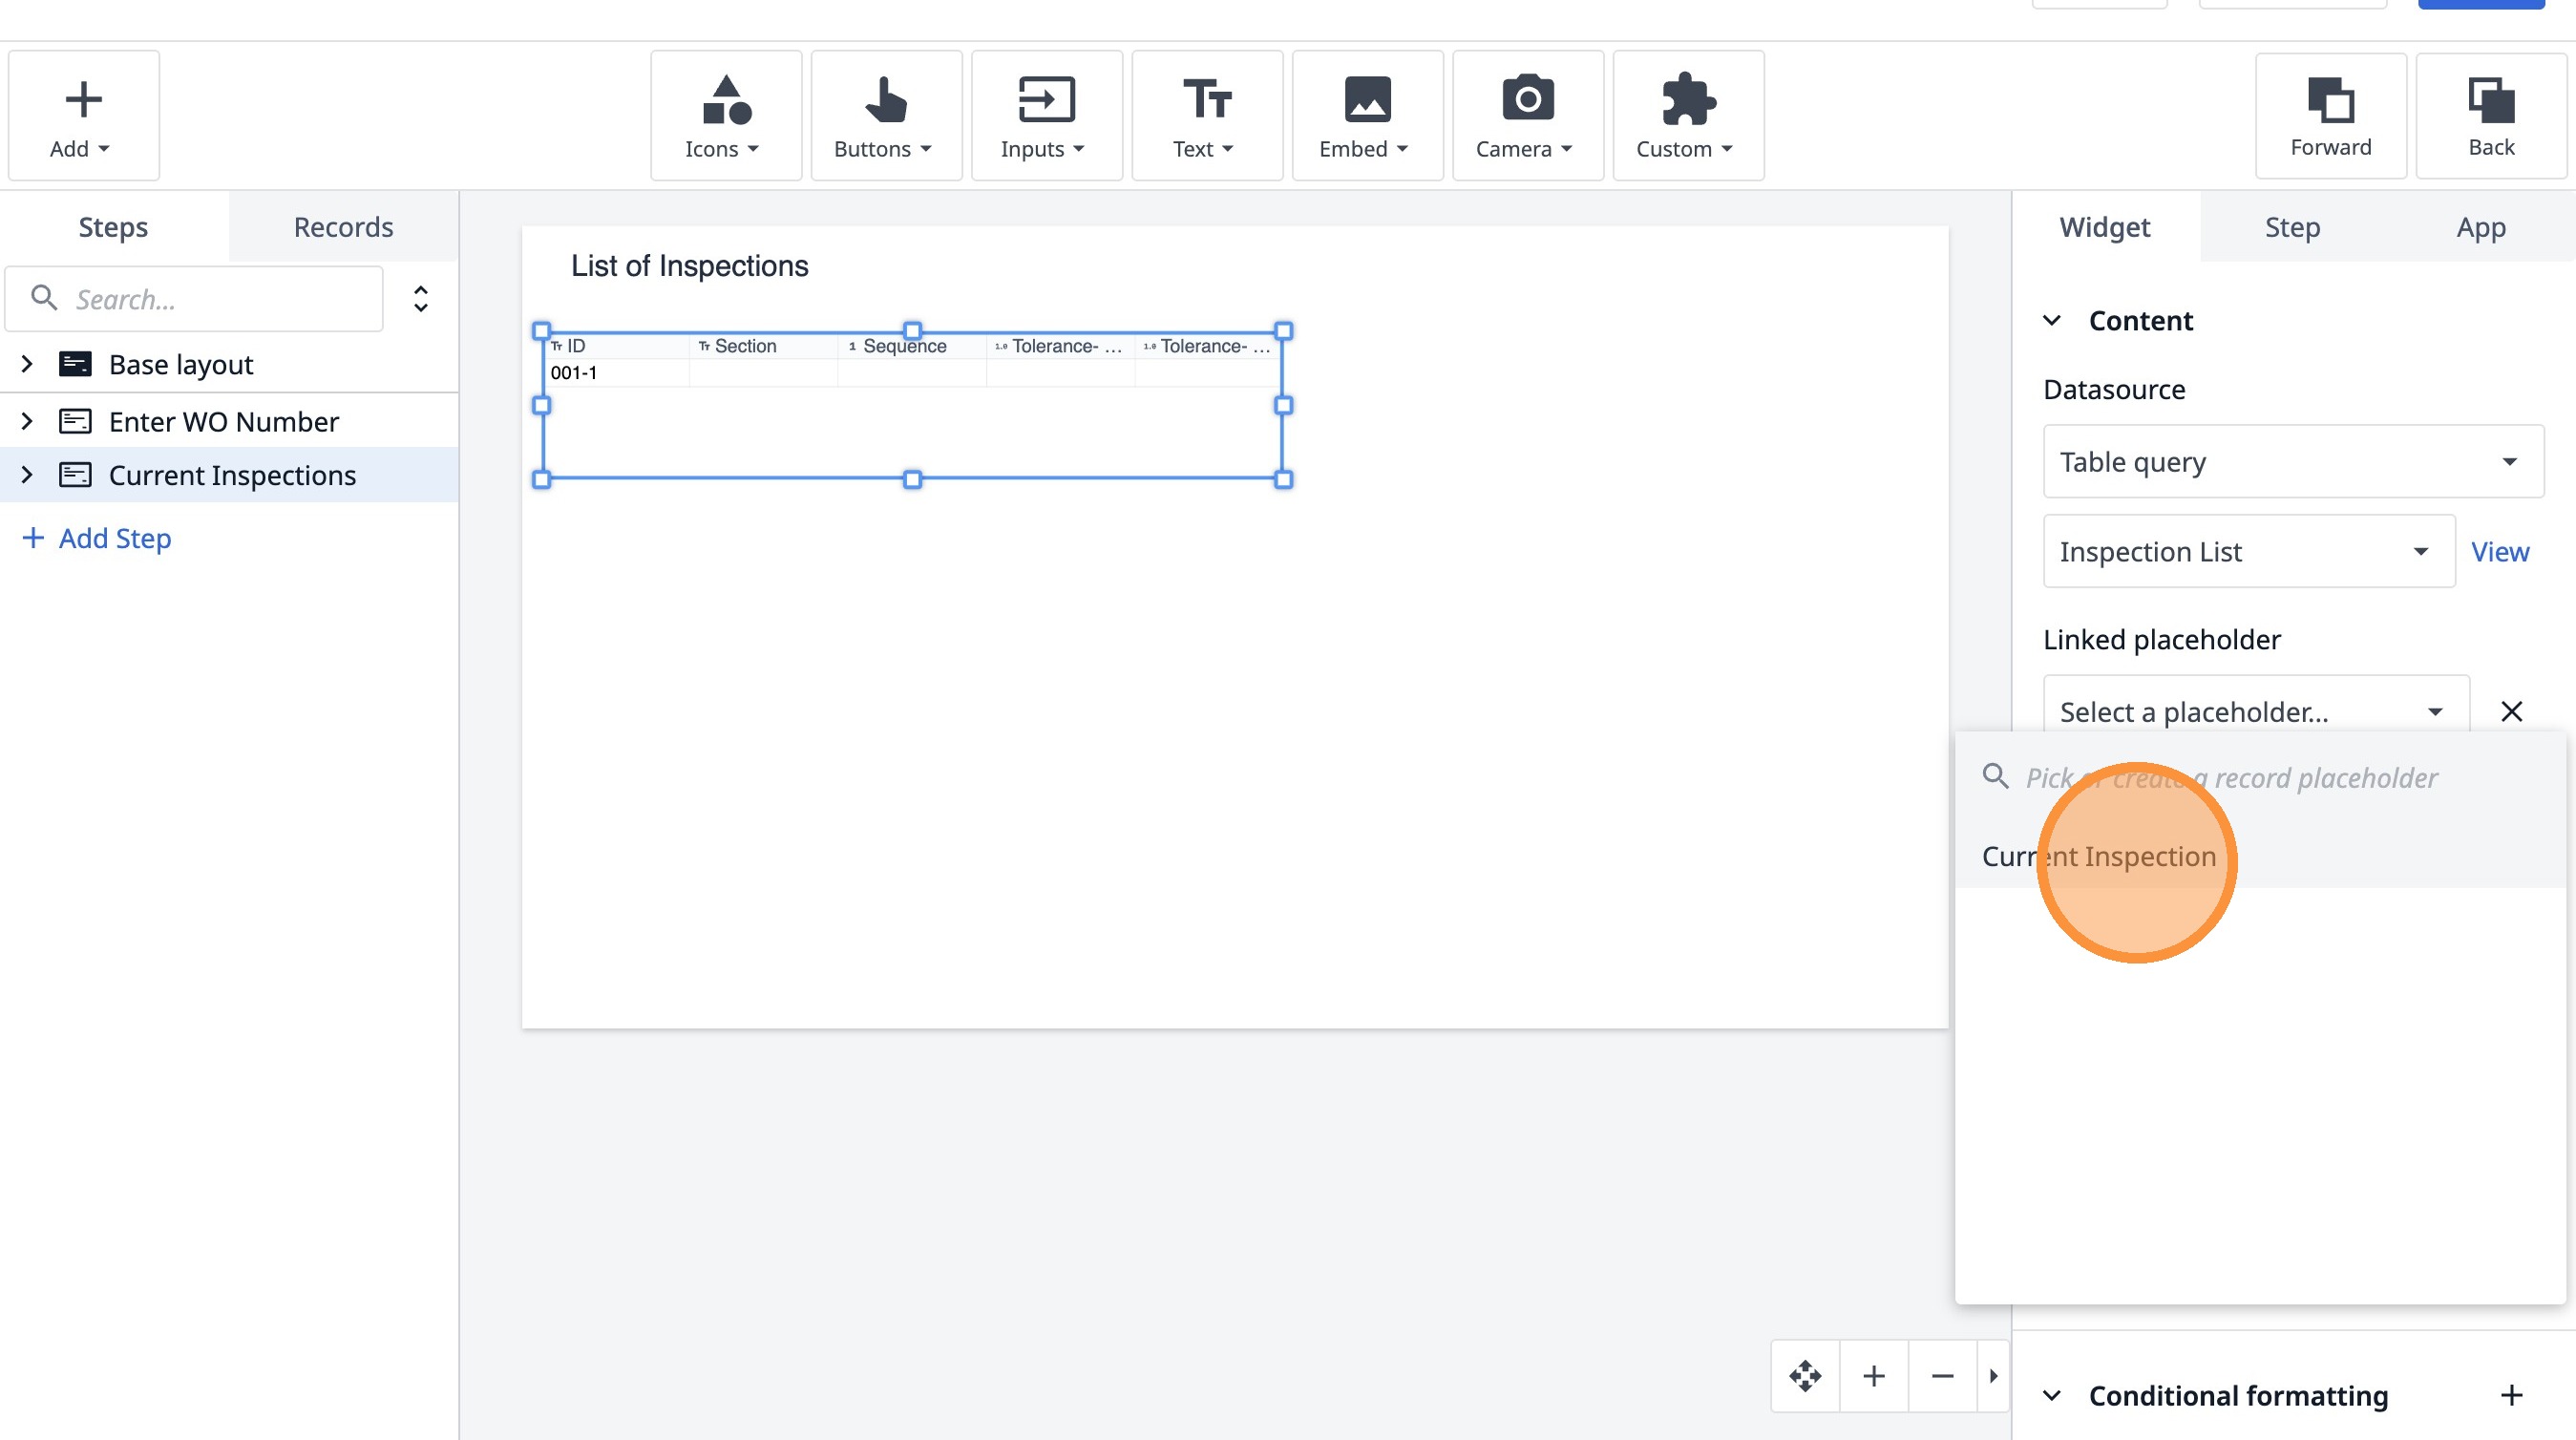
33. Click "Current Inspection"
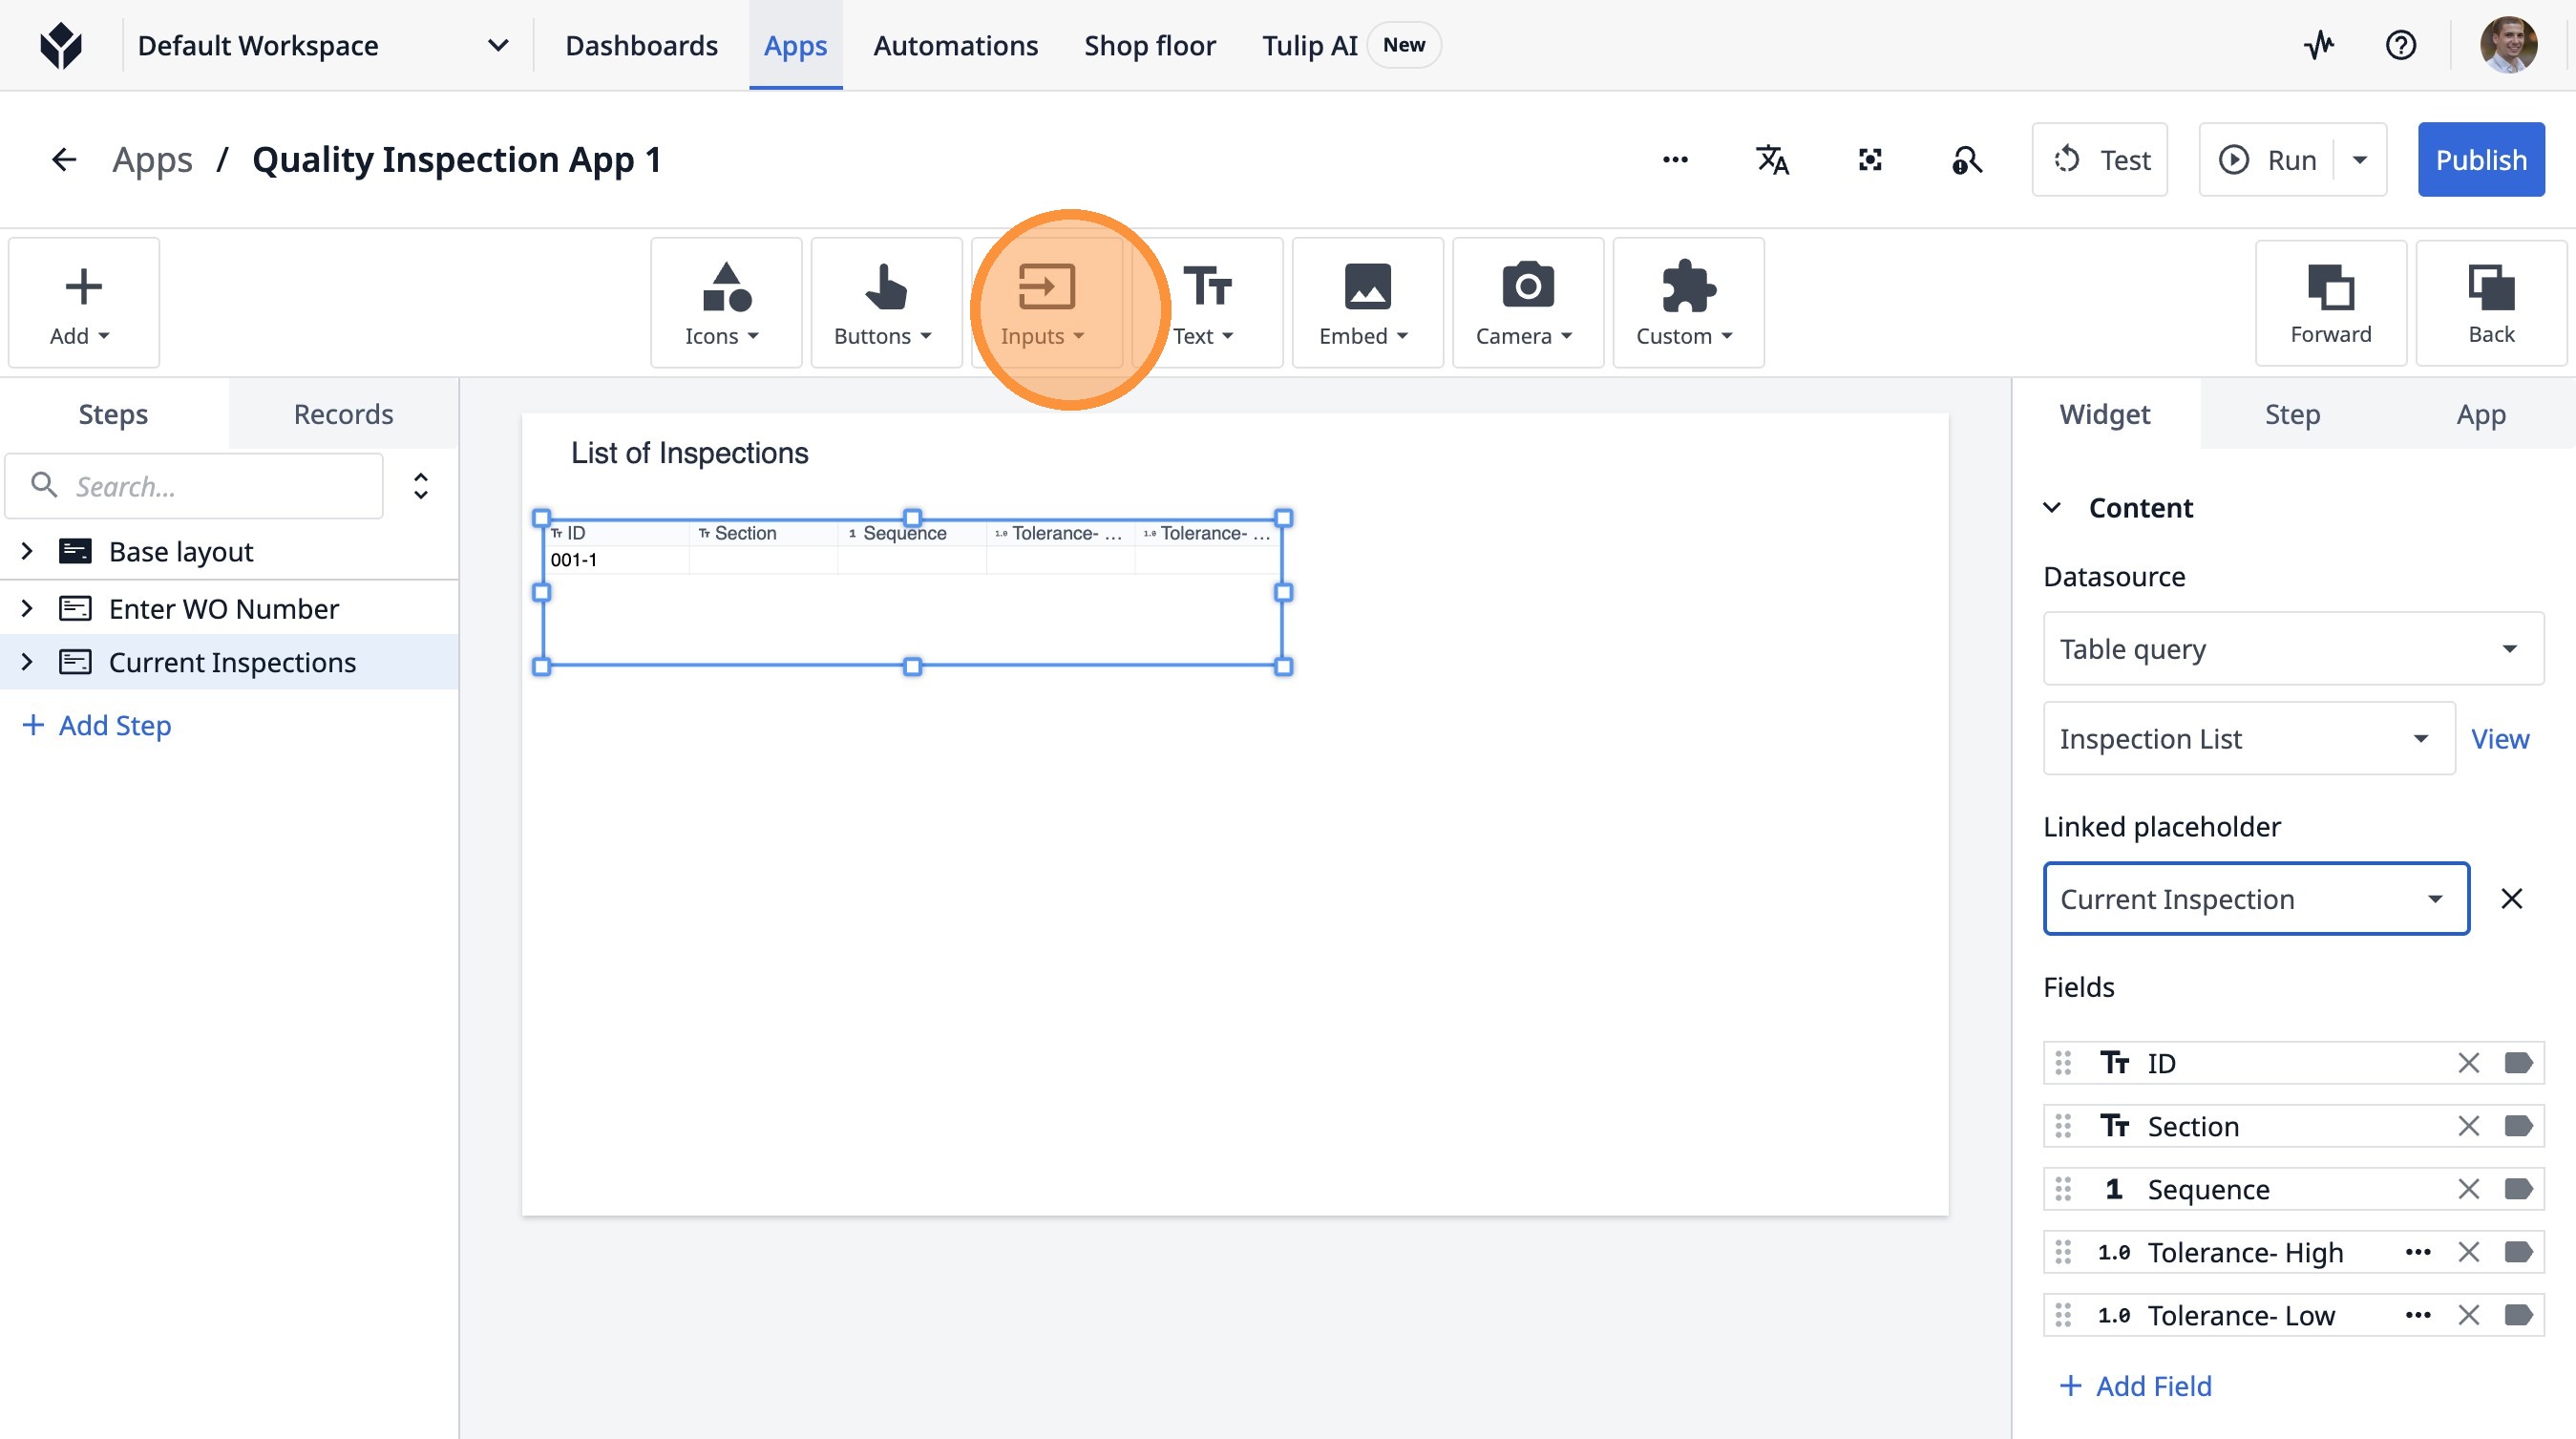
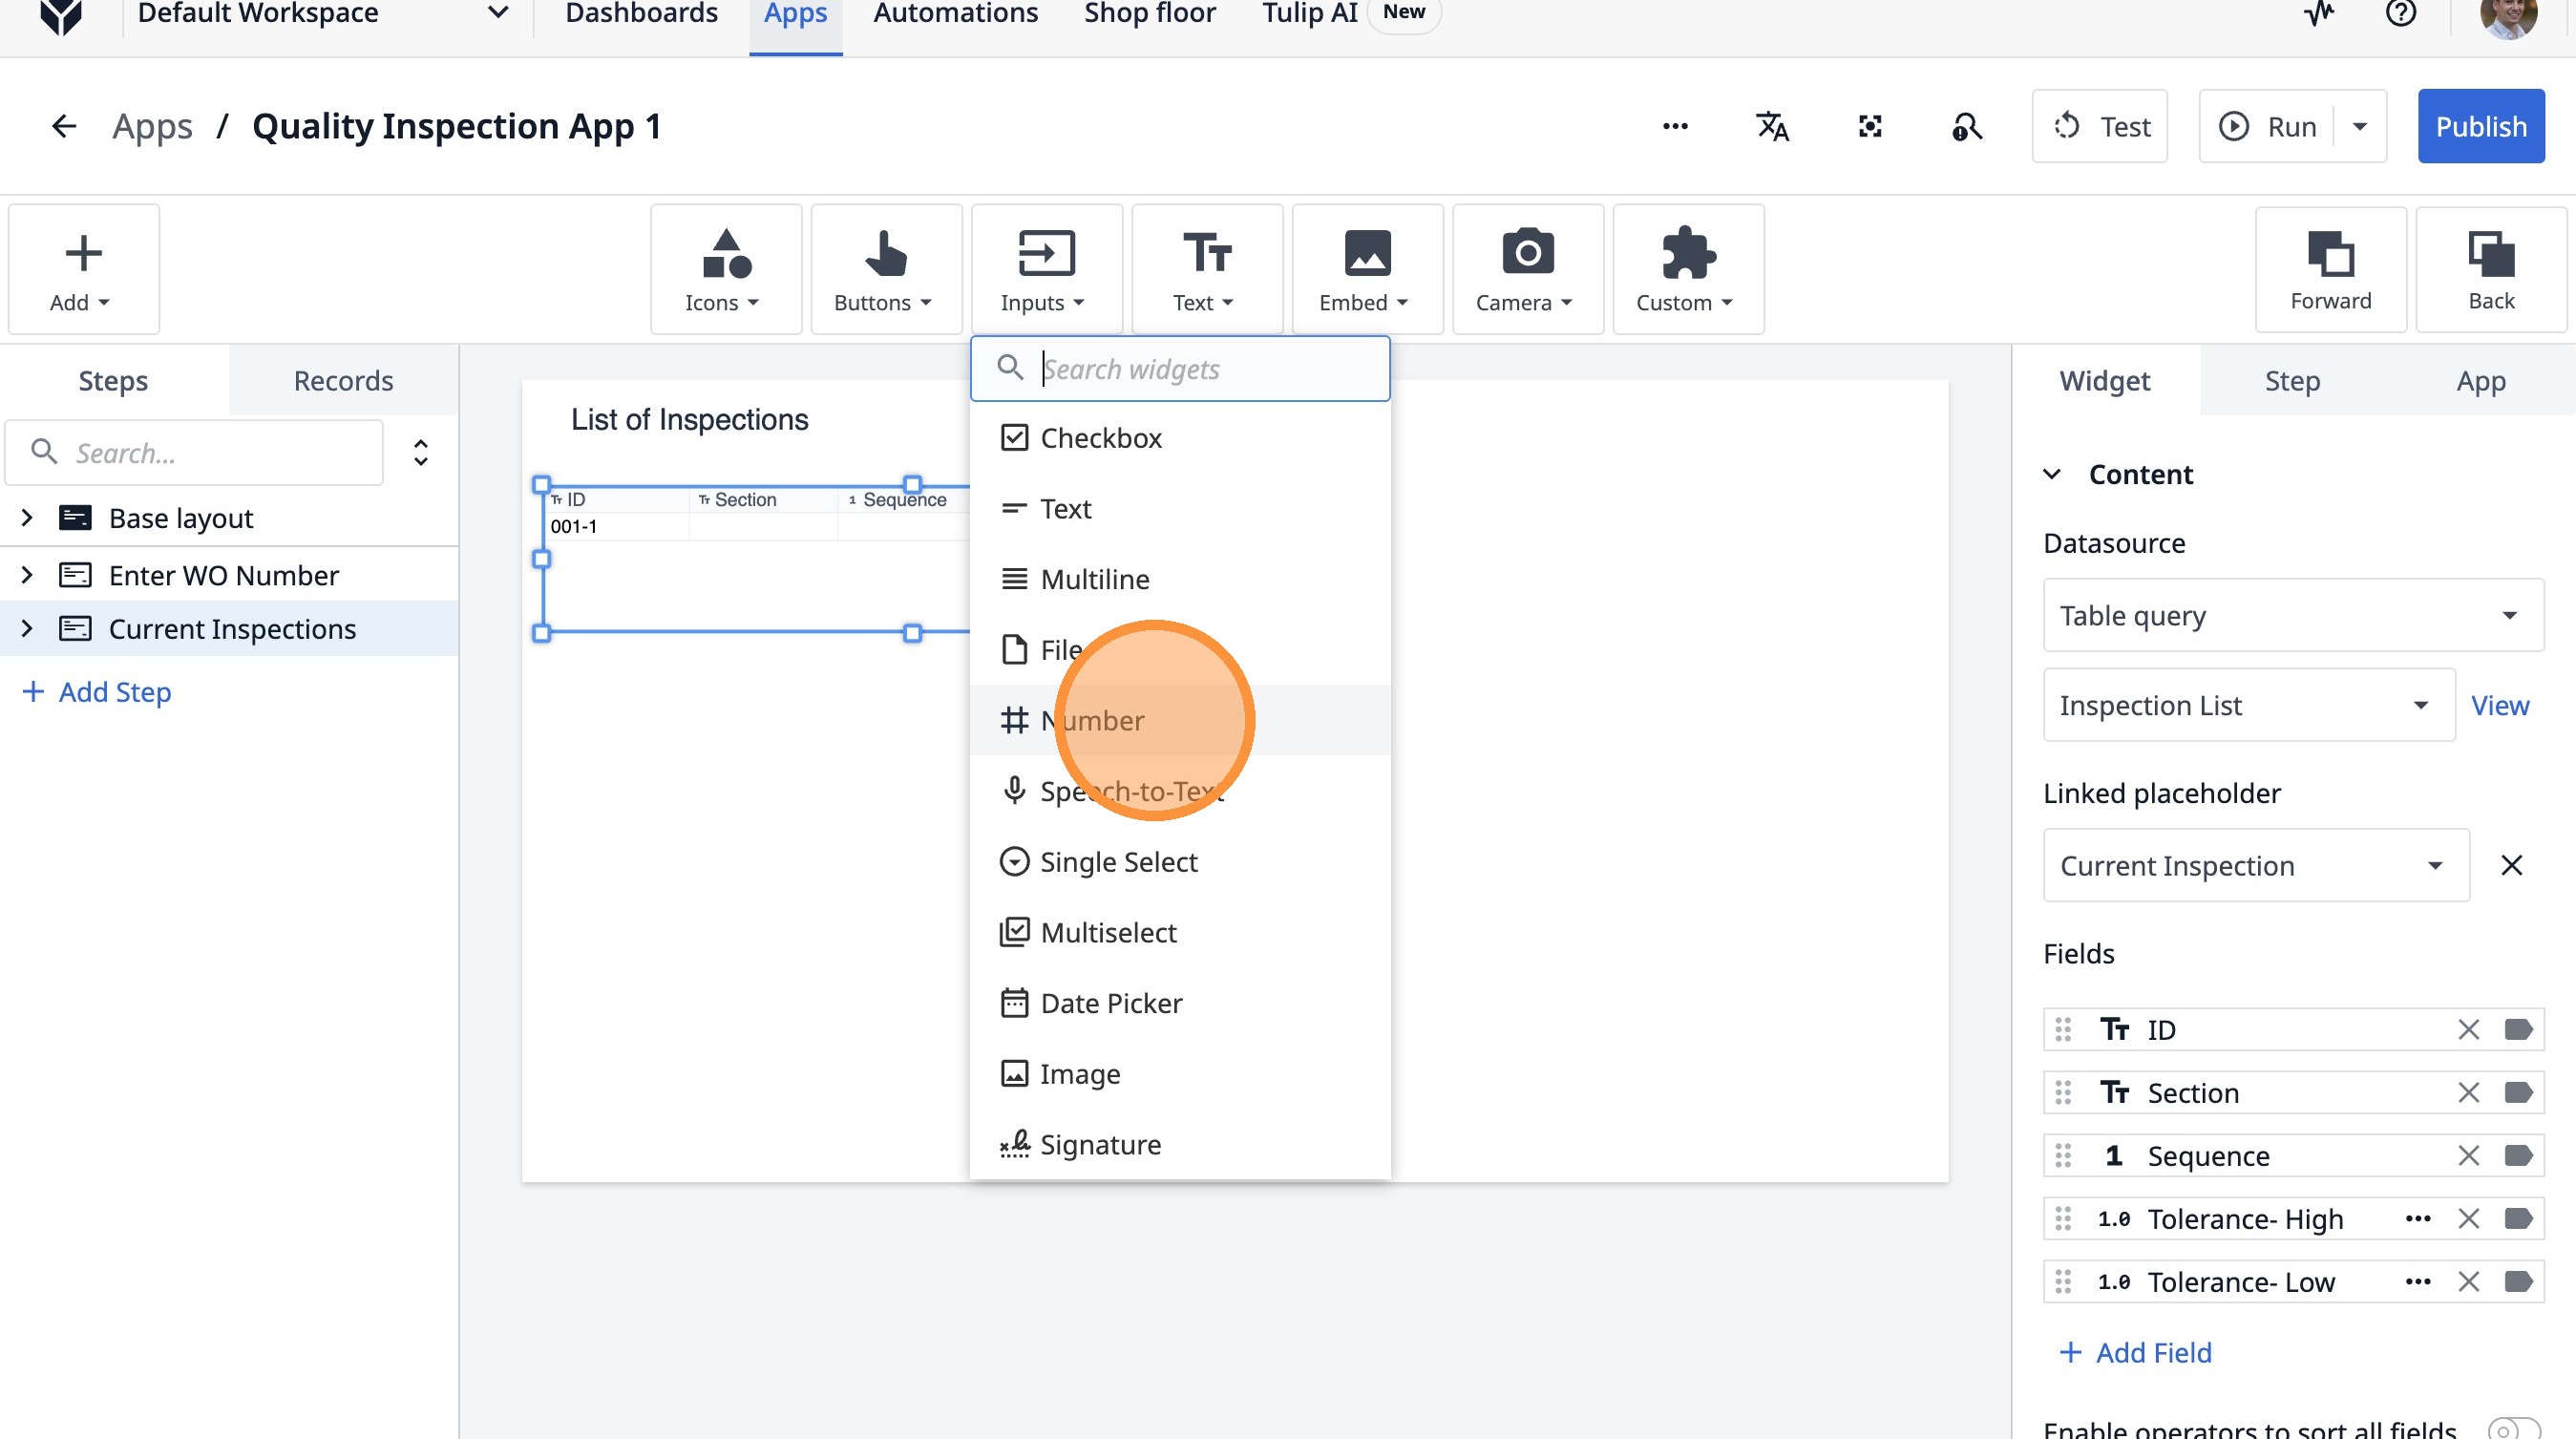
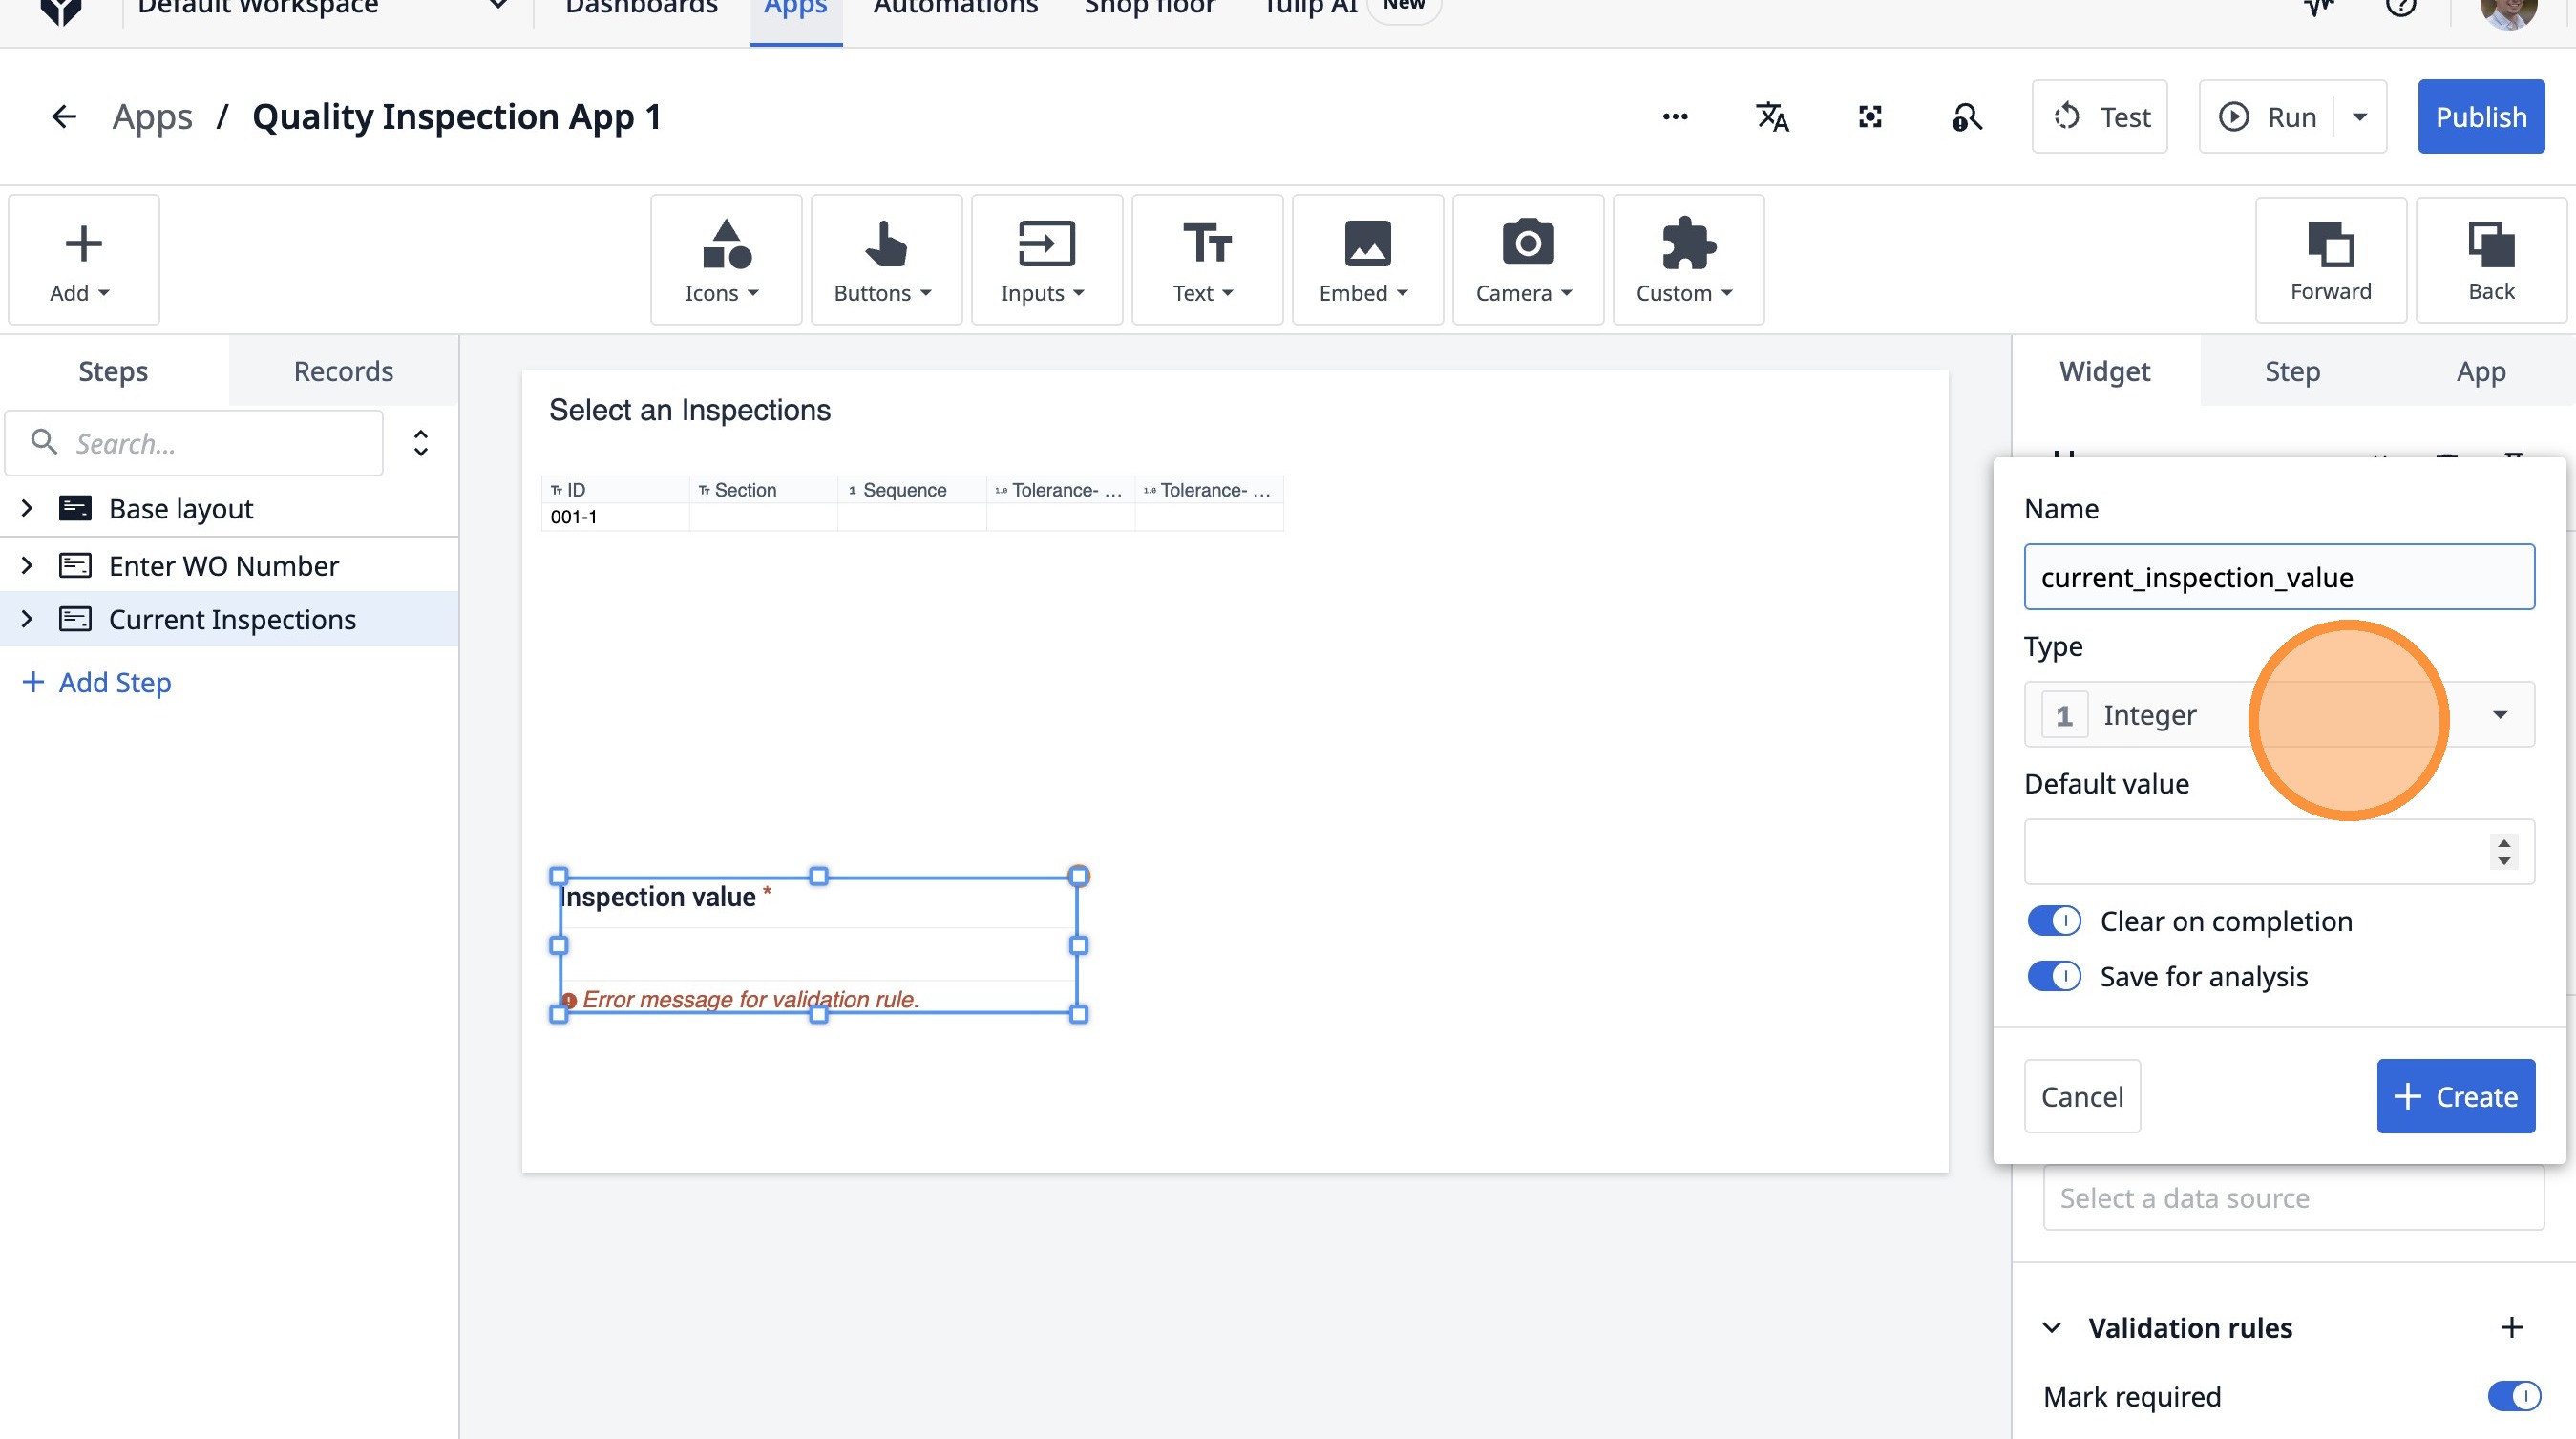
34. Click this icon.
35. Click "Number"
36. Click here.
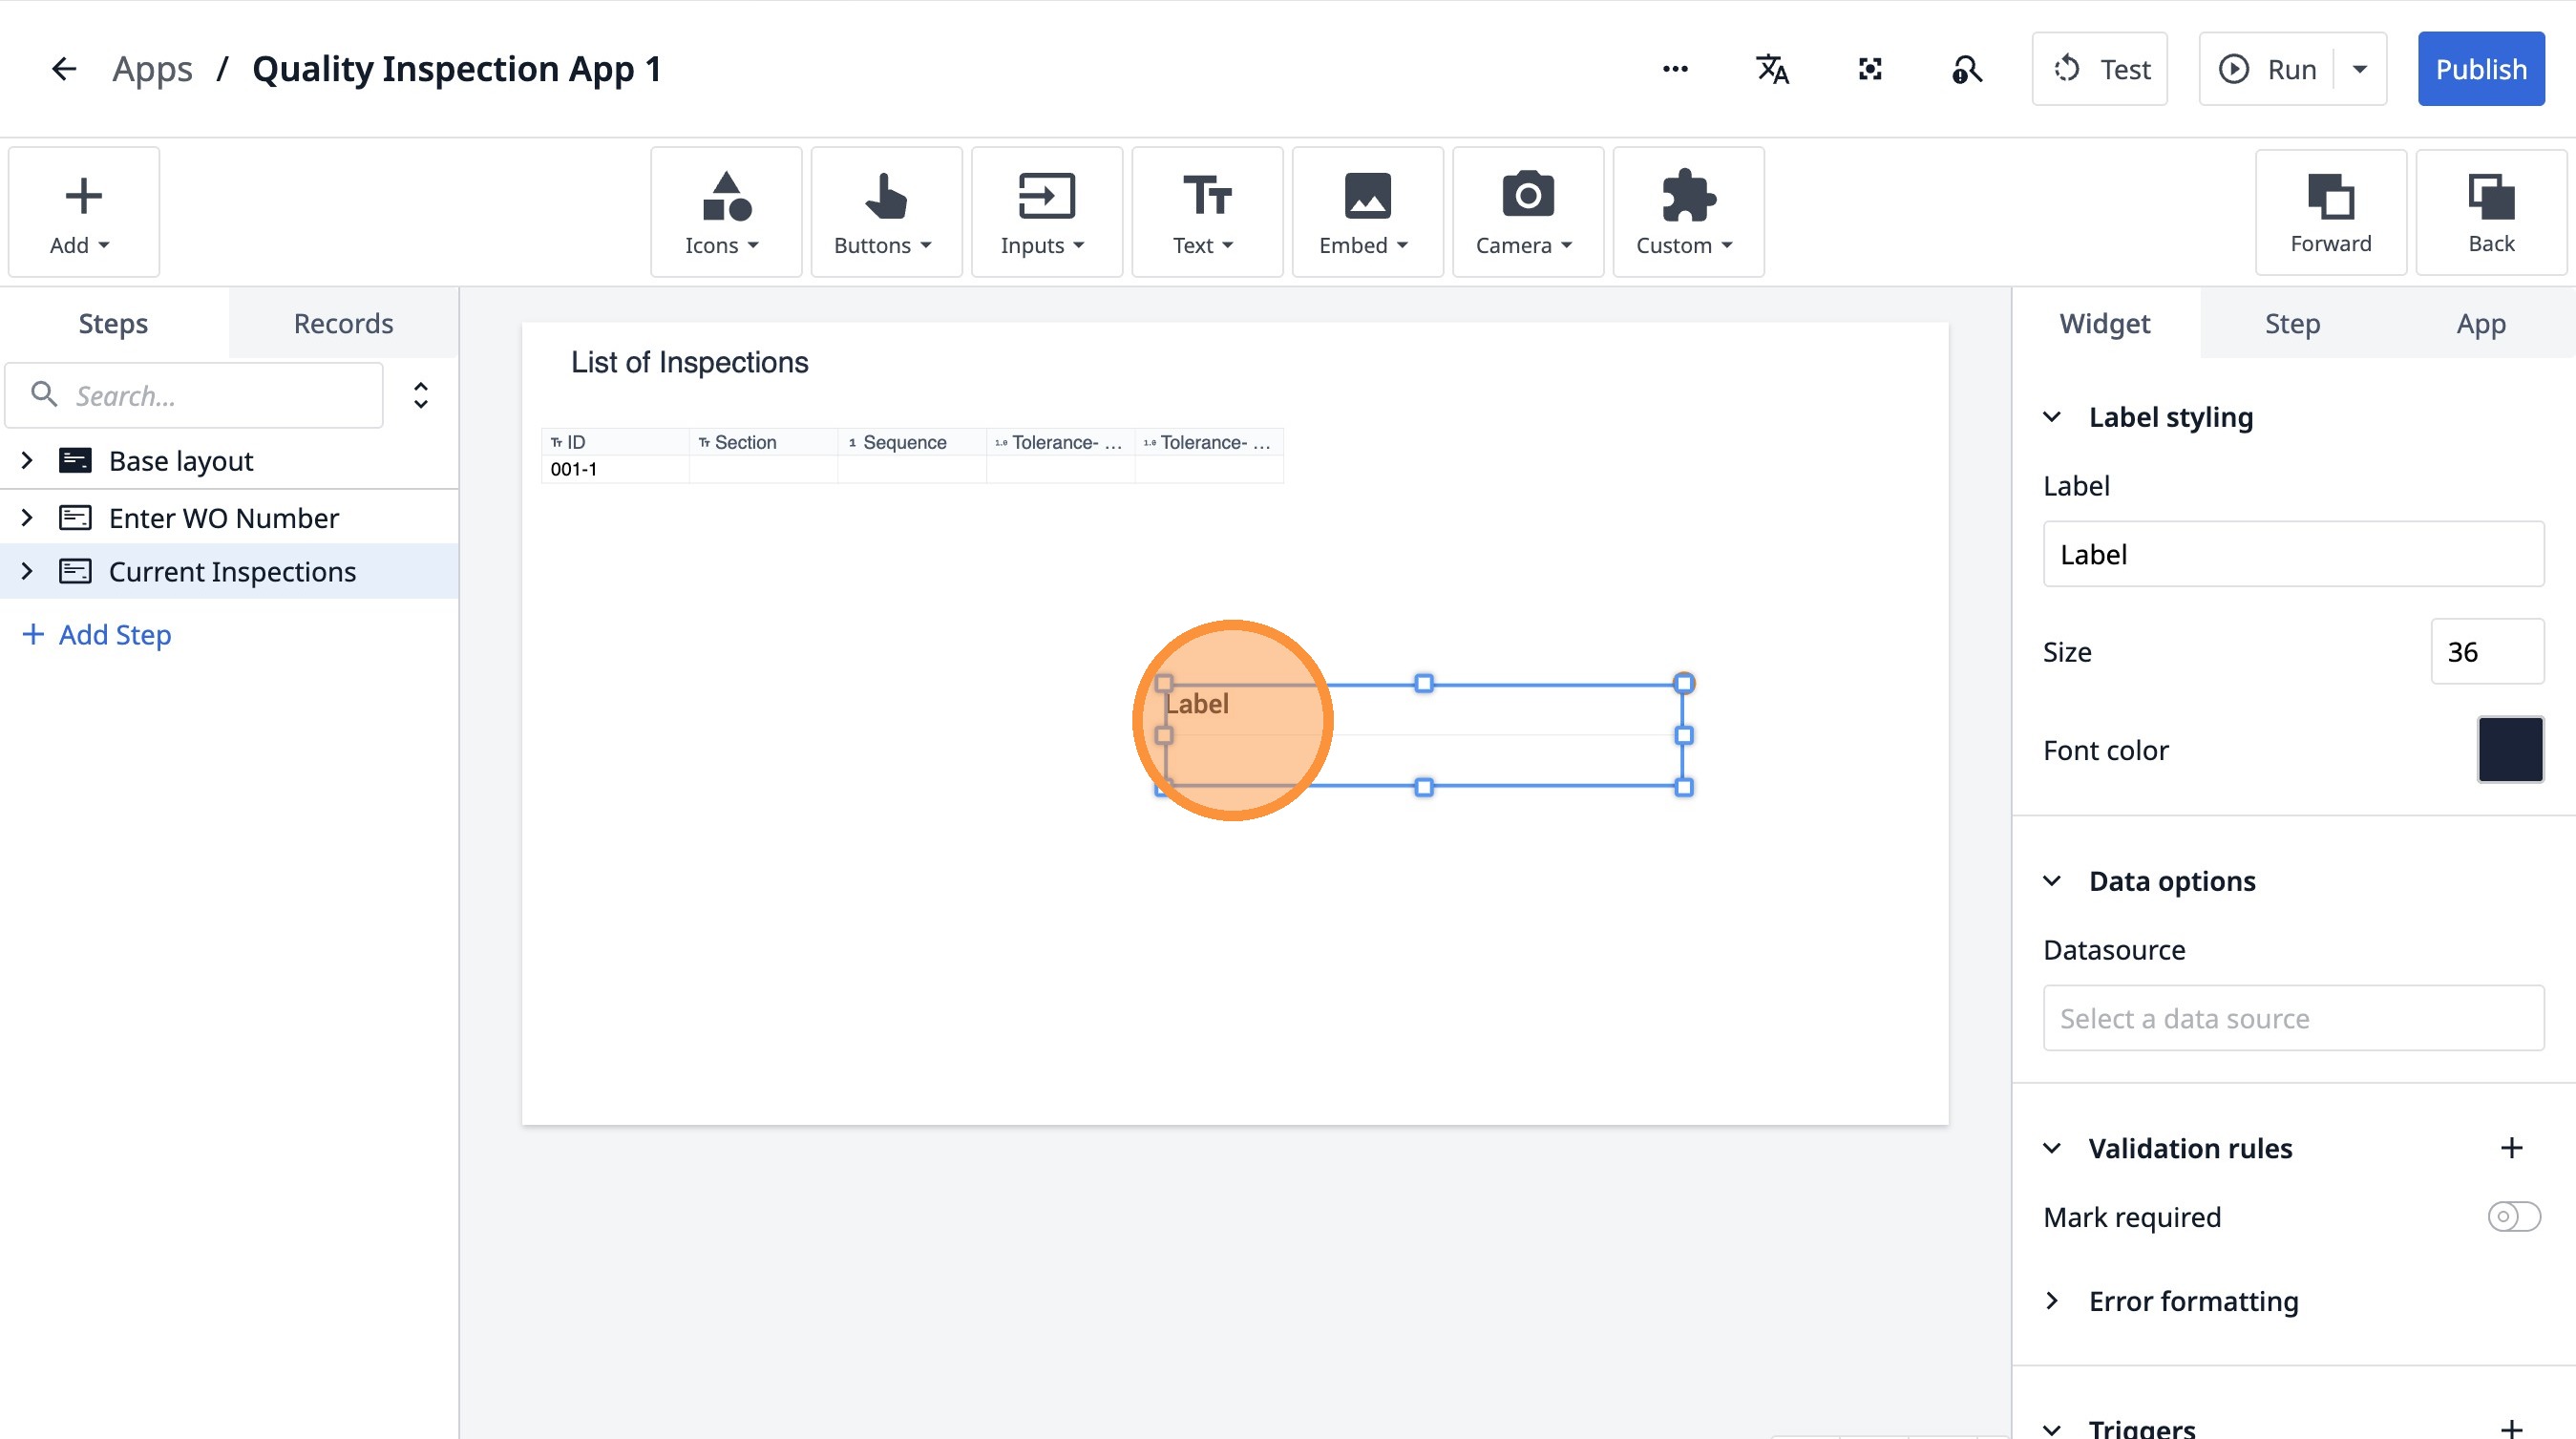
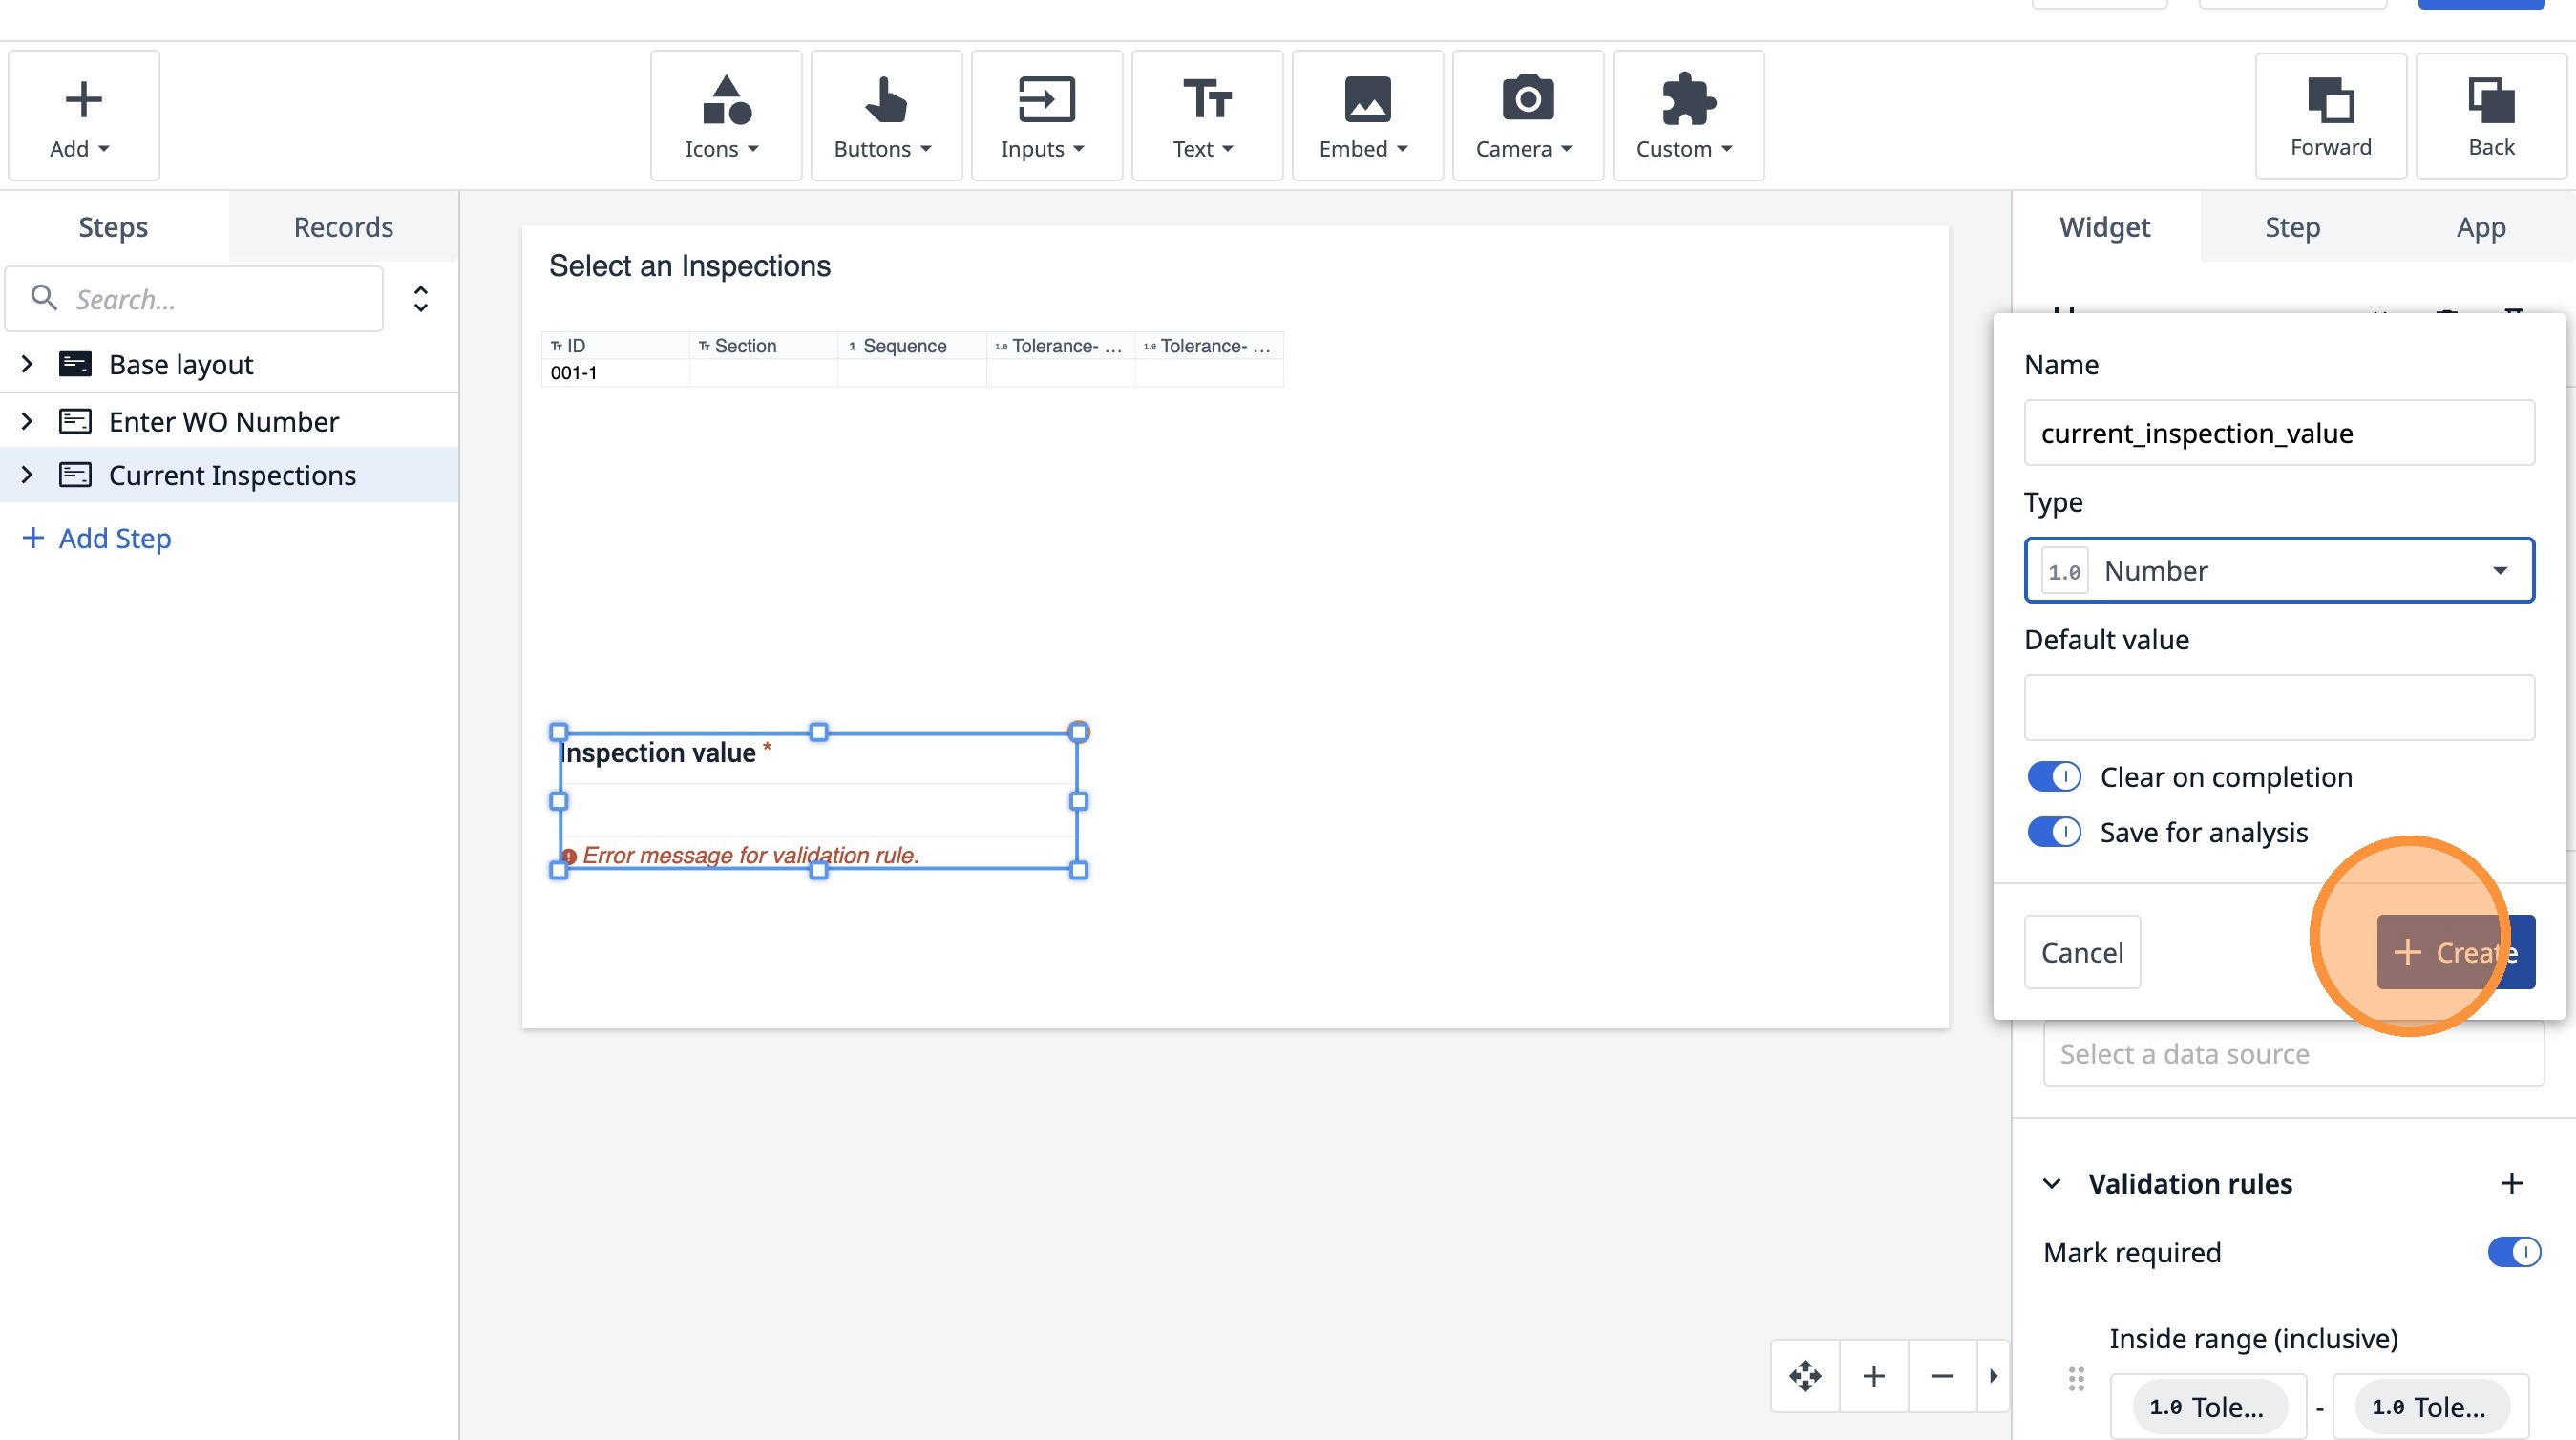
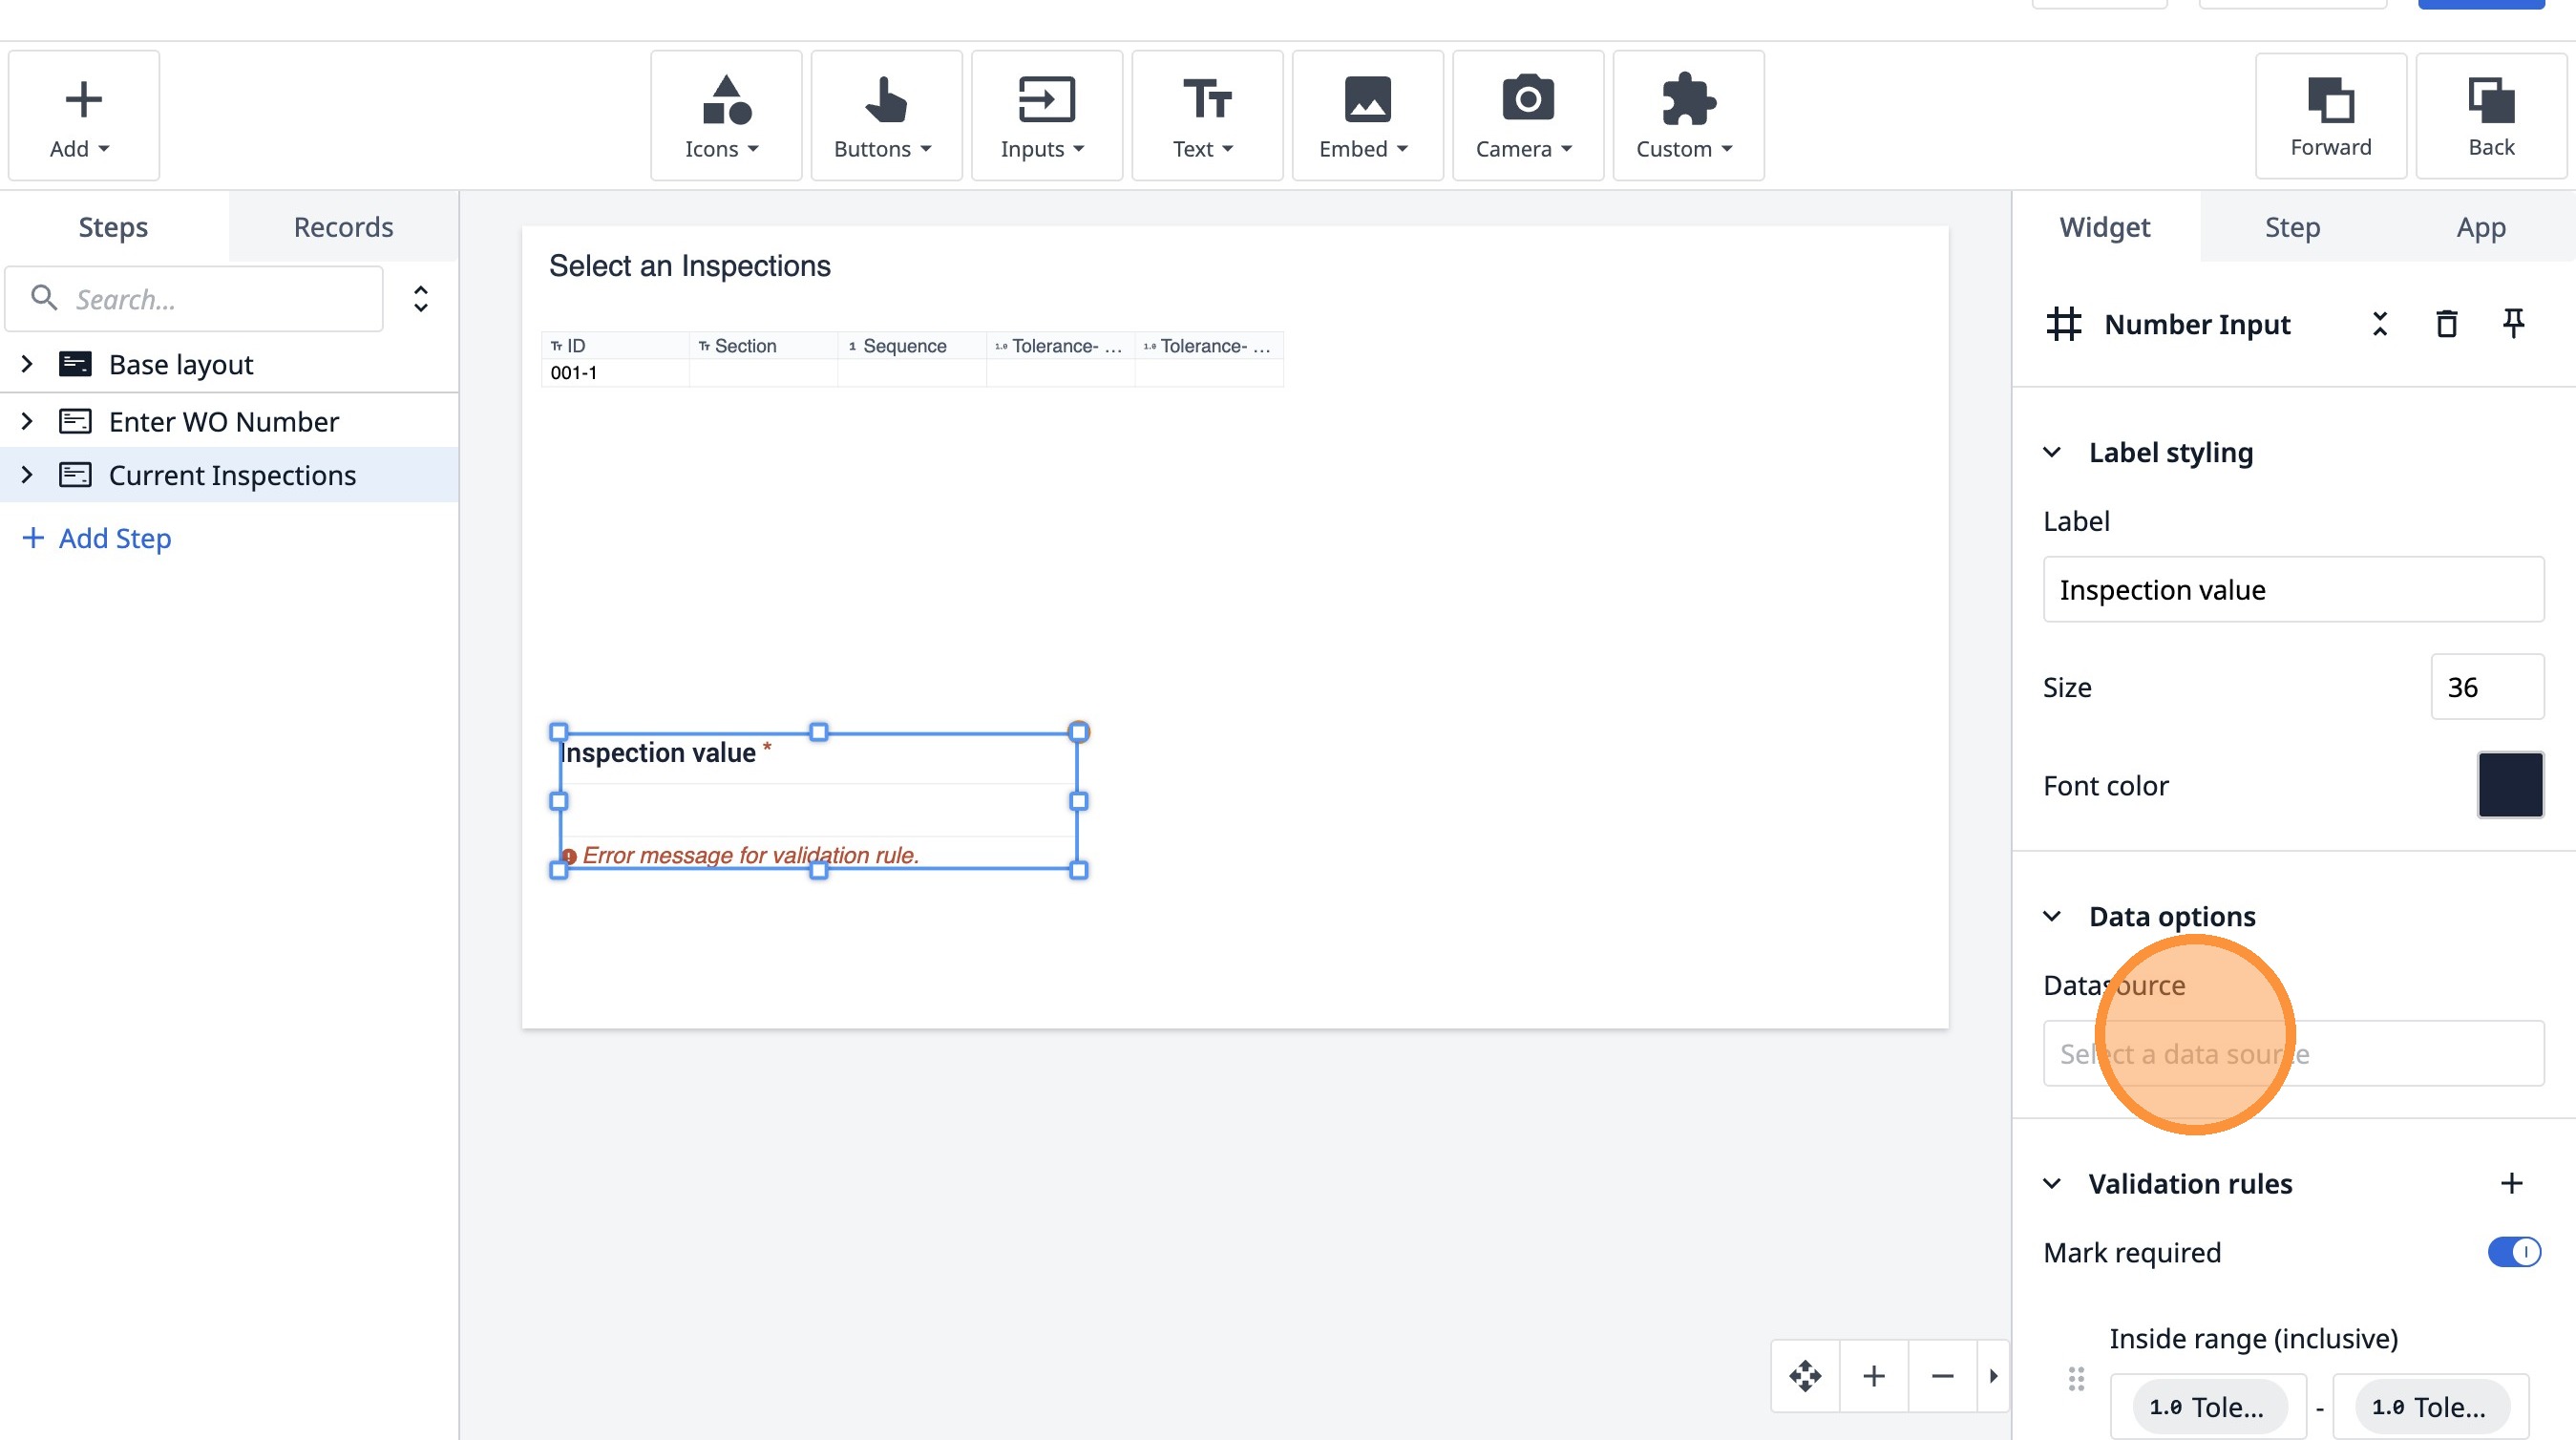
37. Double-click the "Label" field.
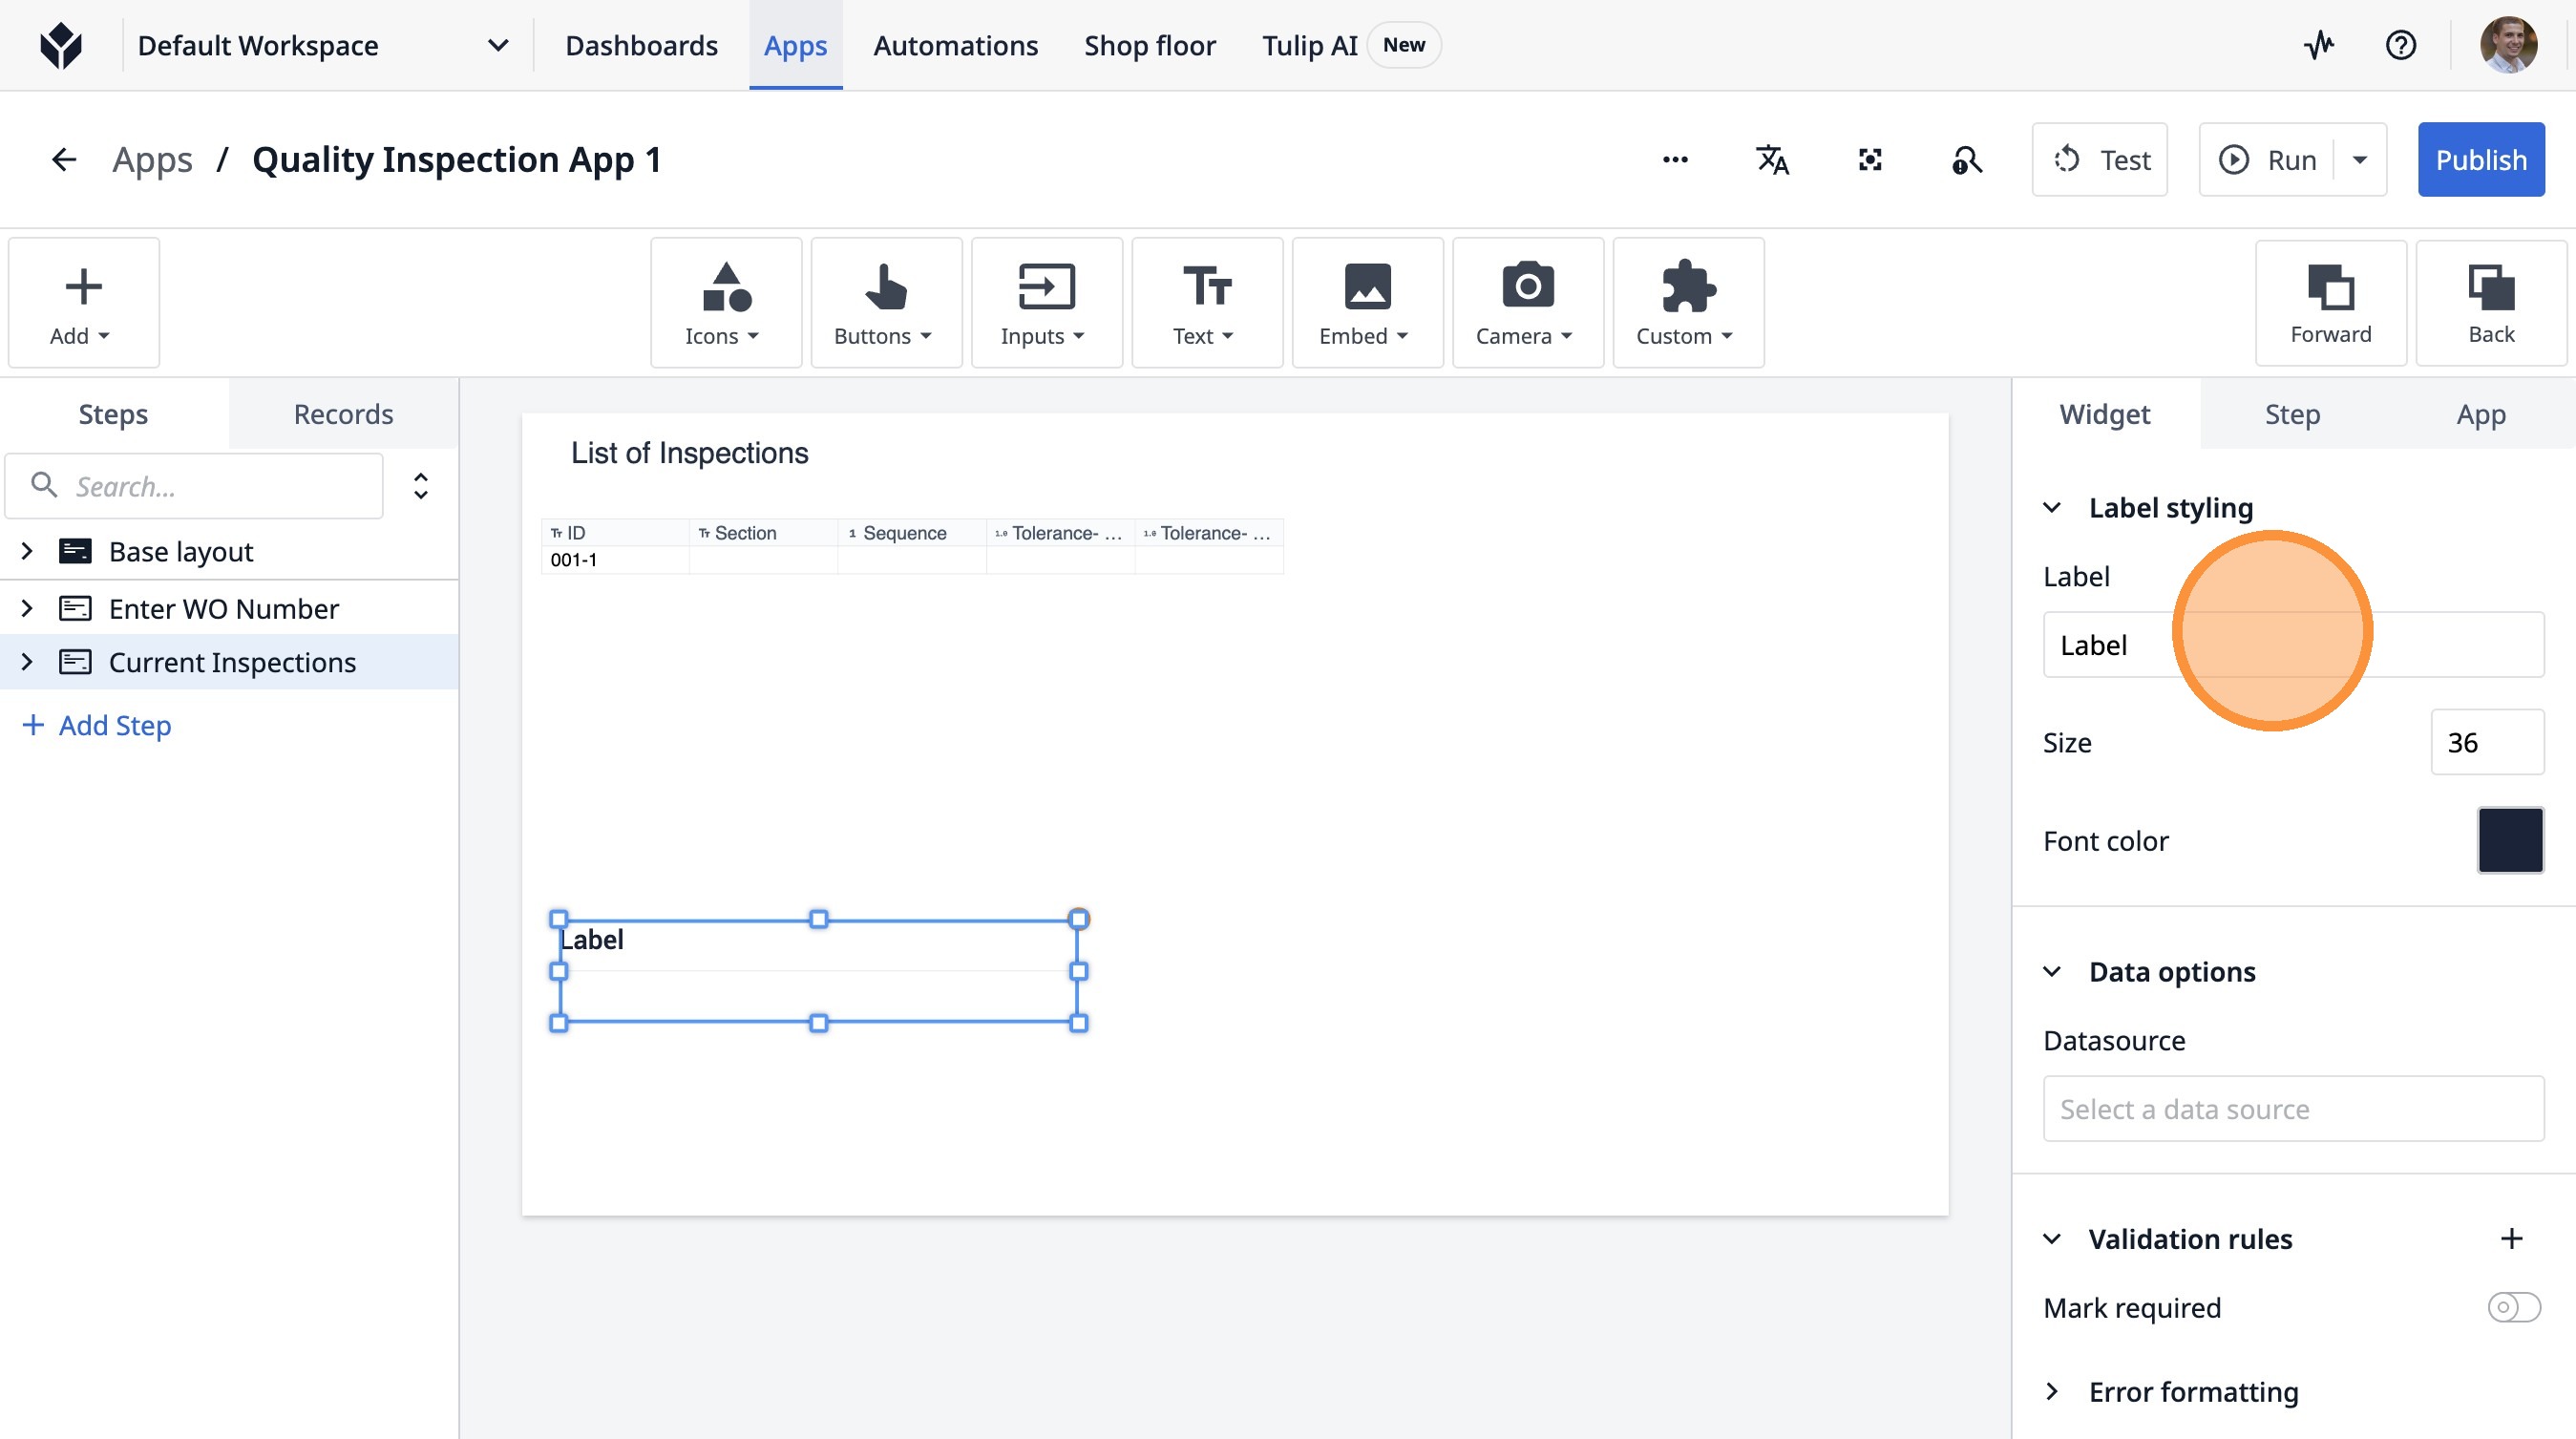
38. Type "Inspection value"
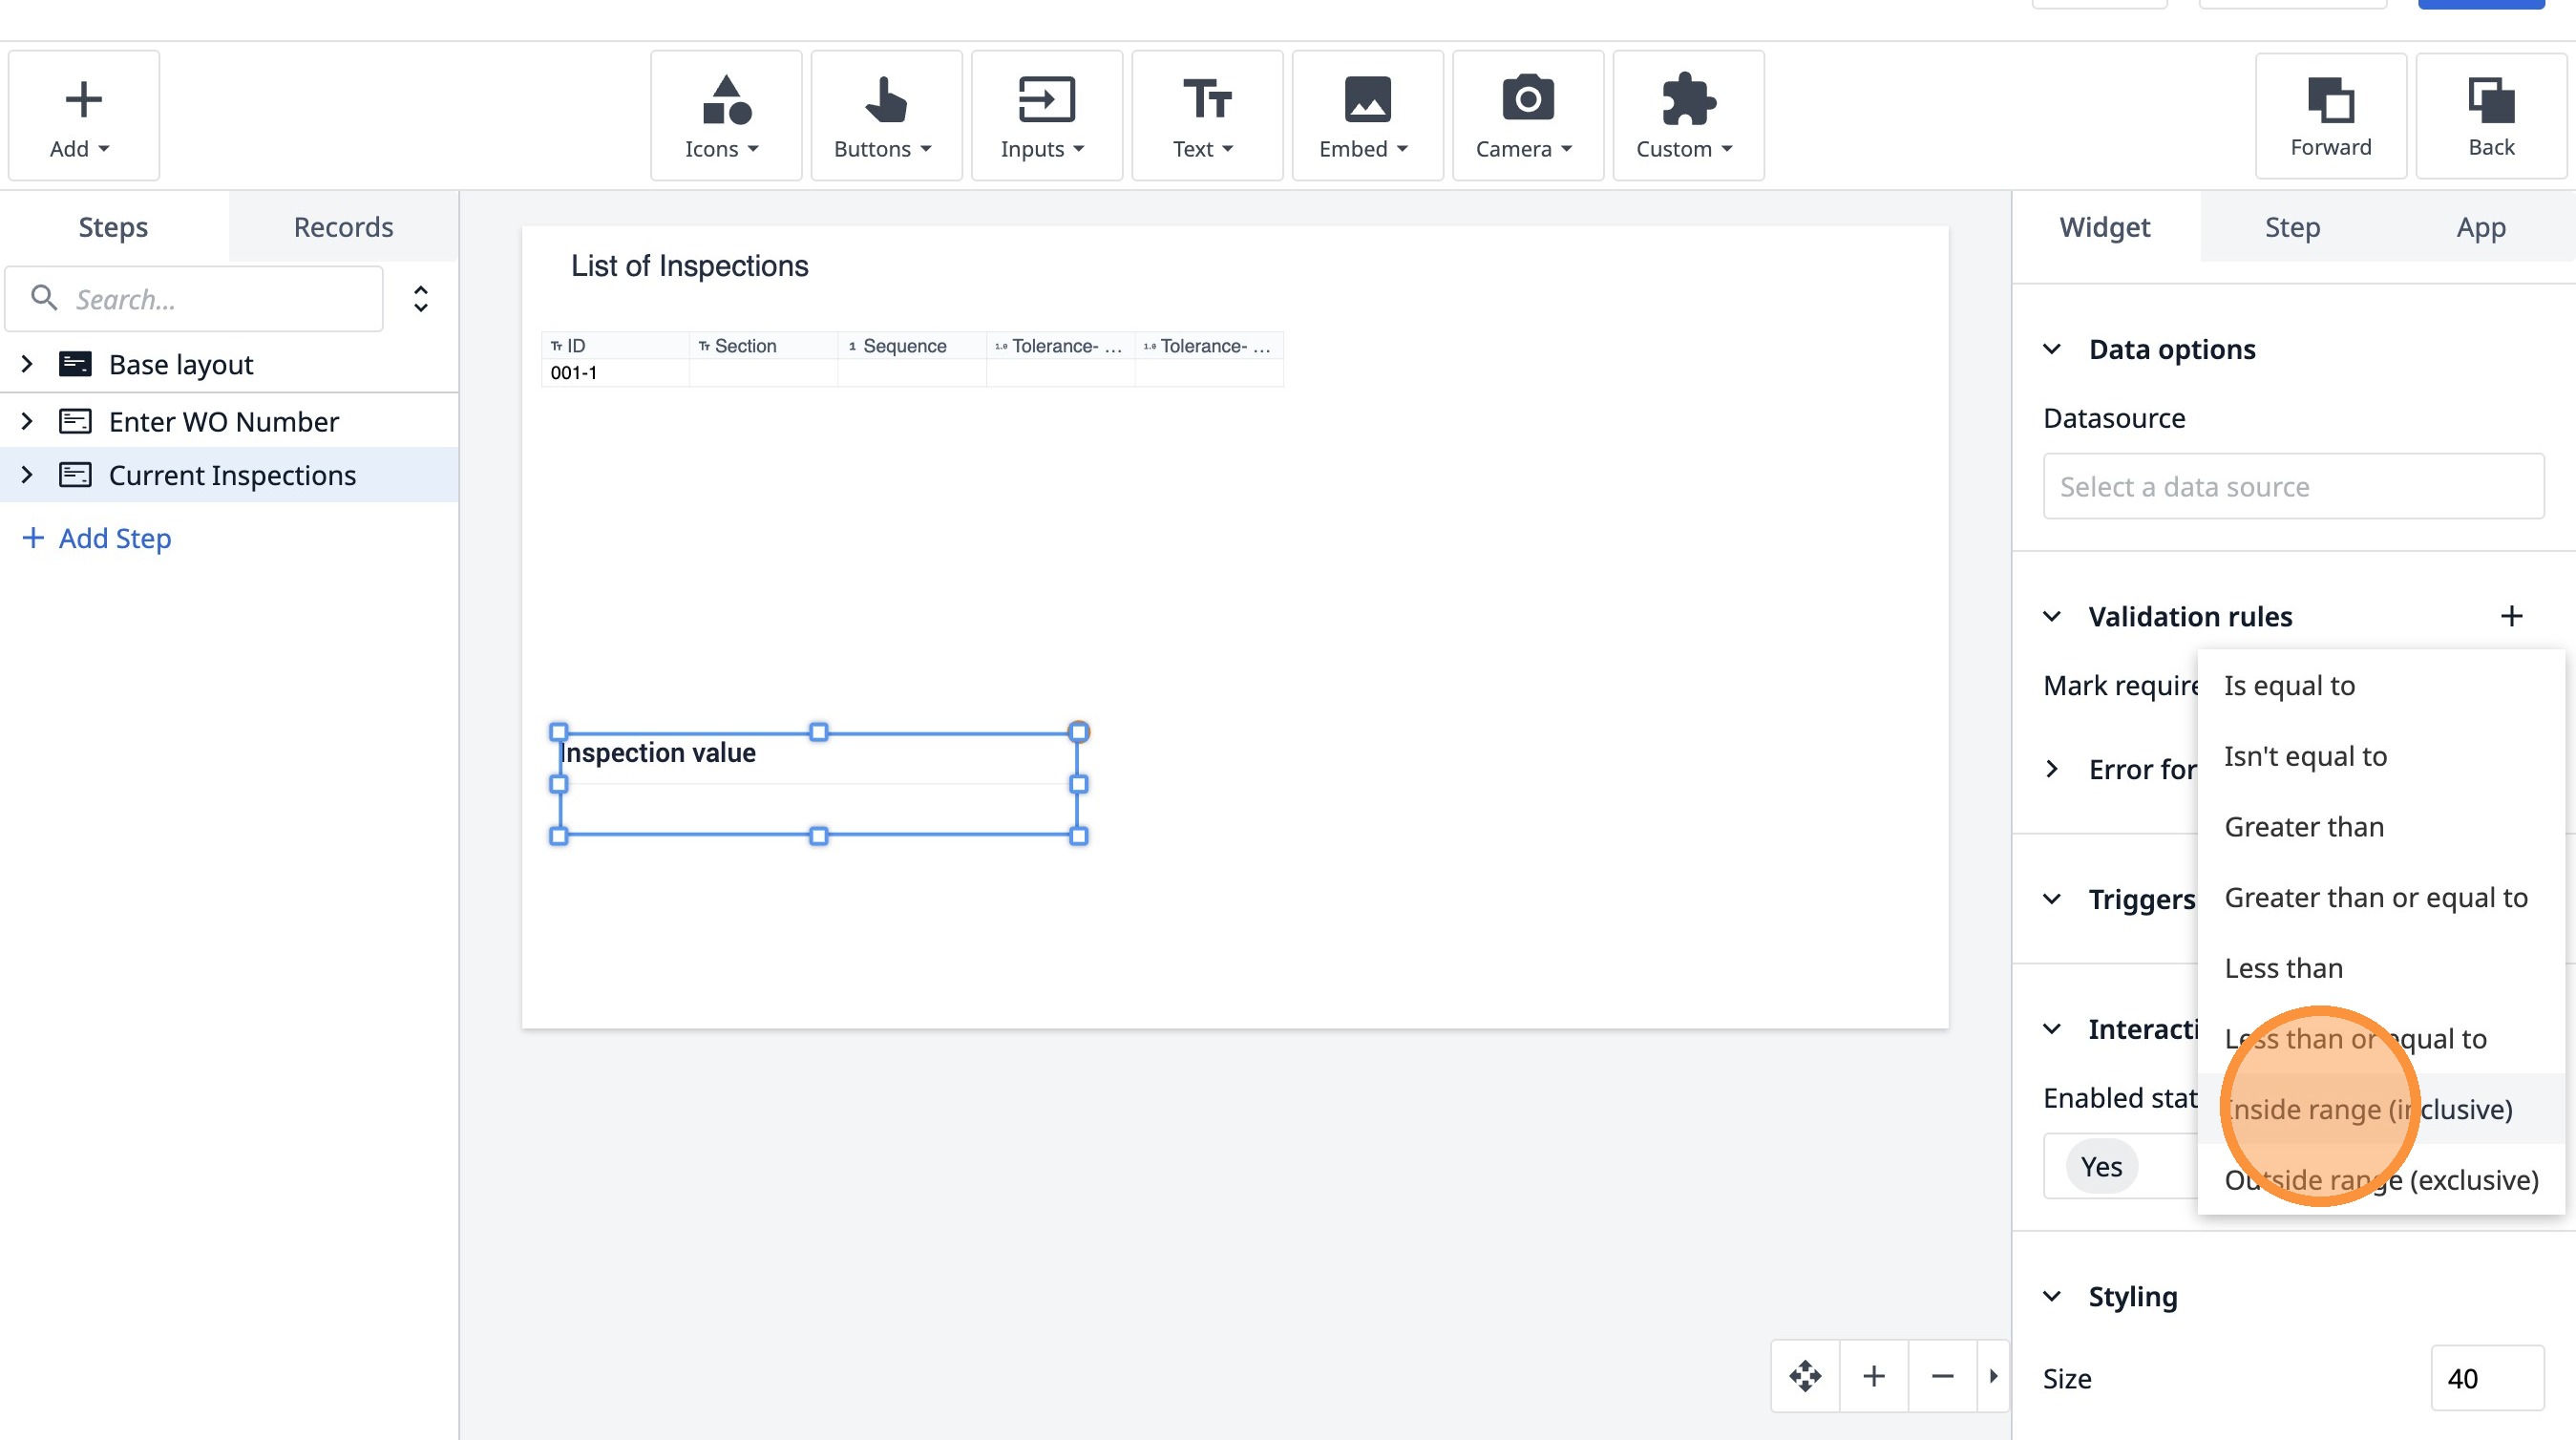
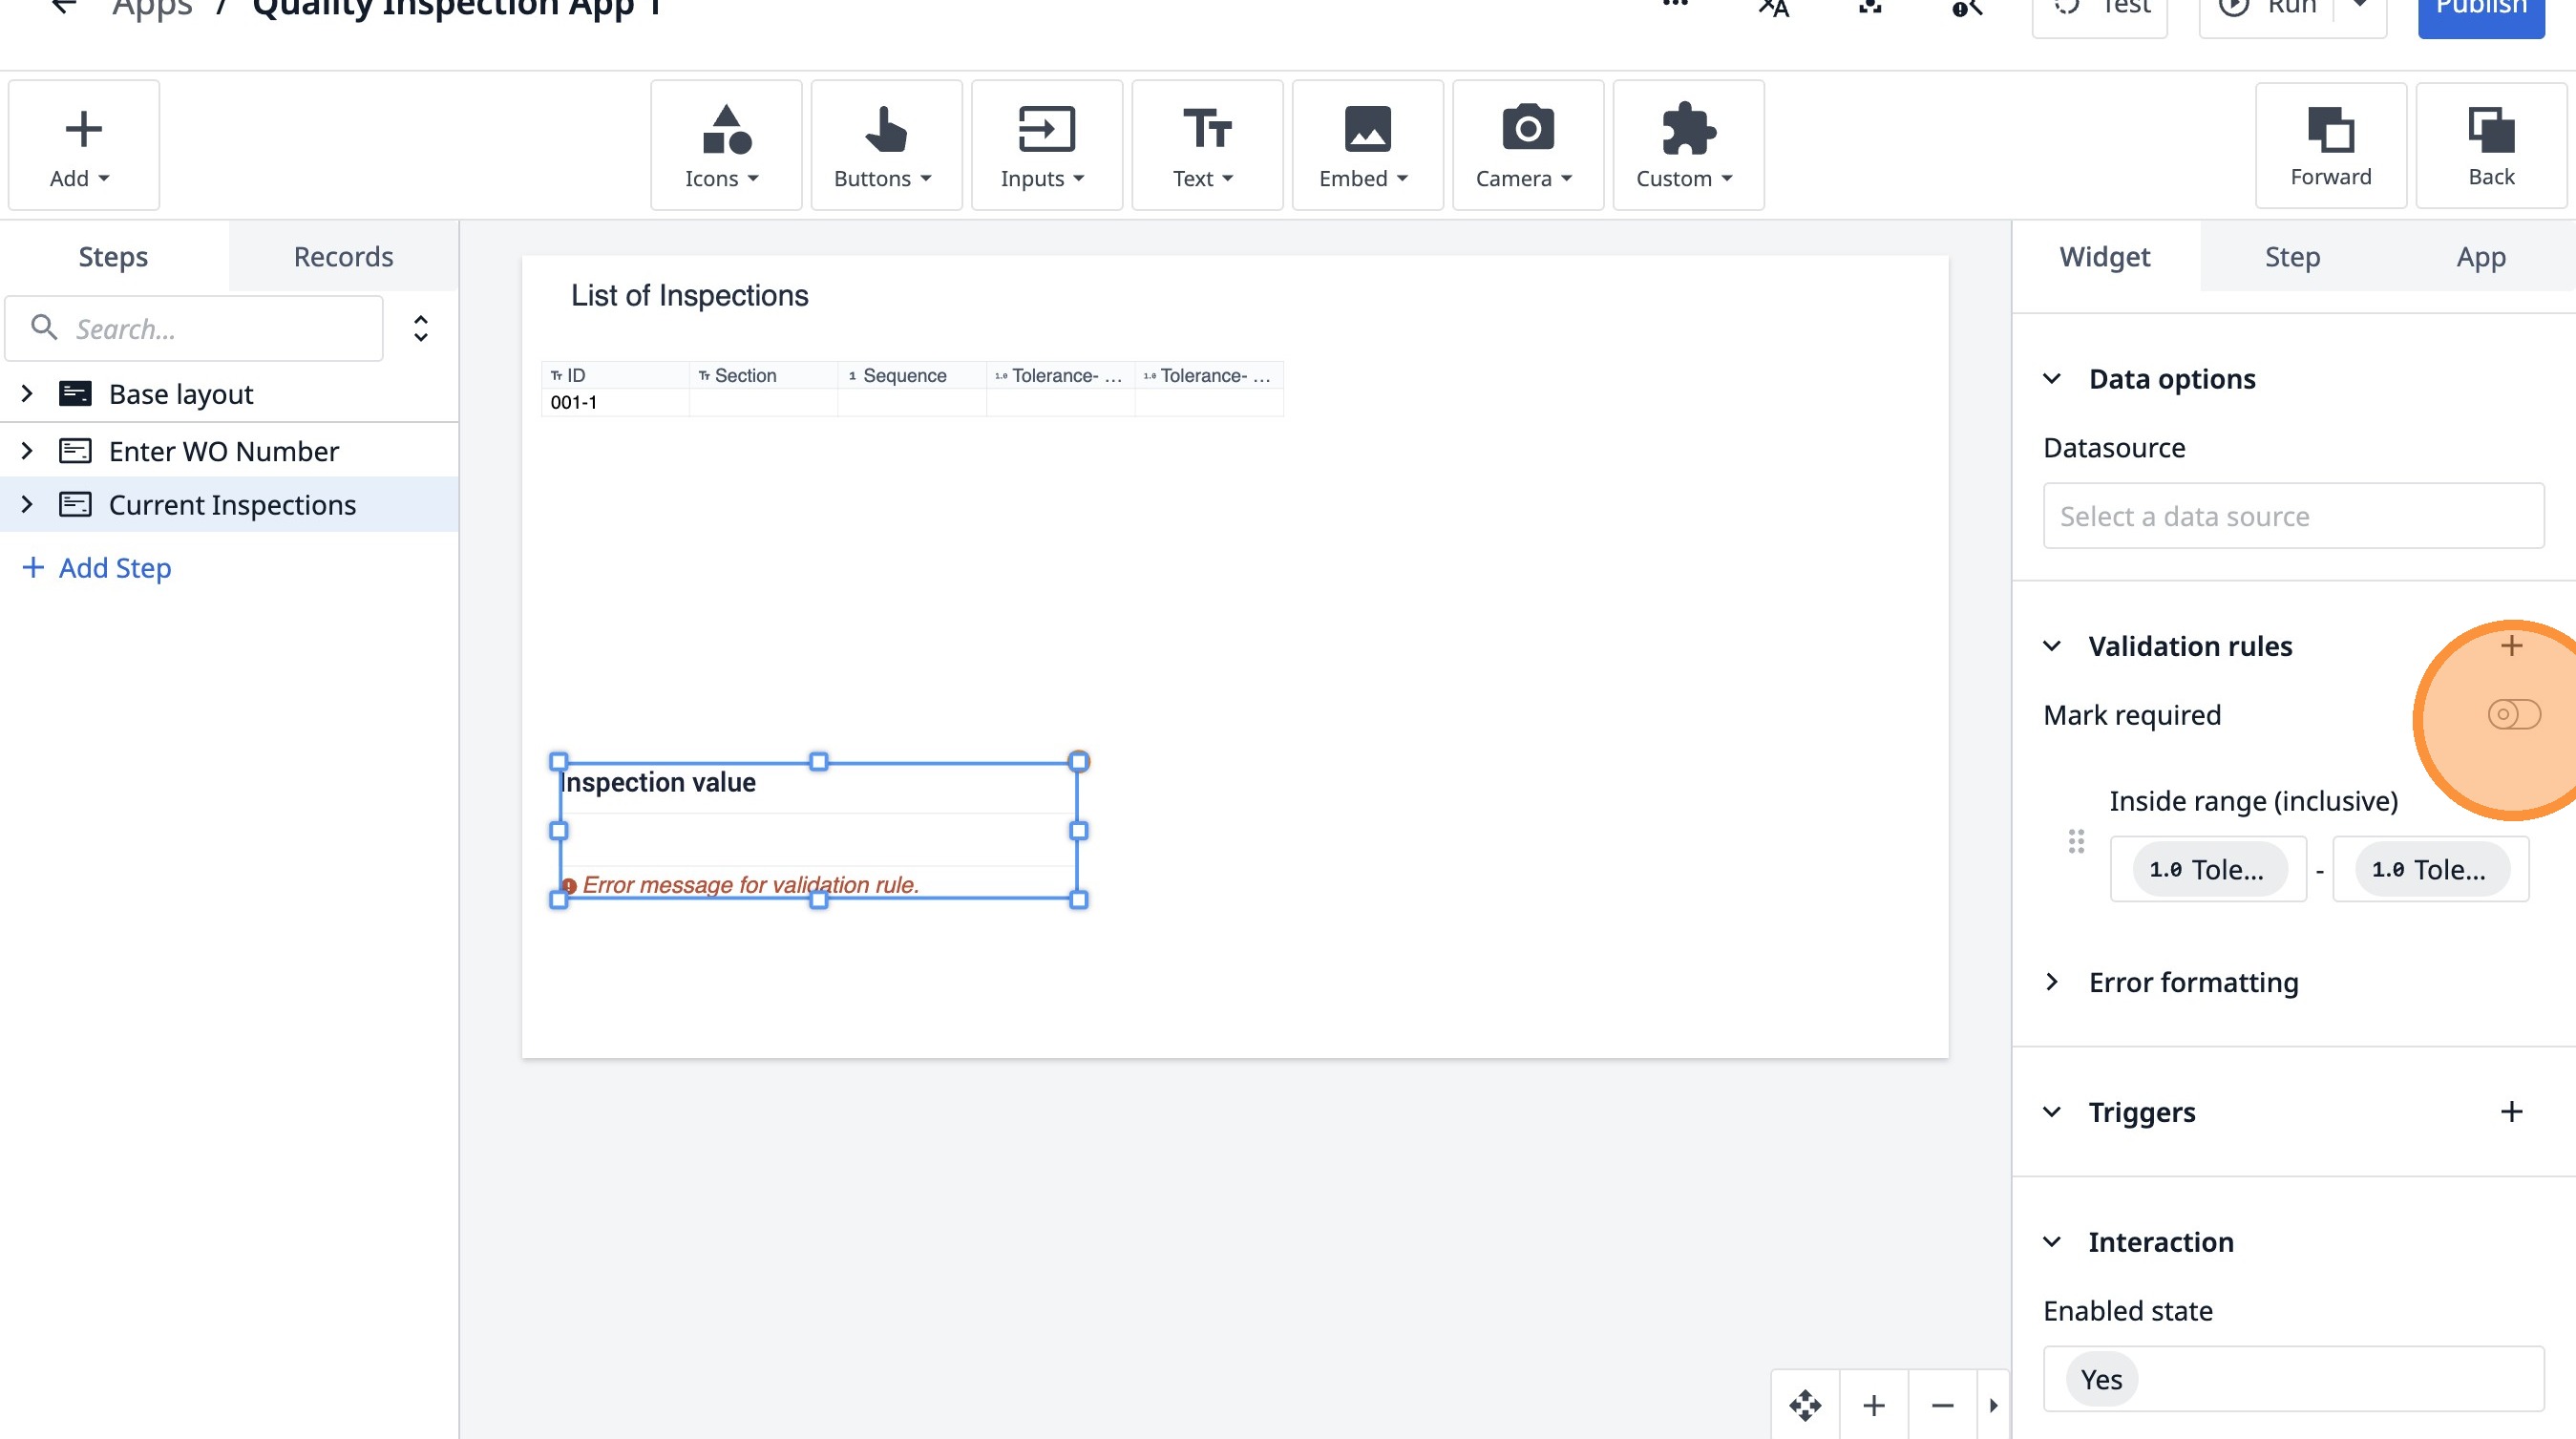
39. Click this button.
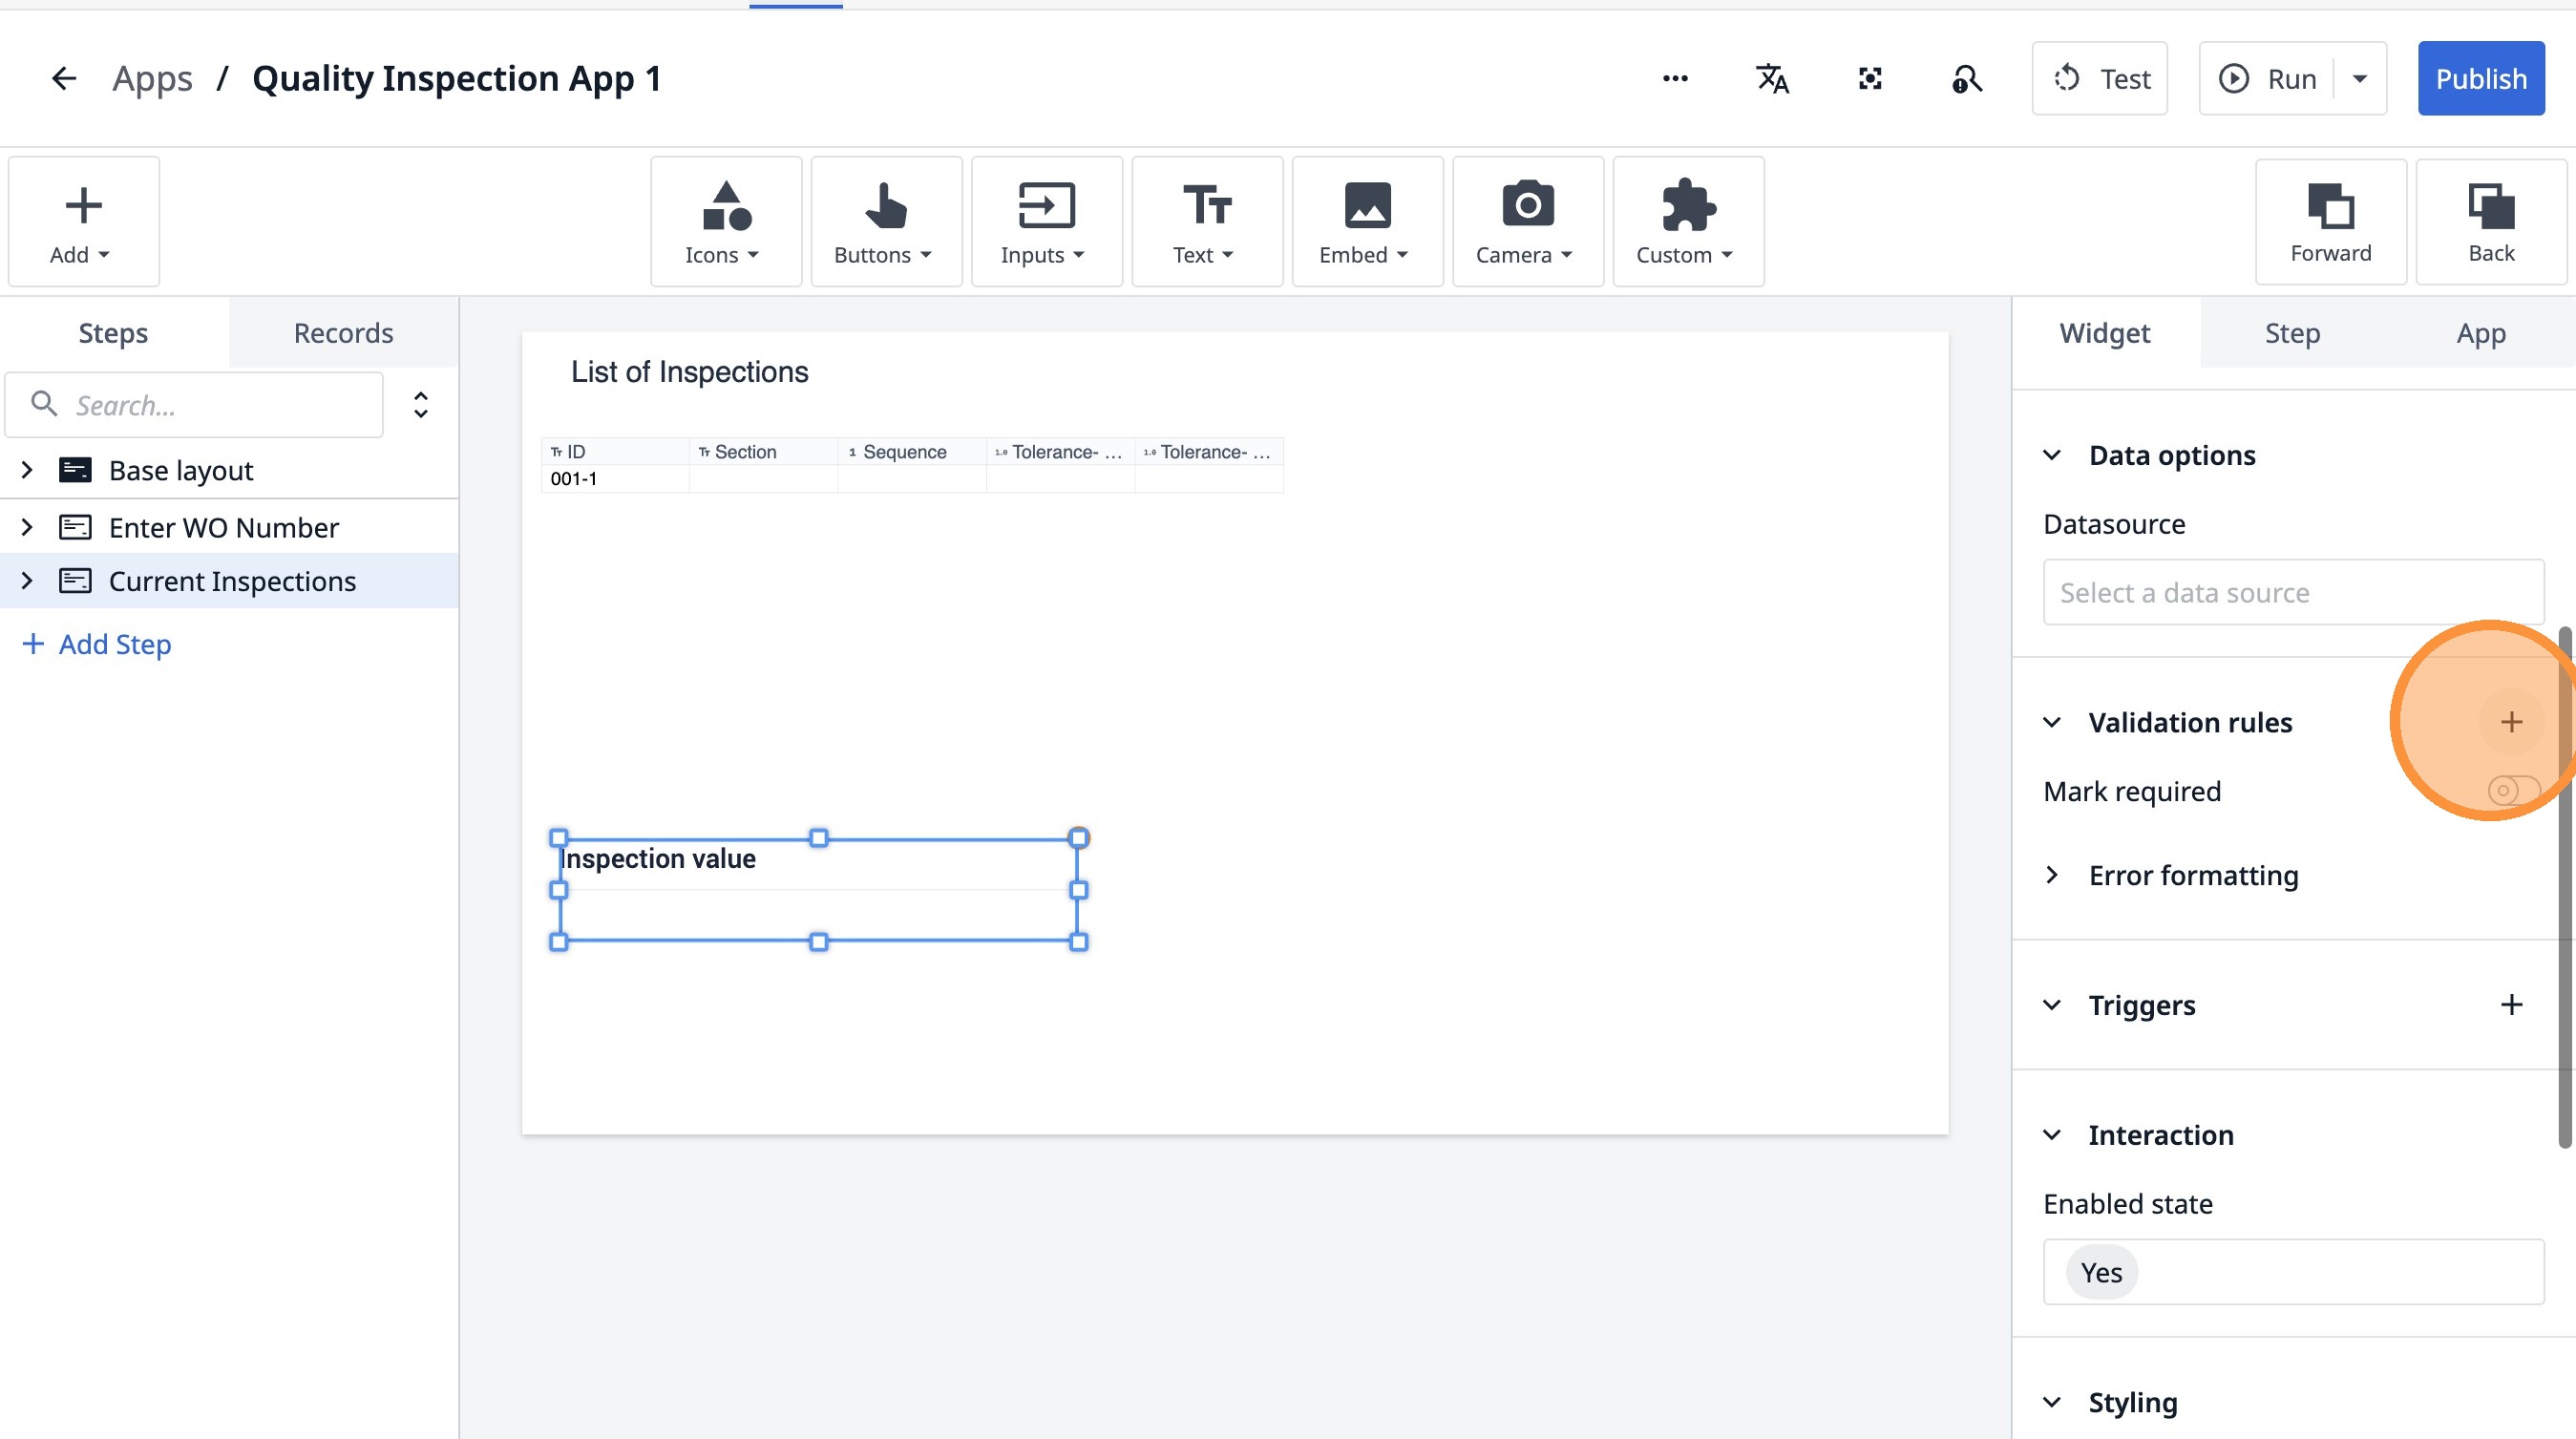
40. Click "Inside range (inclusive)"
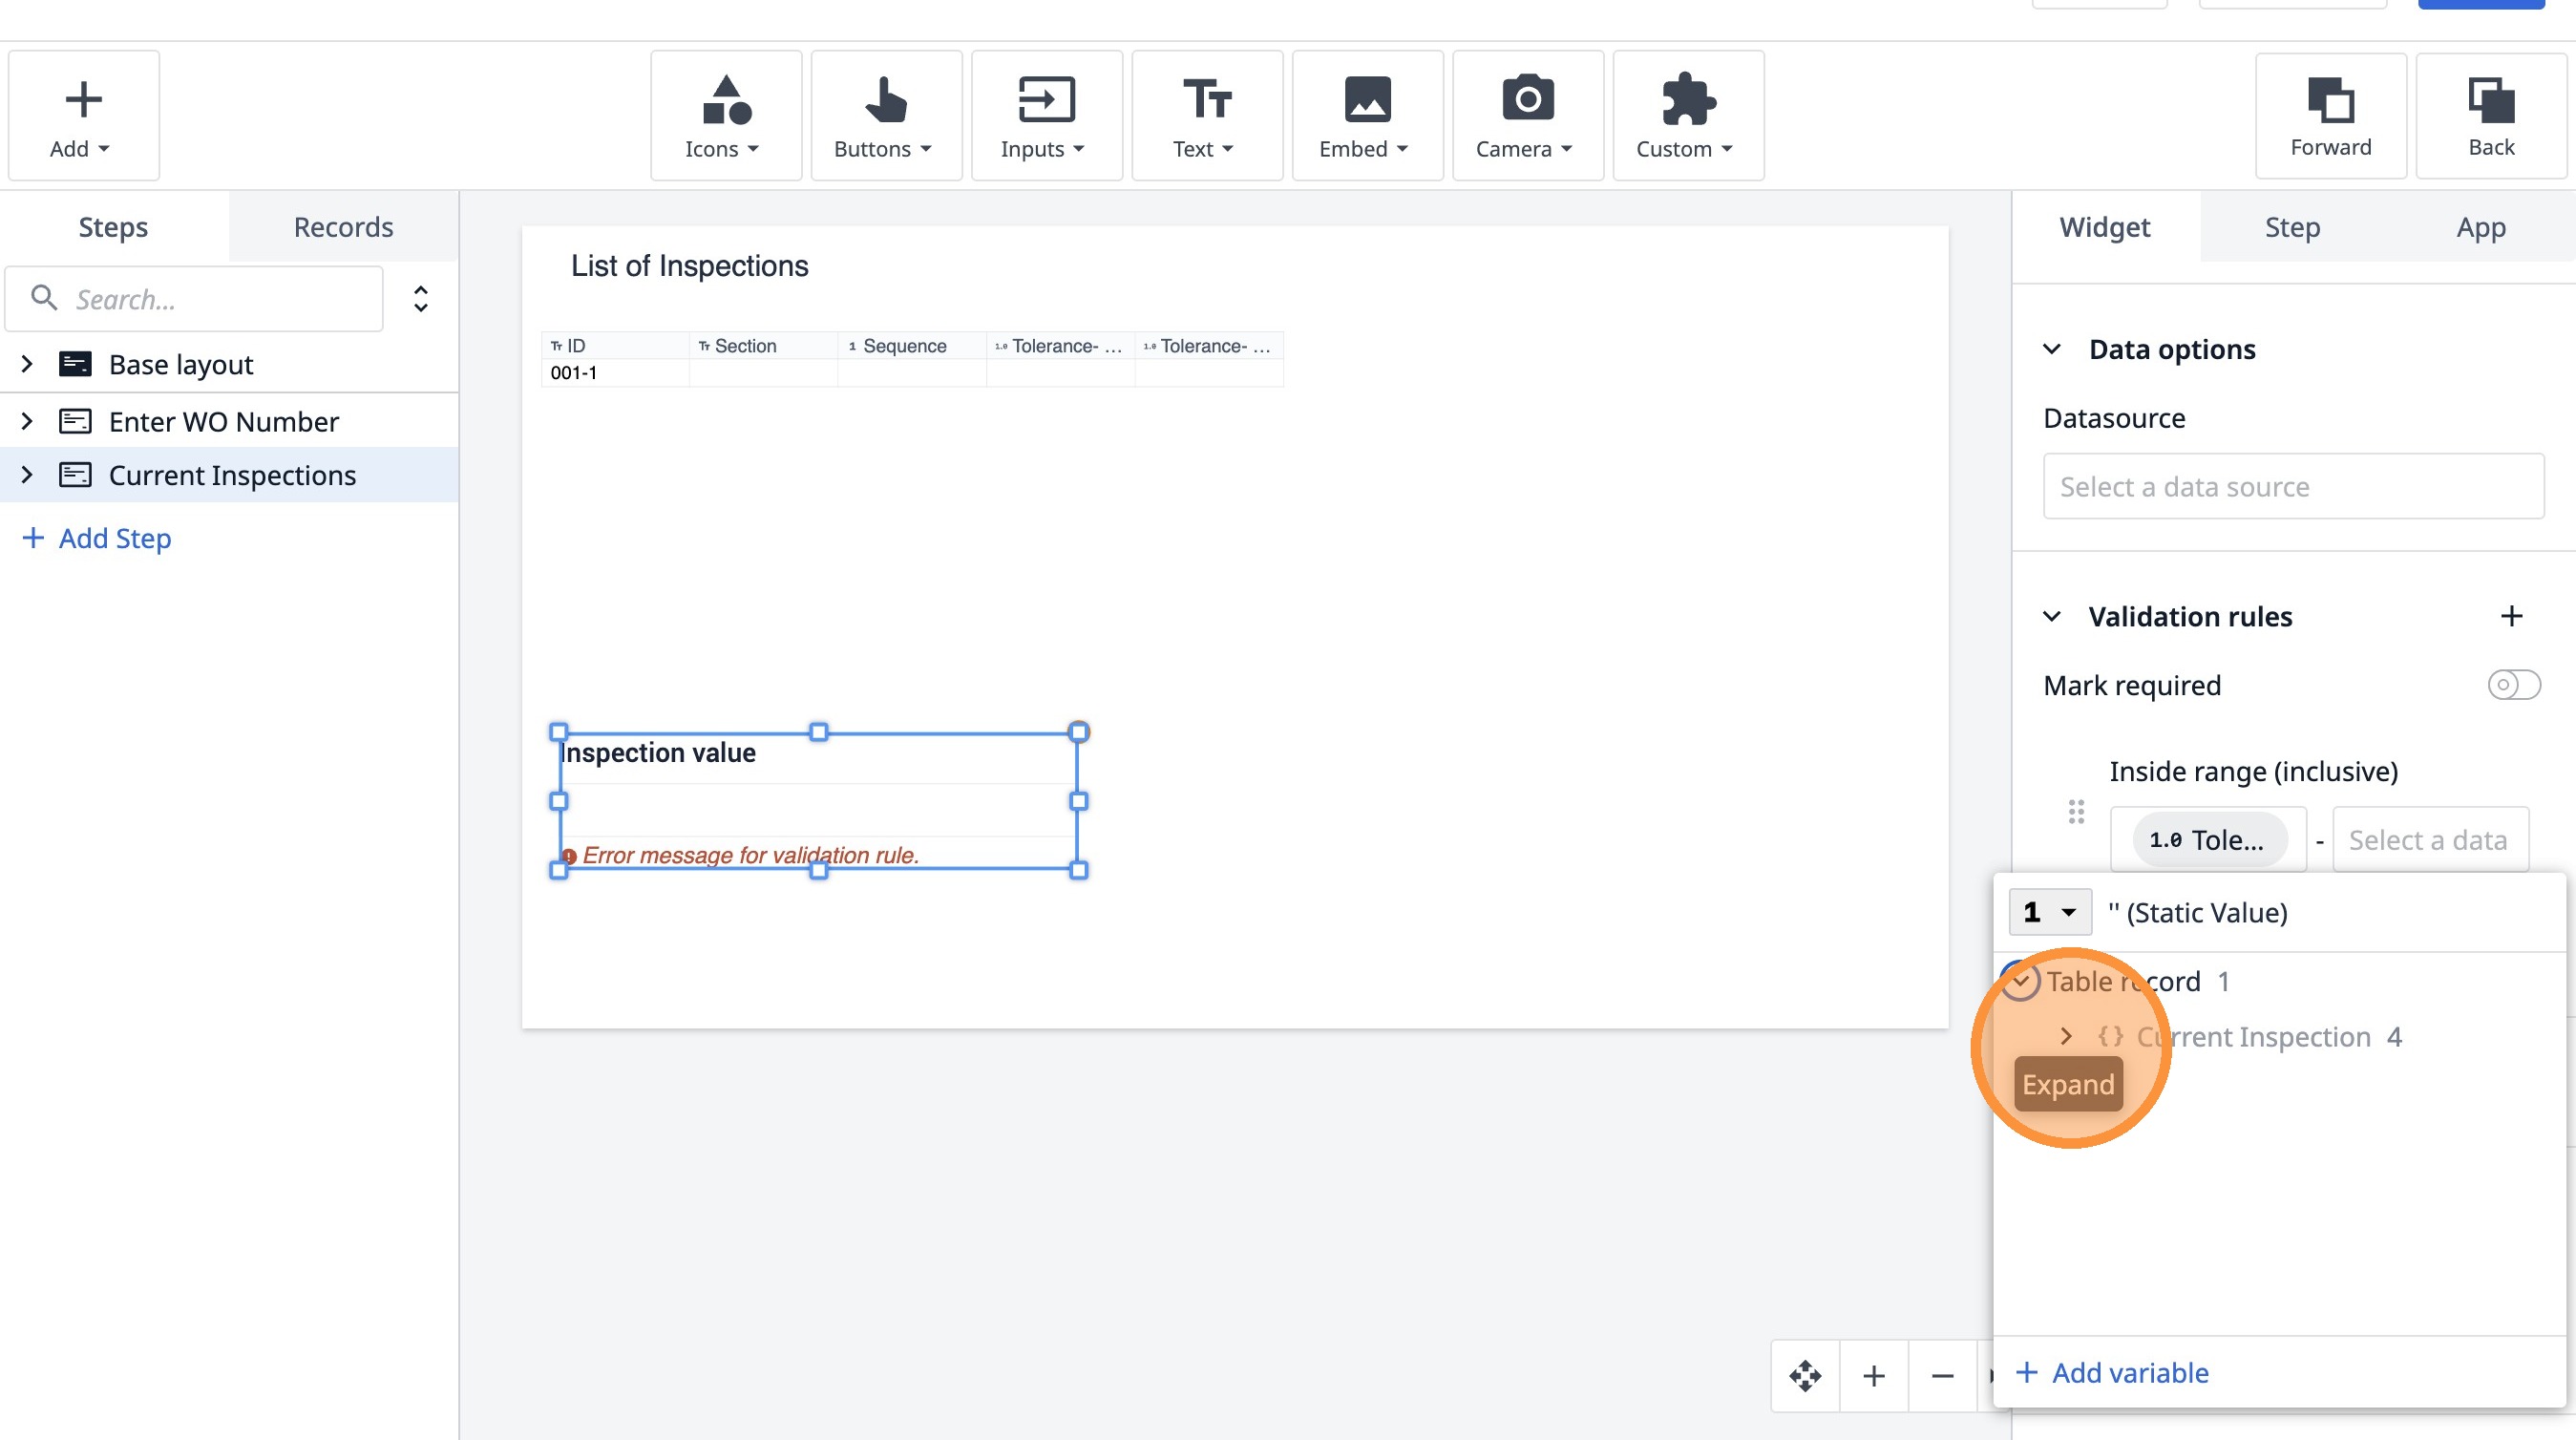
41. Click "Select a data source"
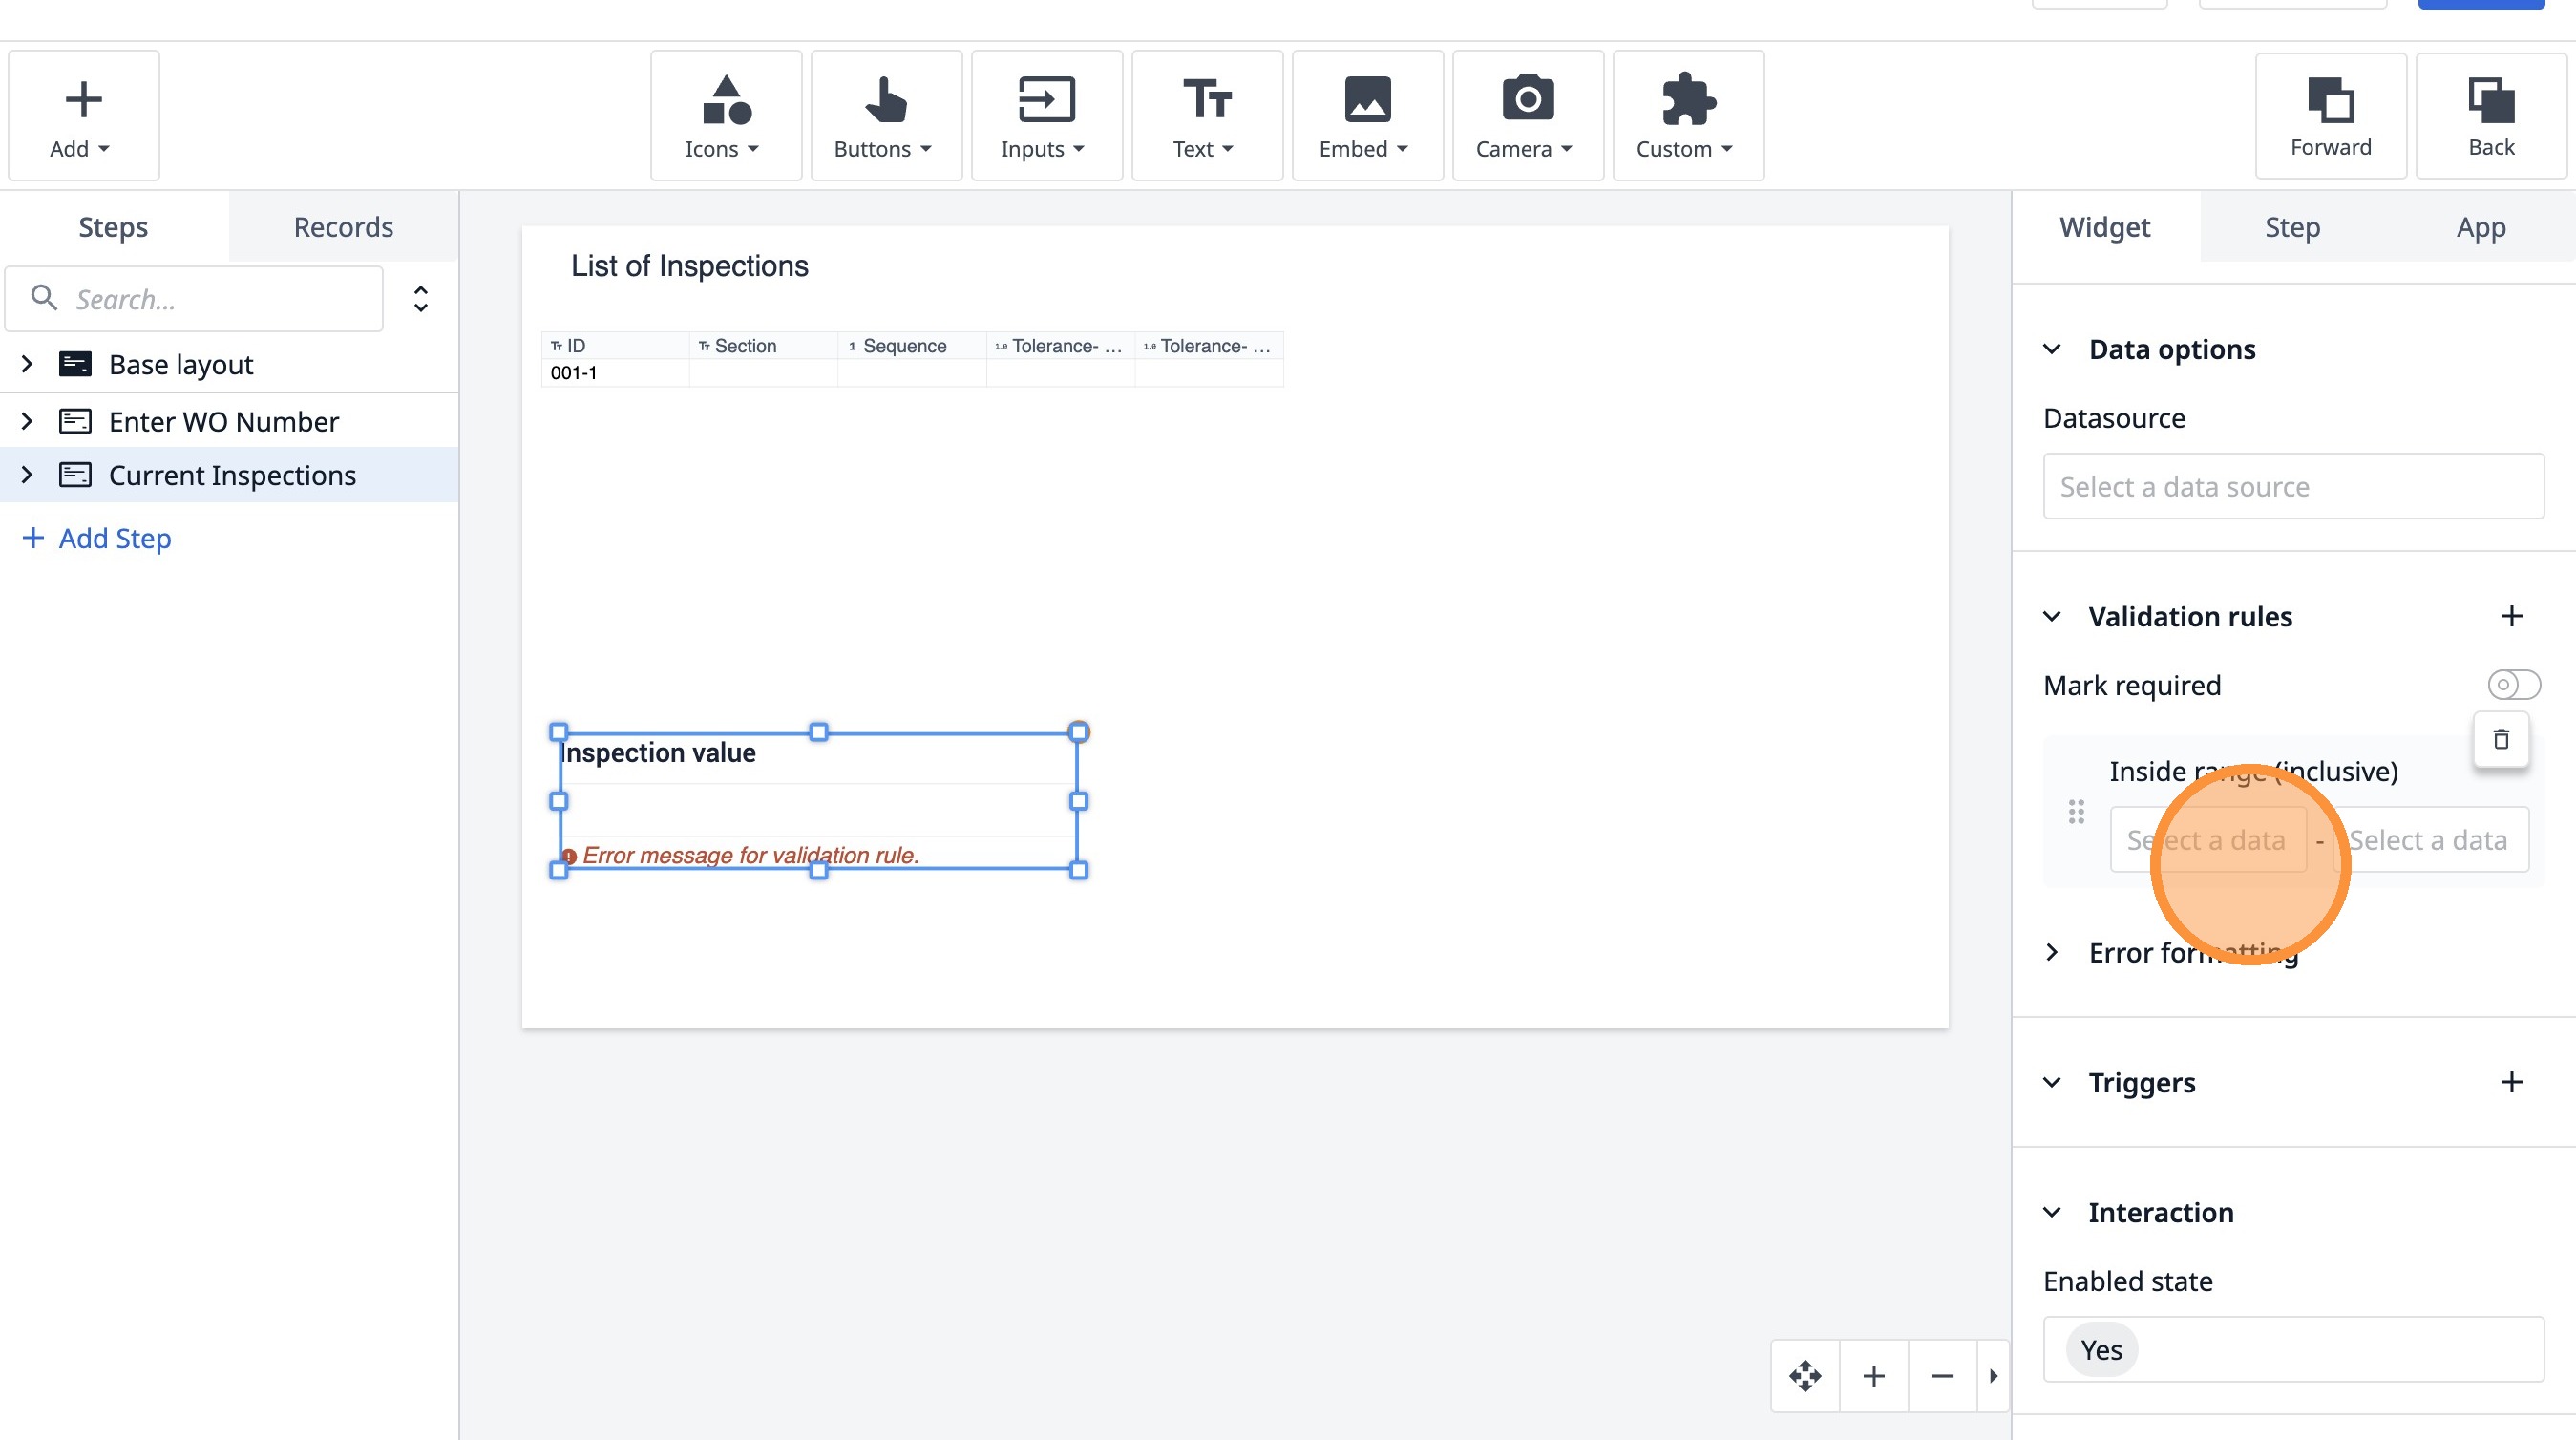
42. Click "Select a data source"
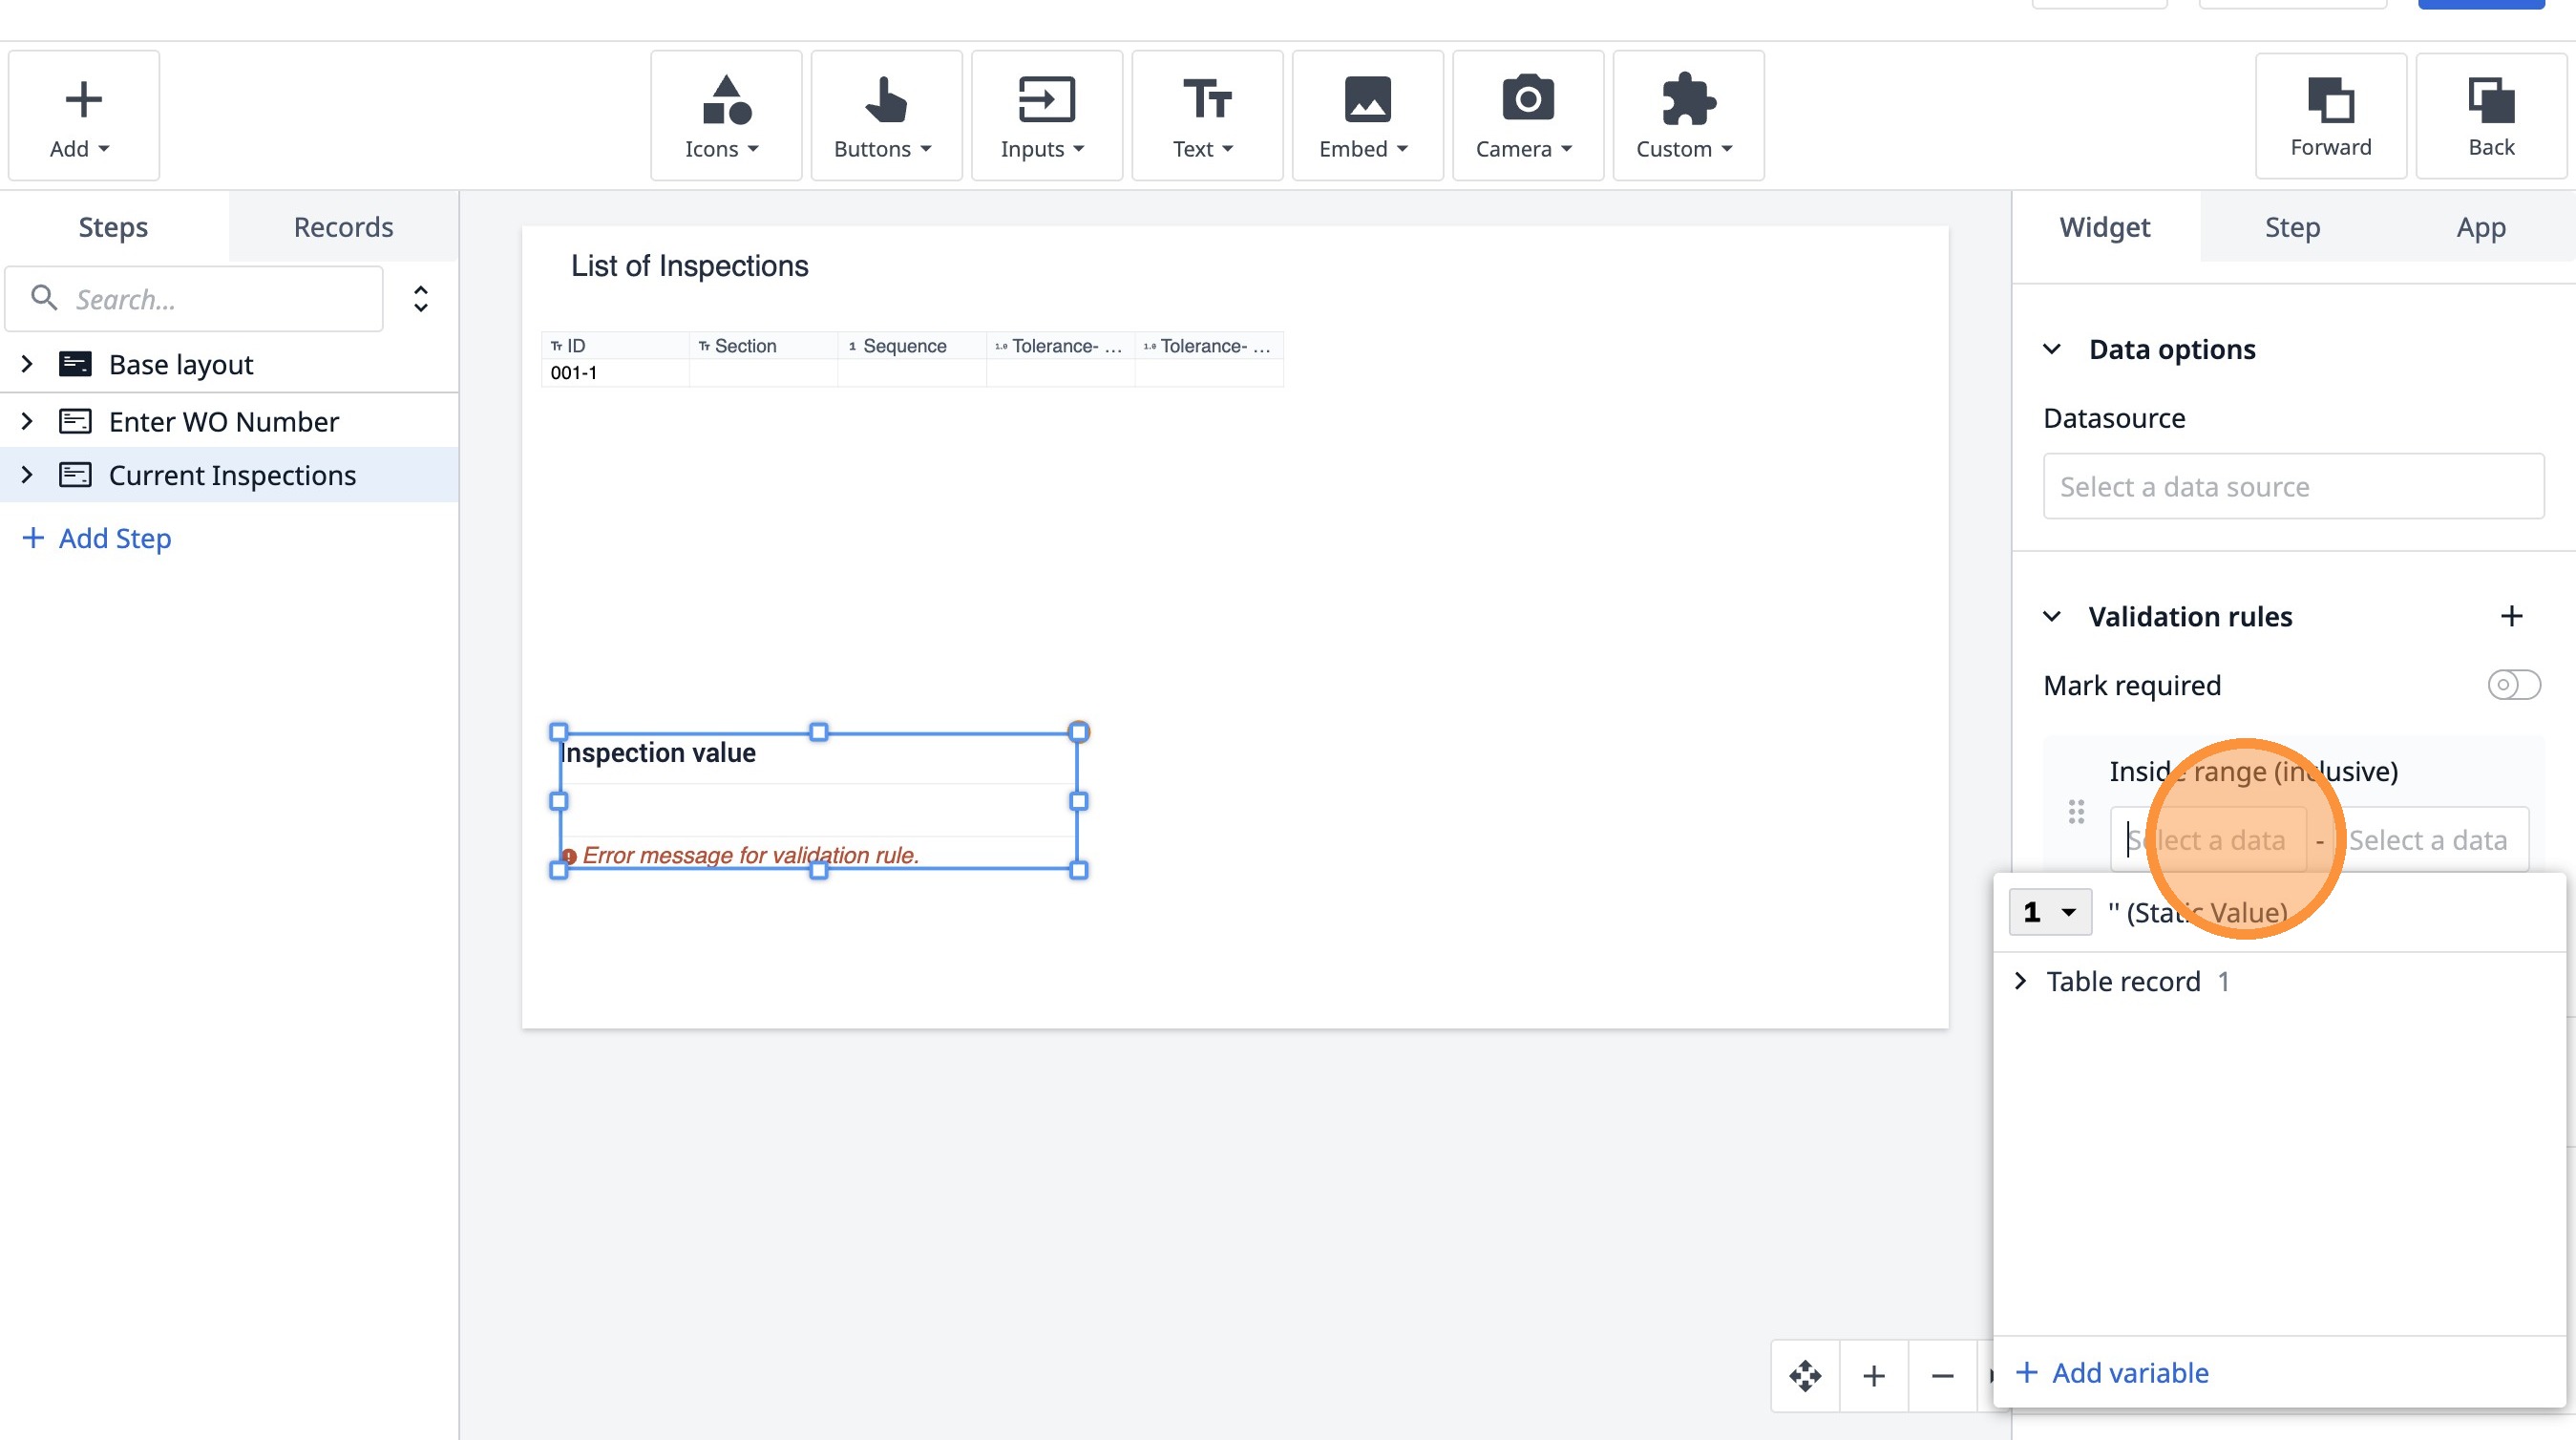
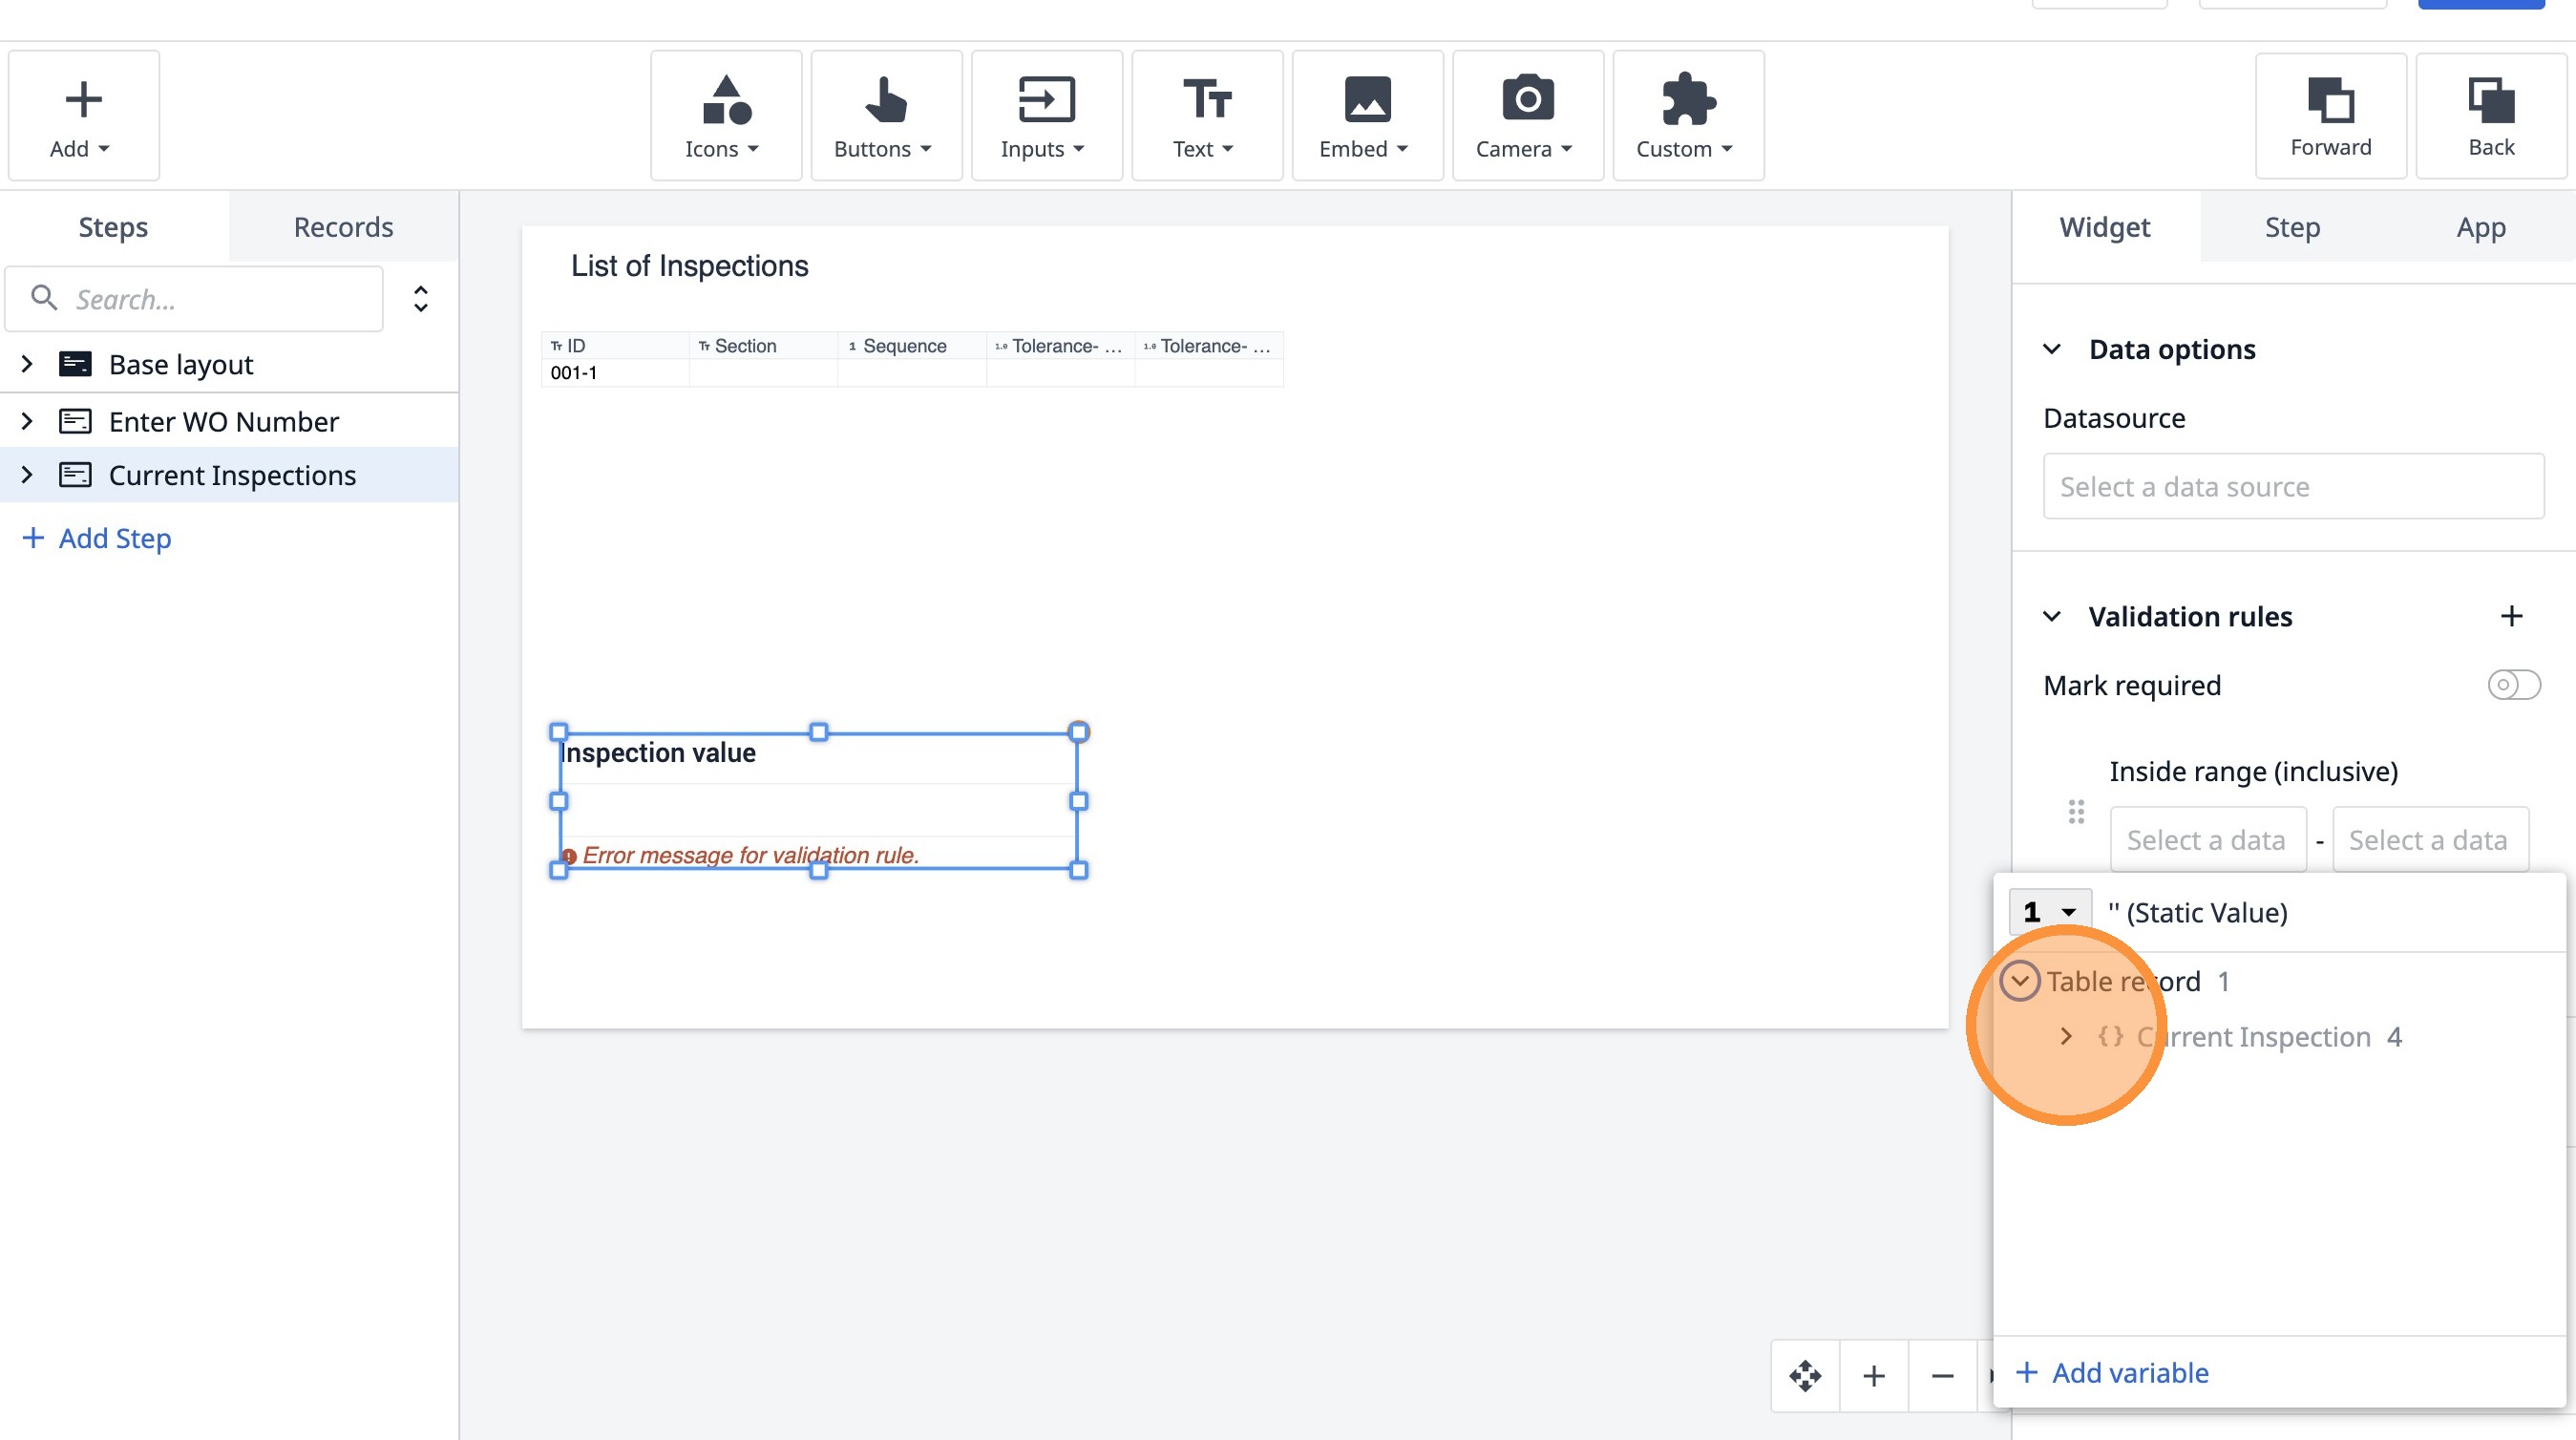
43. Click this button.
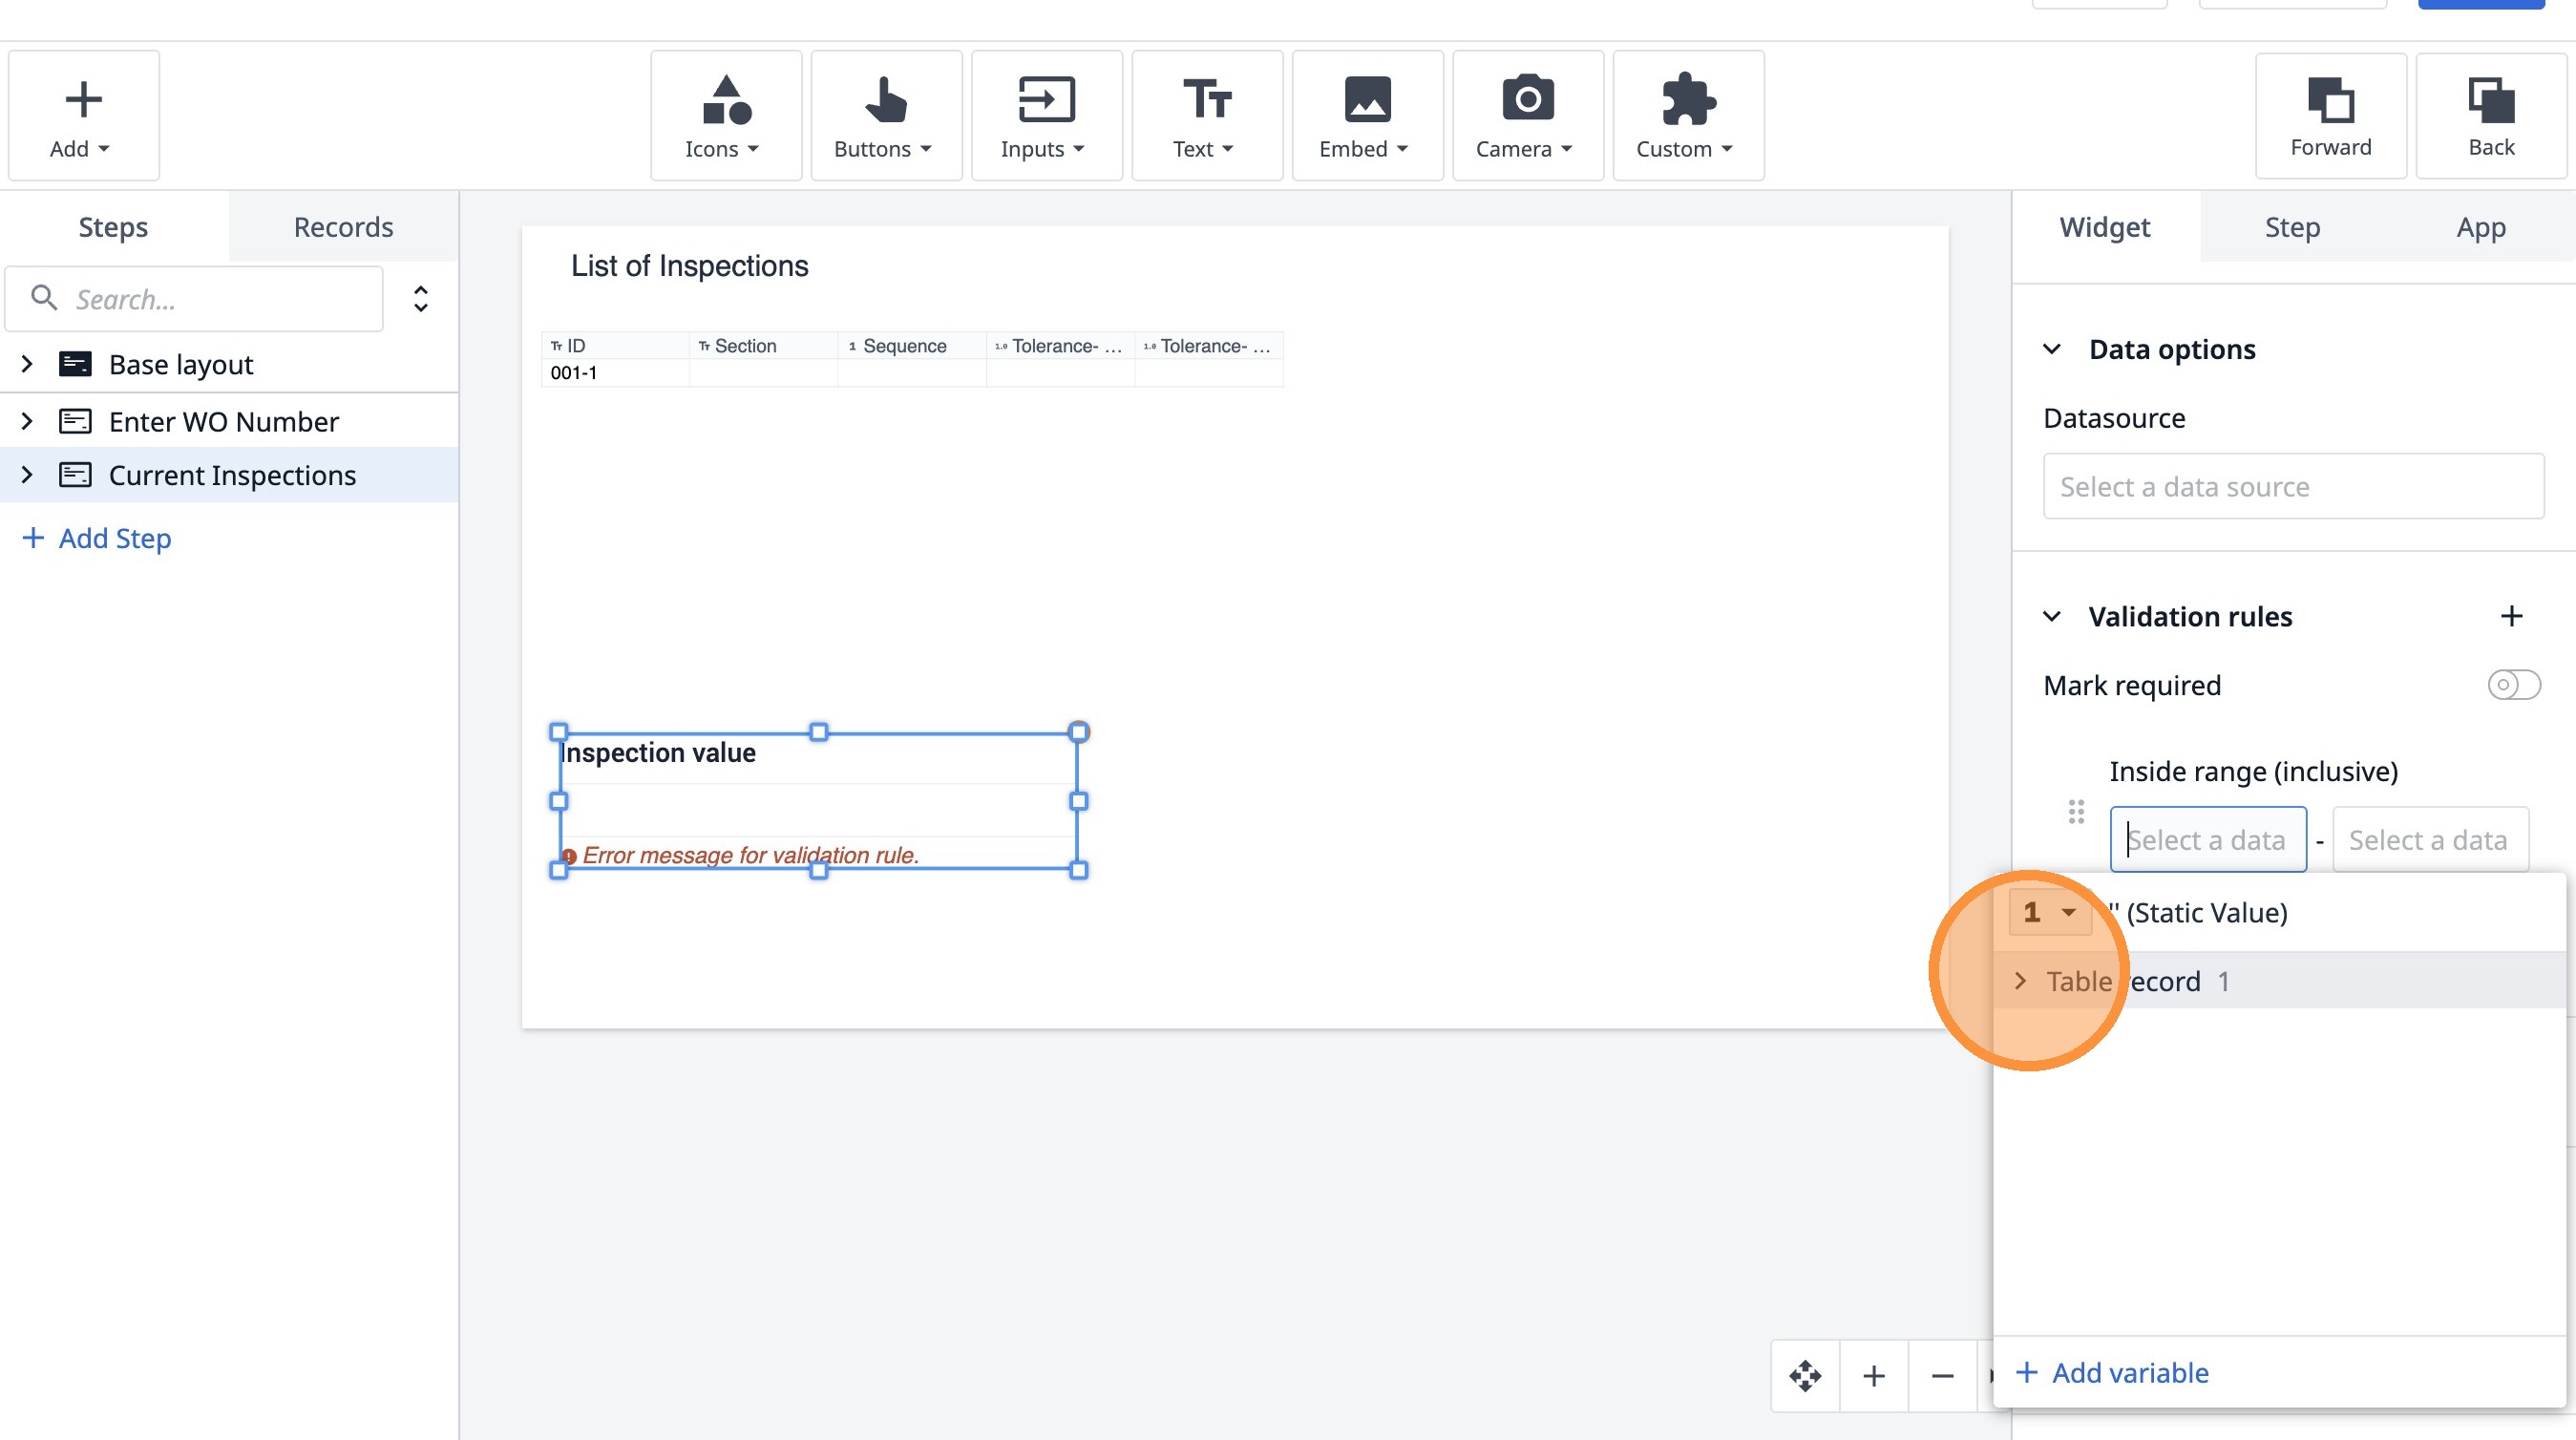
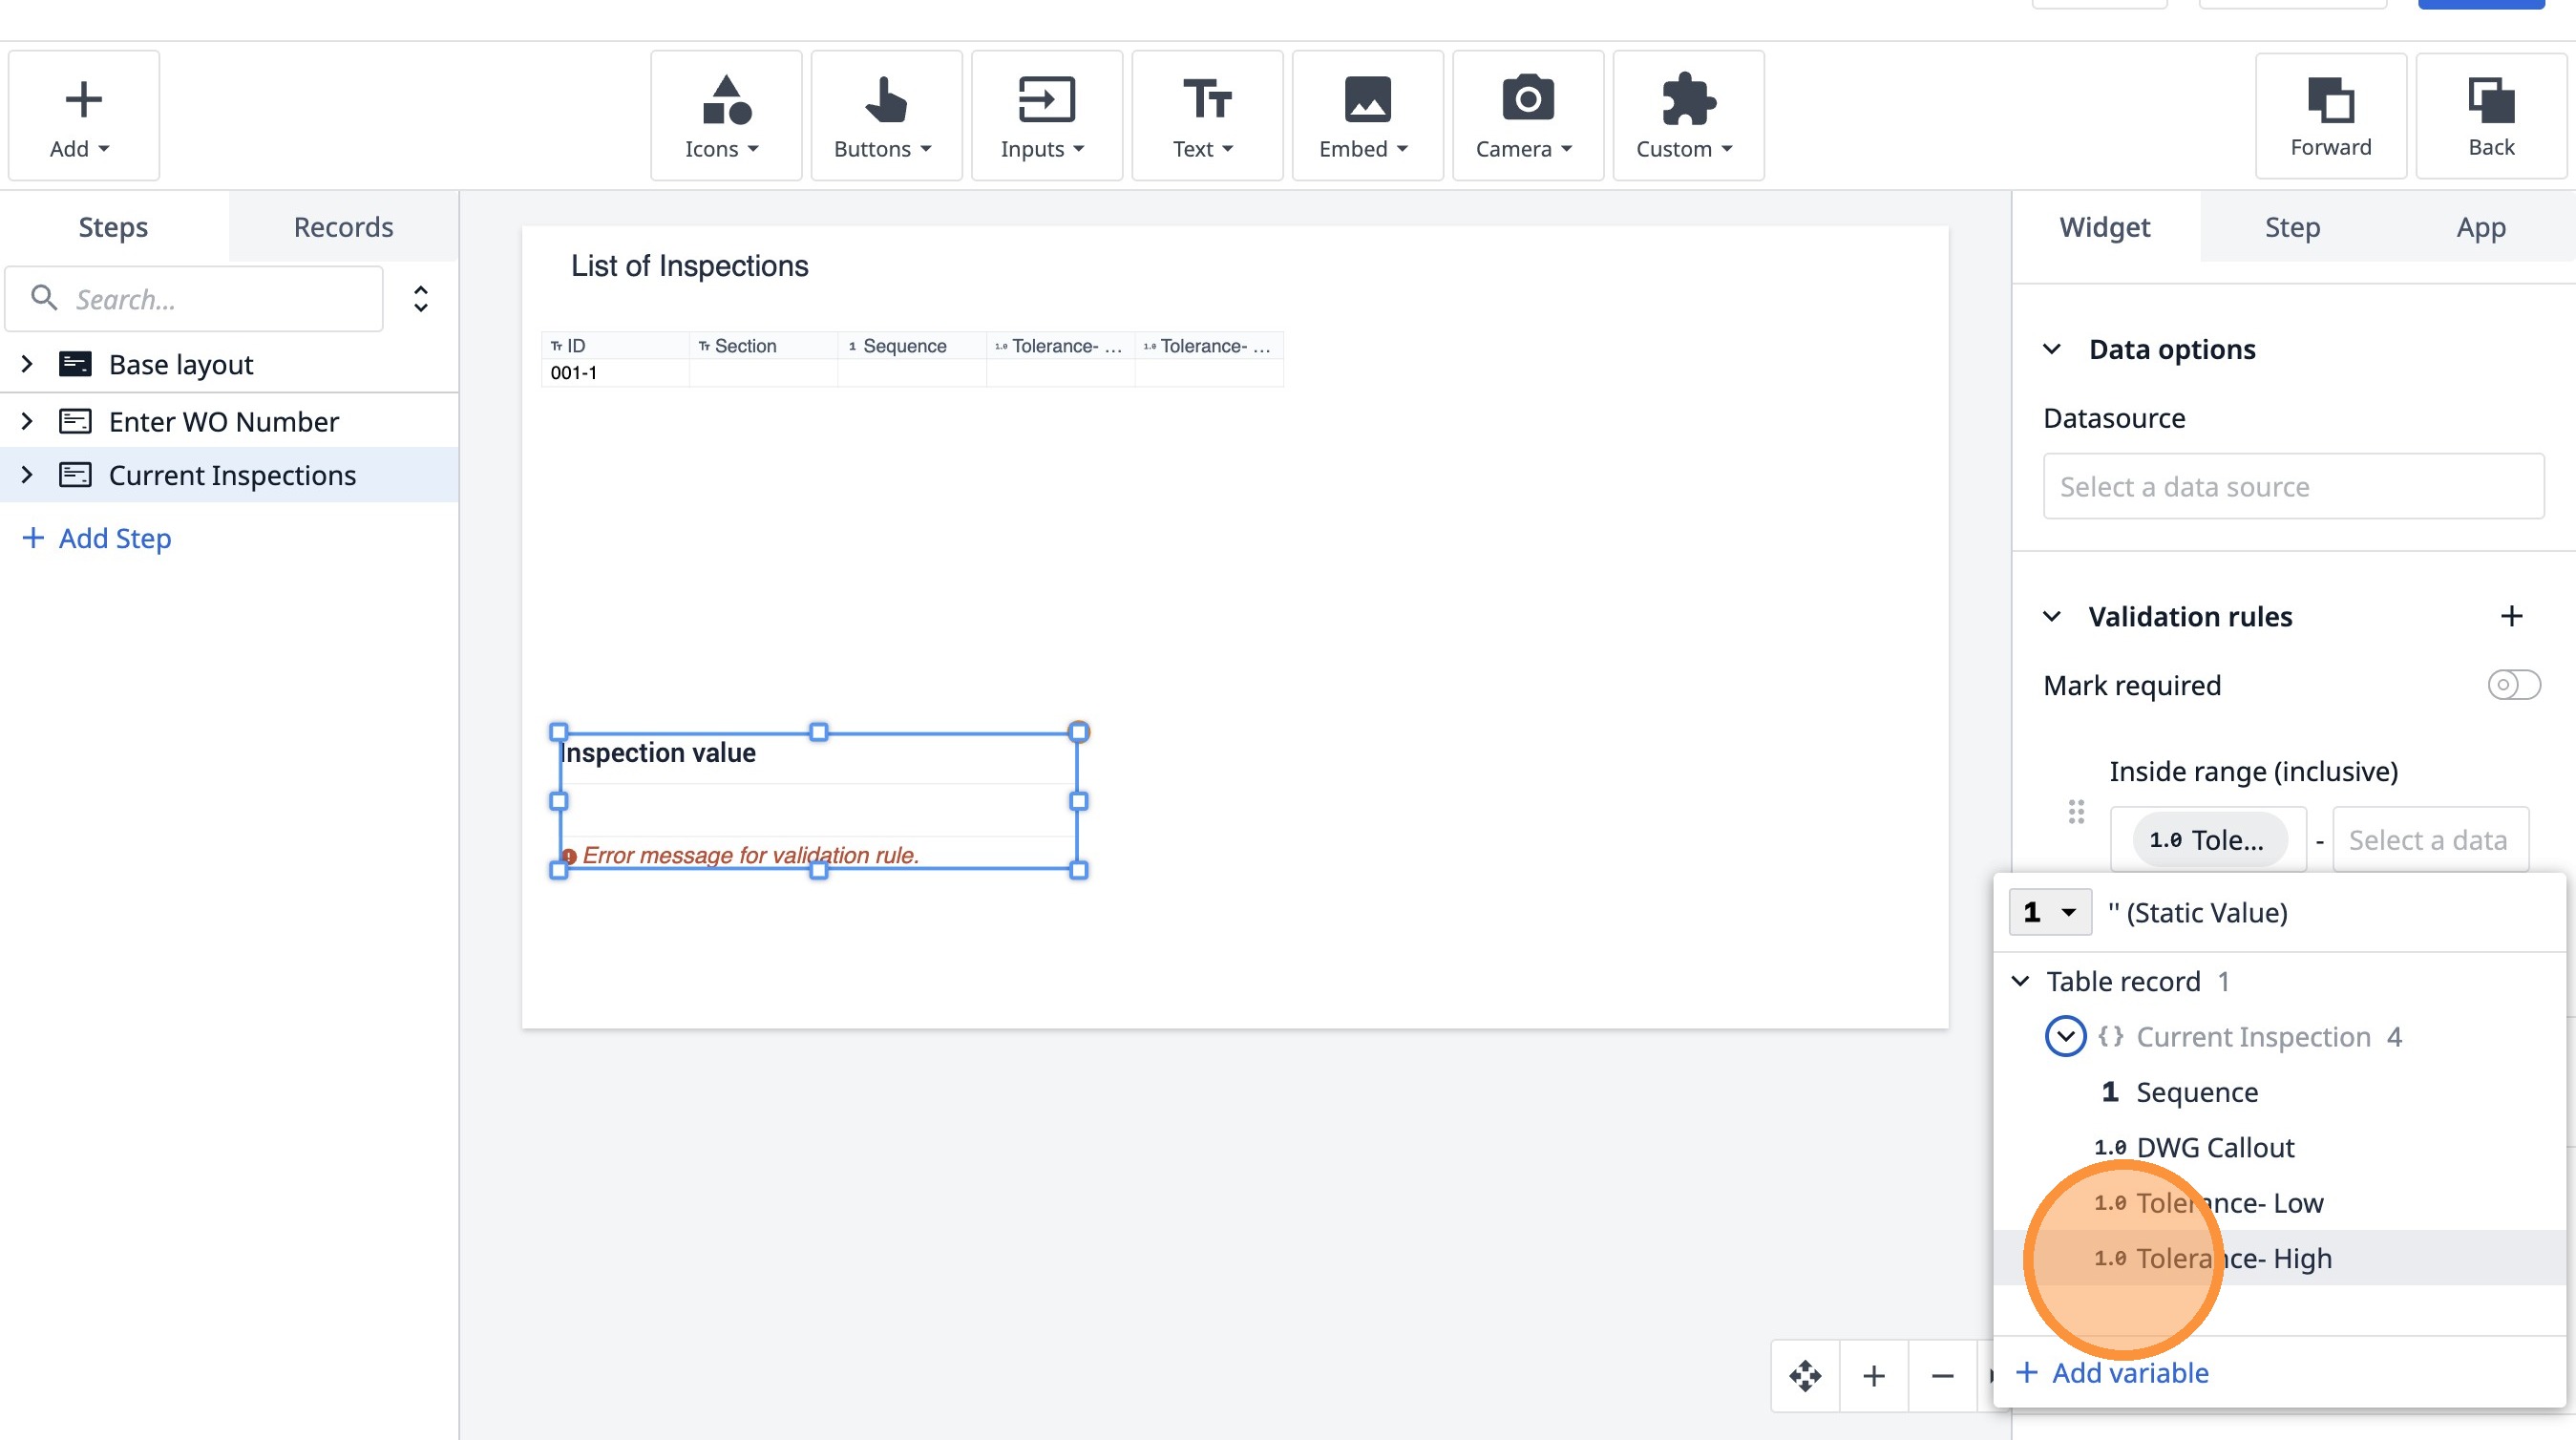
44. Click this button.
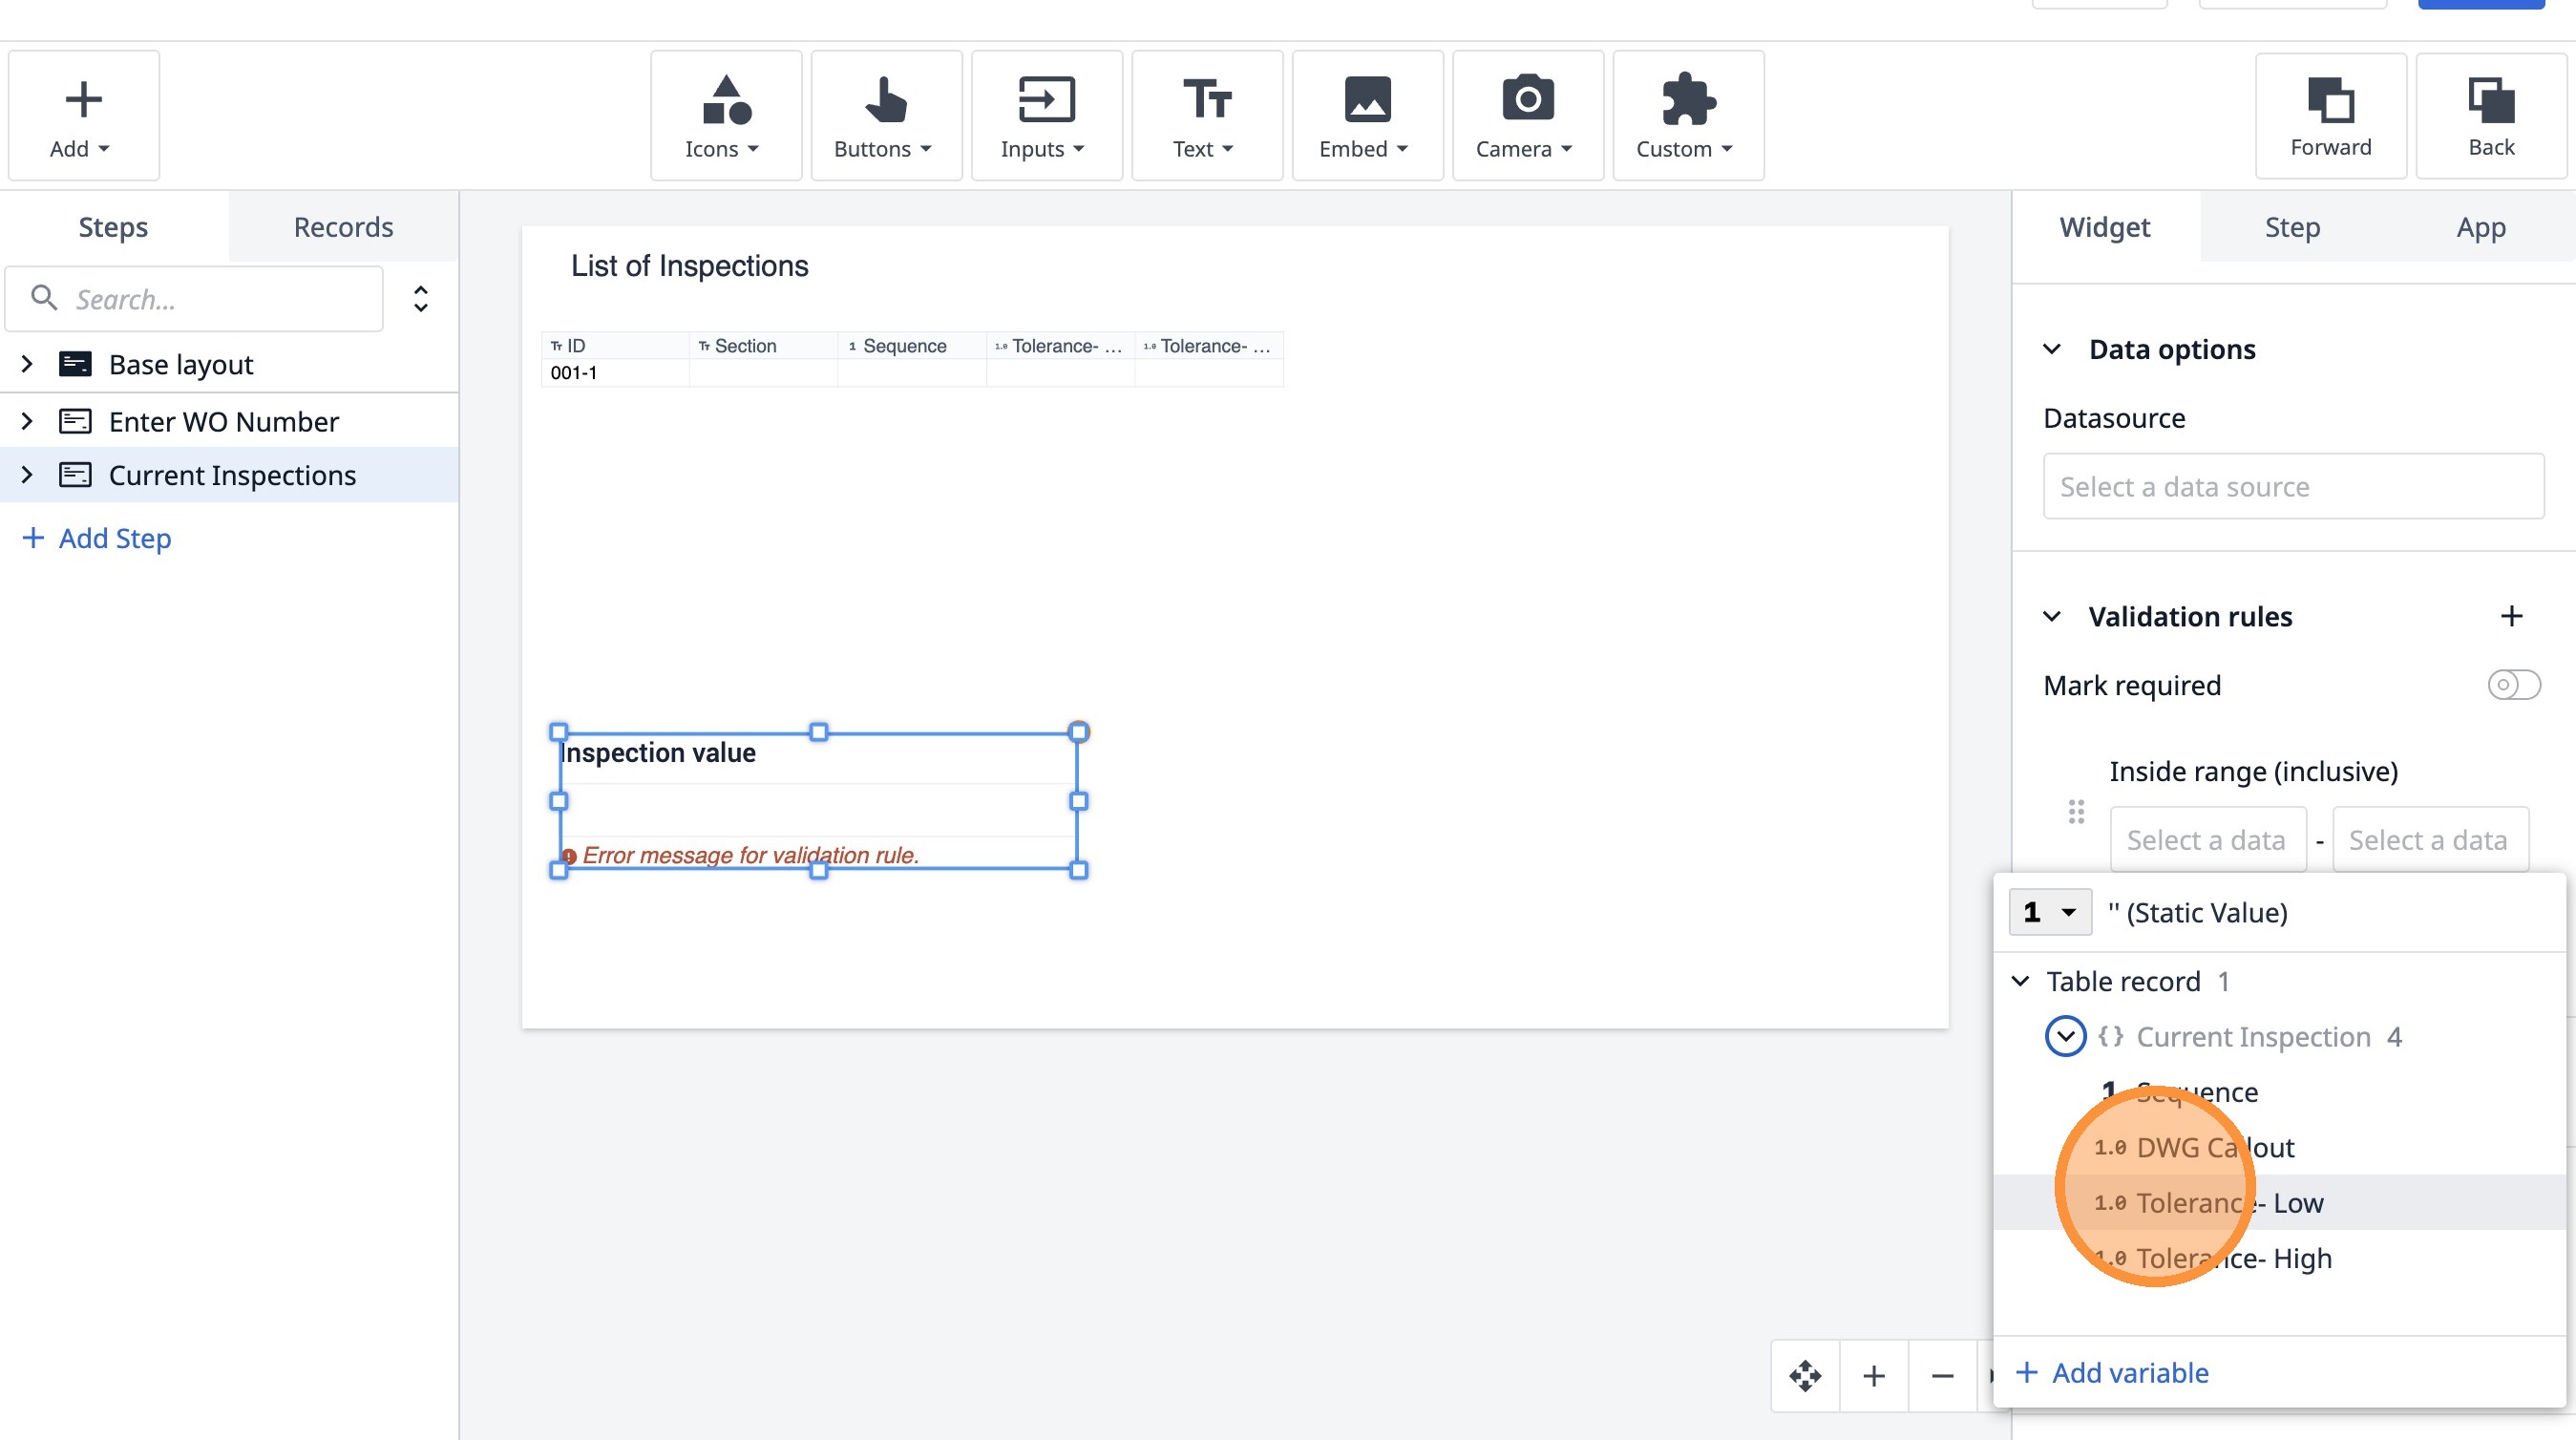
45. Click "Tolerance- Low"
46. Click "Select a data source"
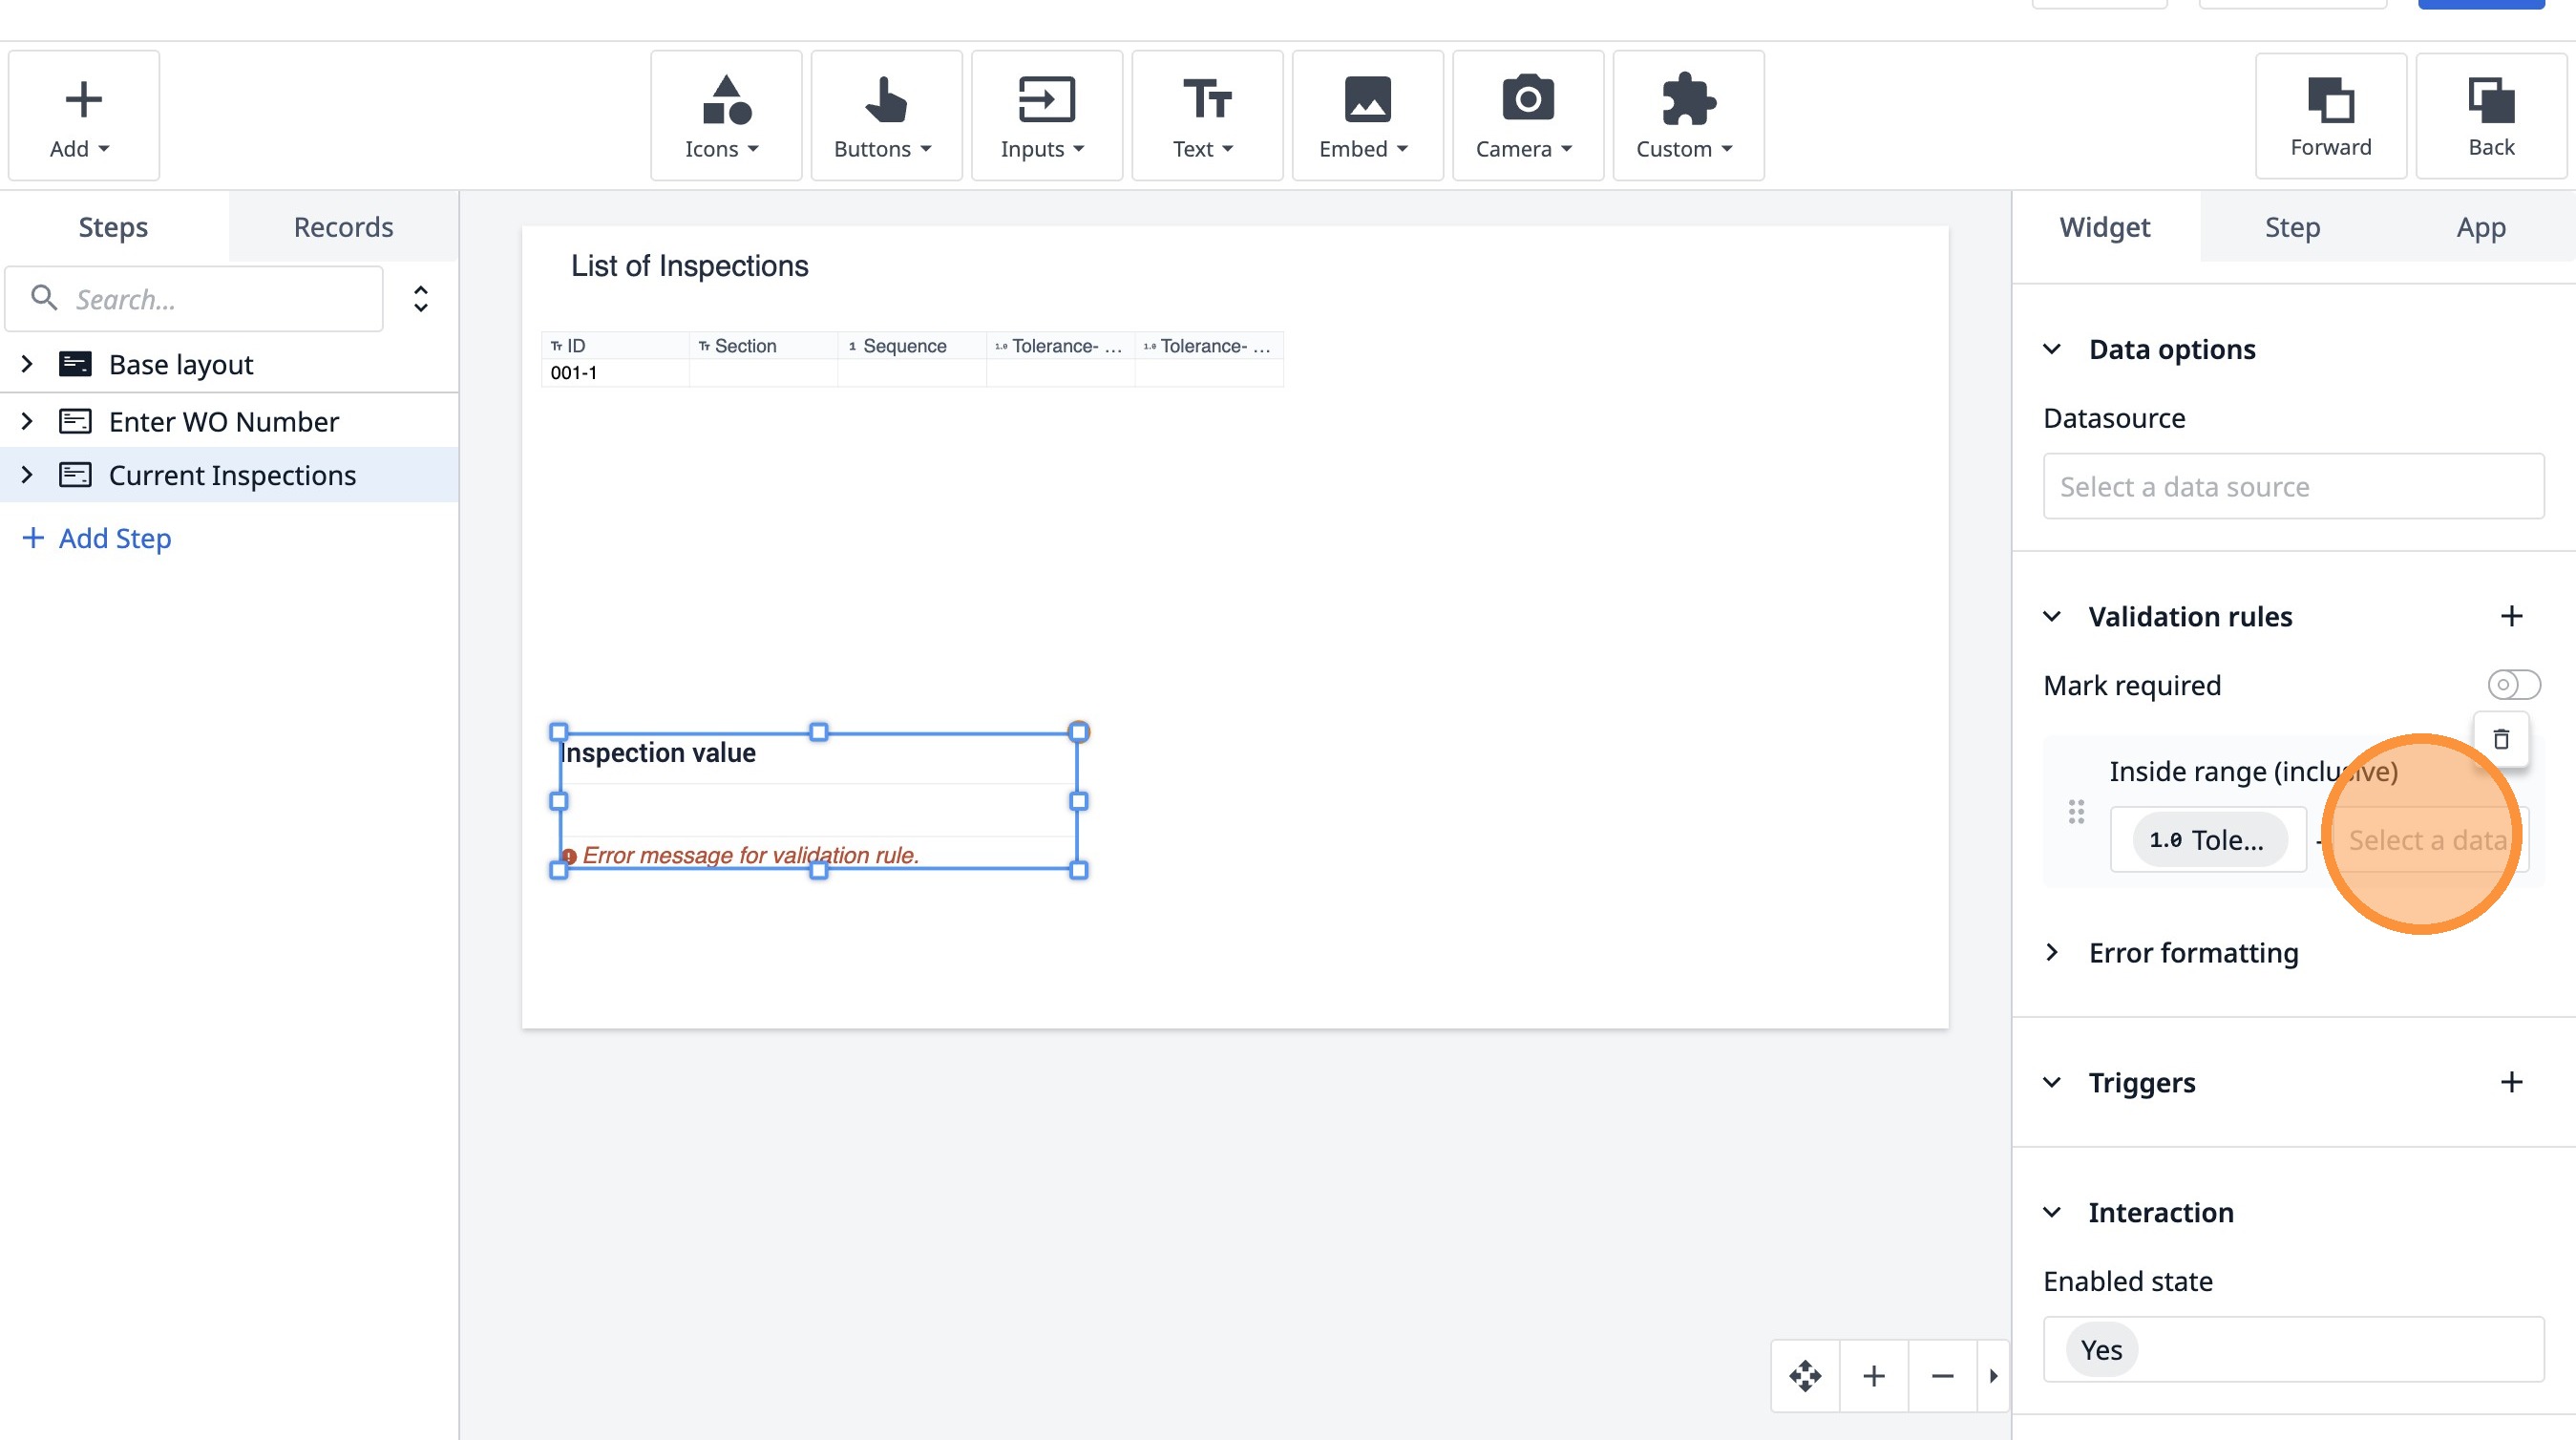
47. Click this button.
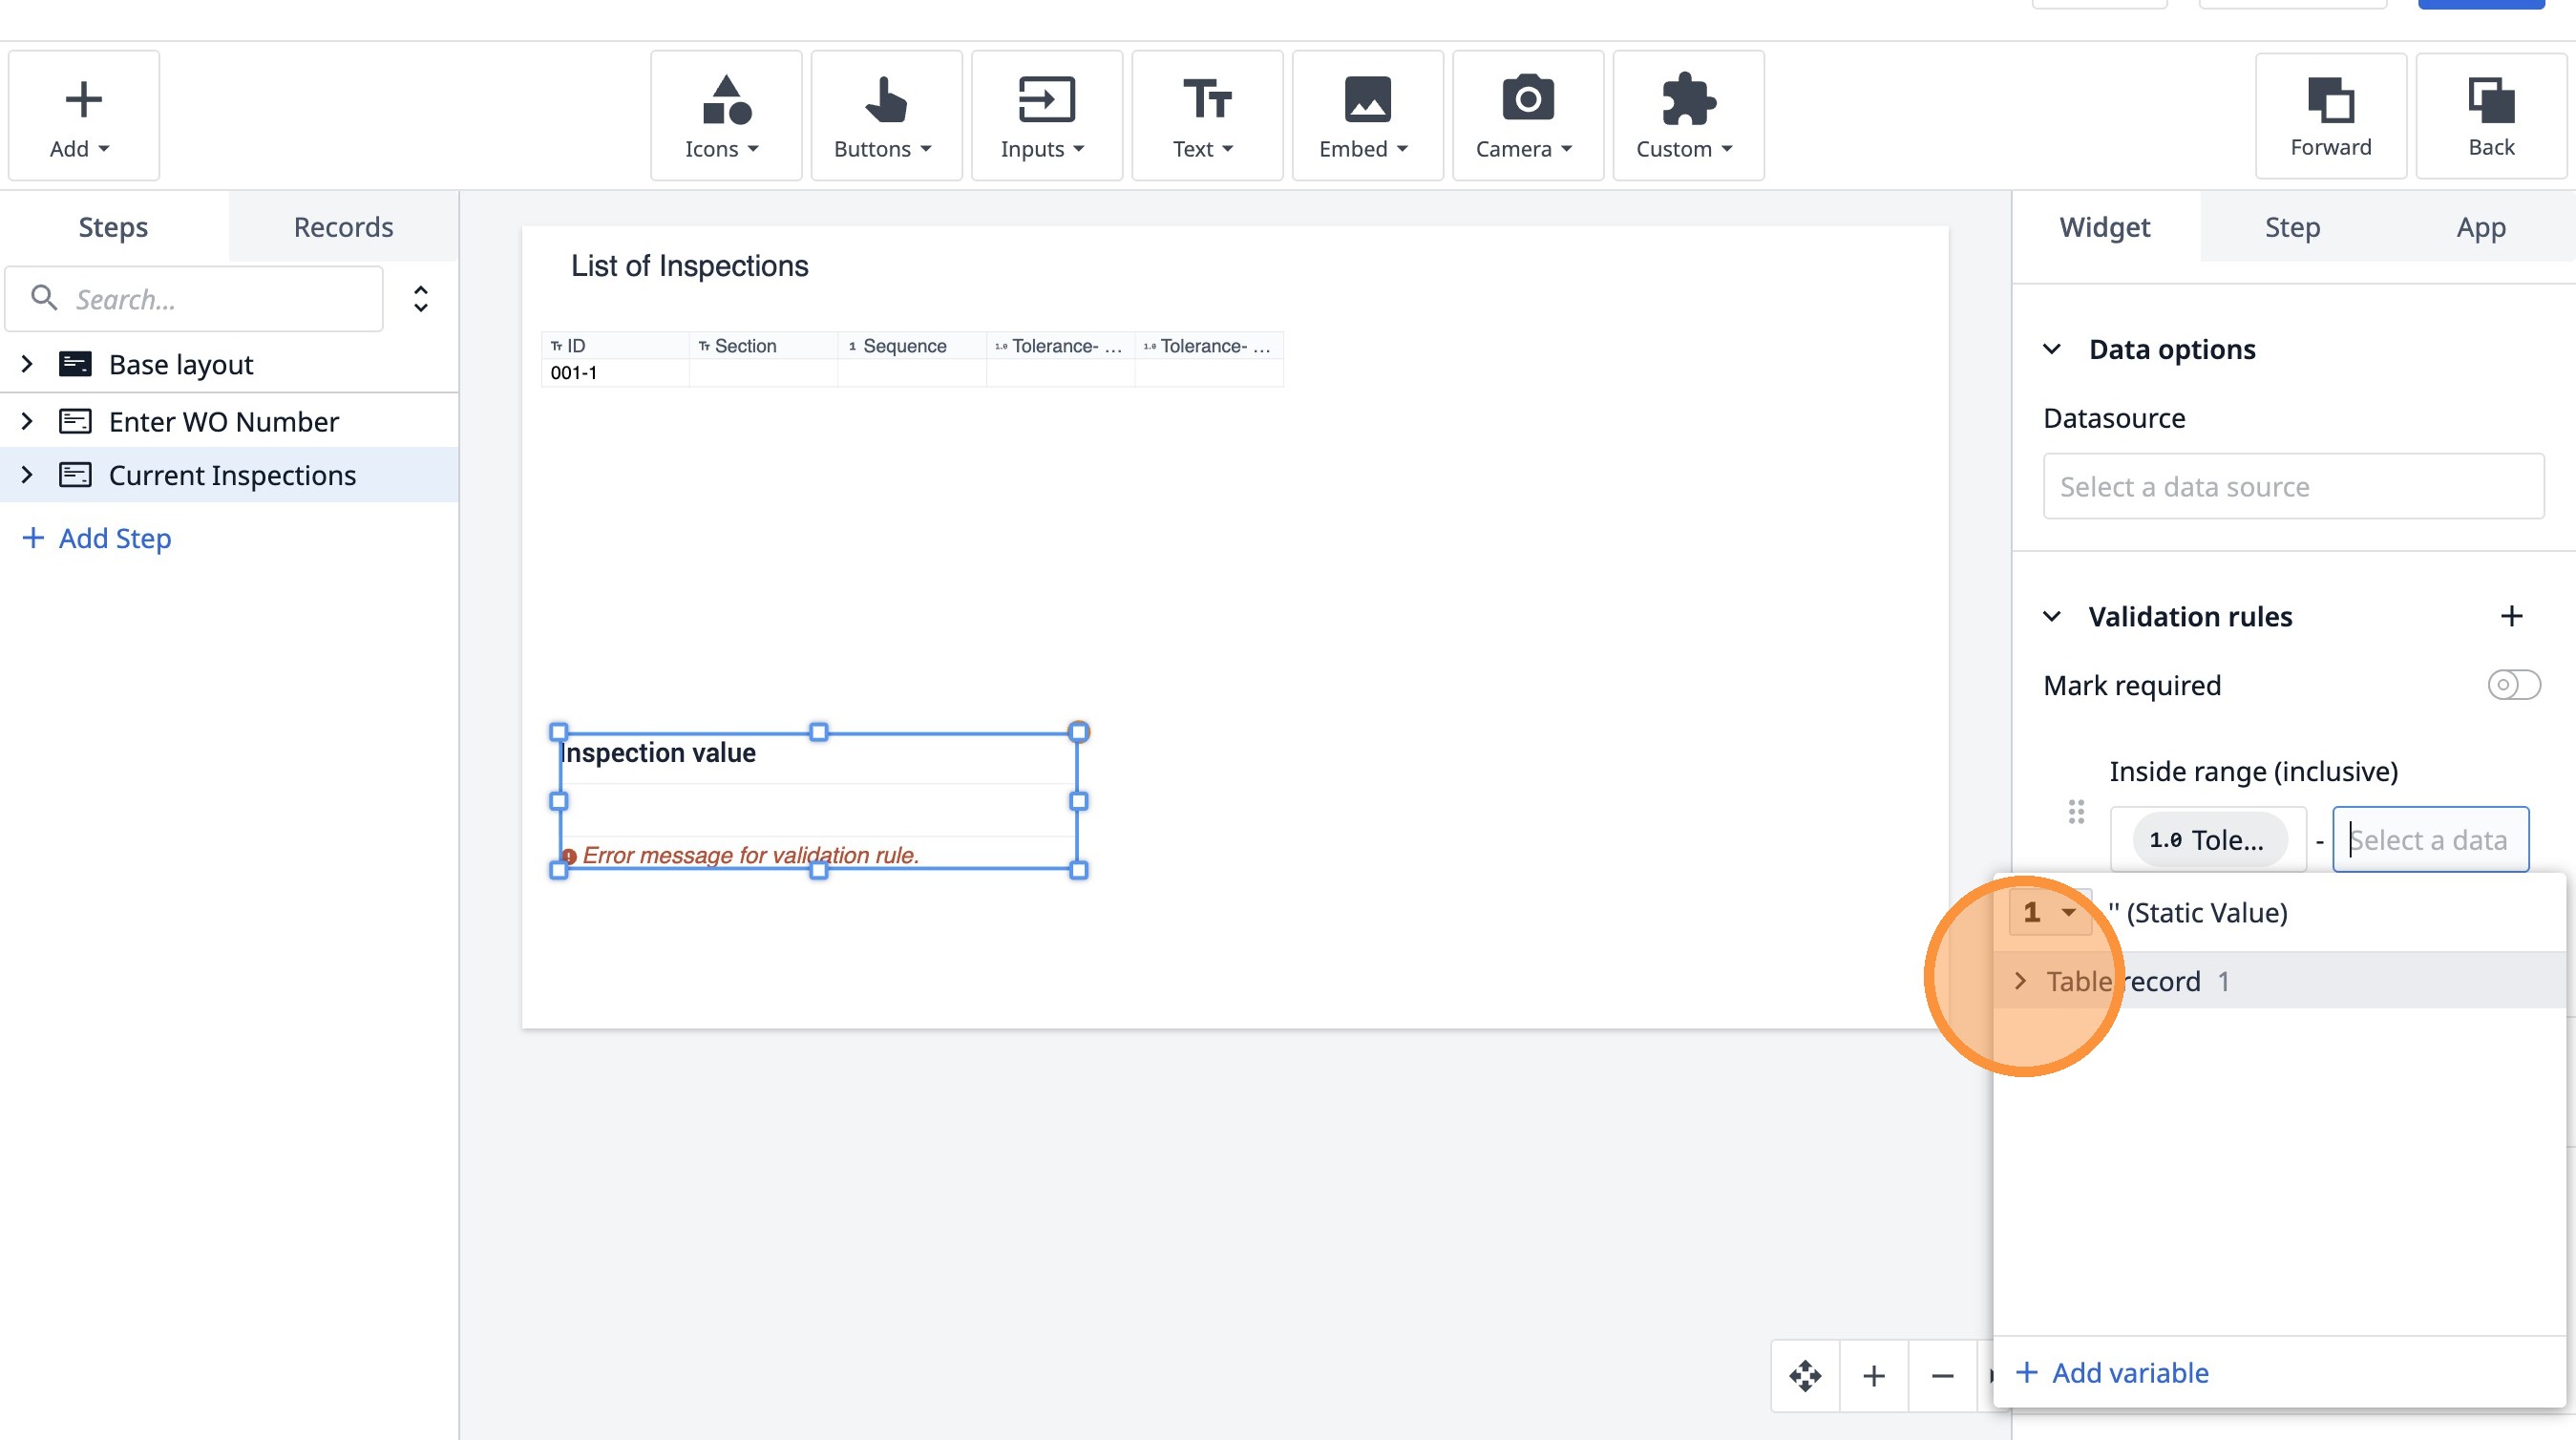
48. Click this button.
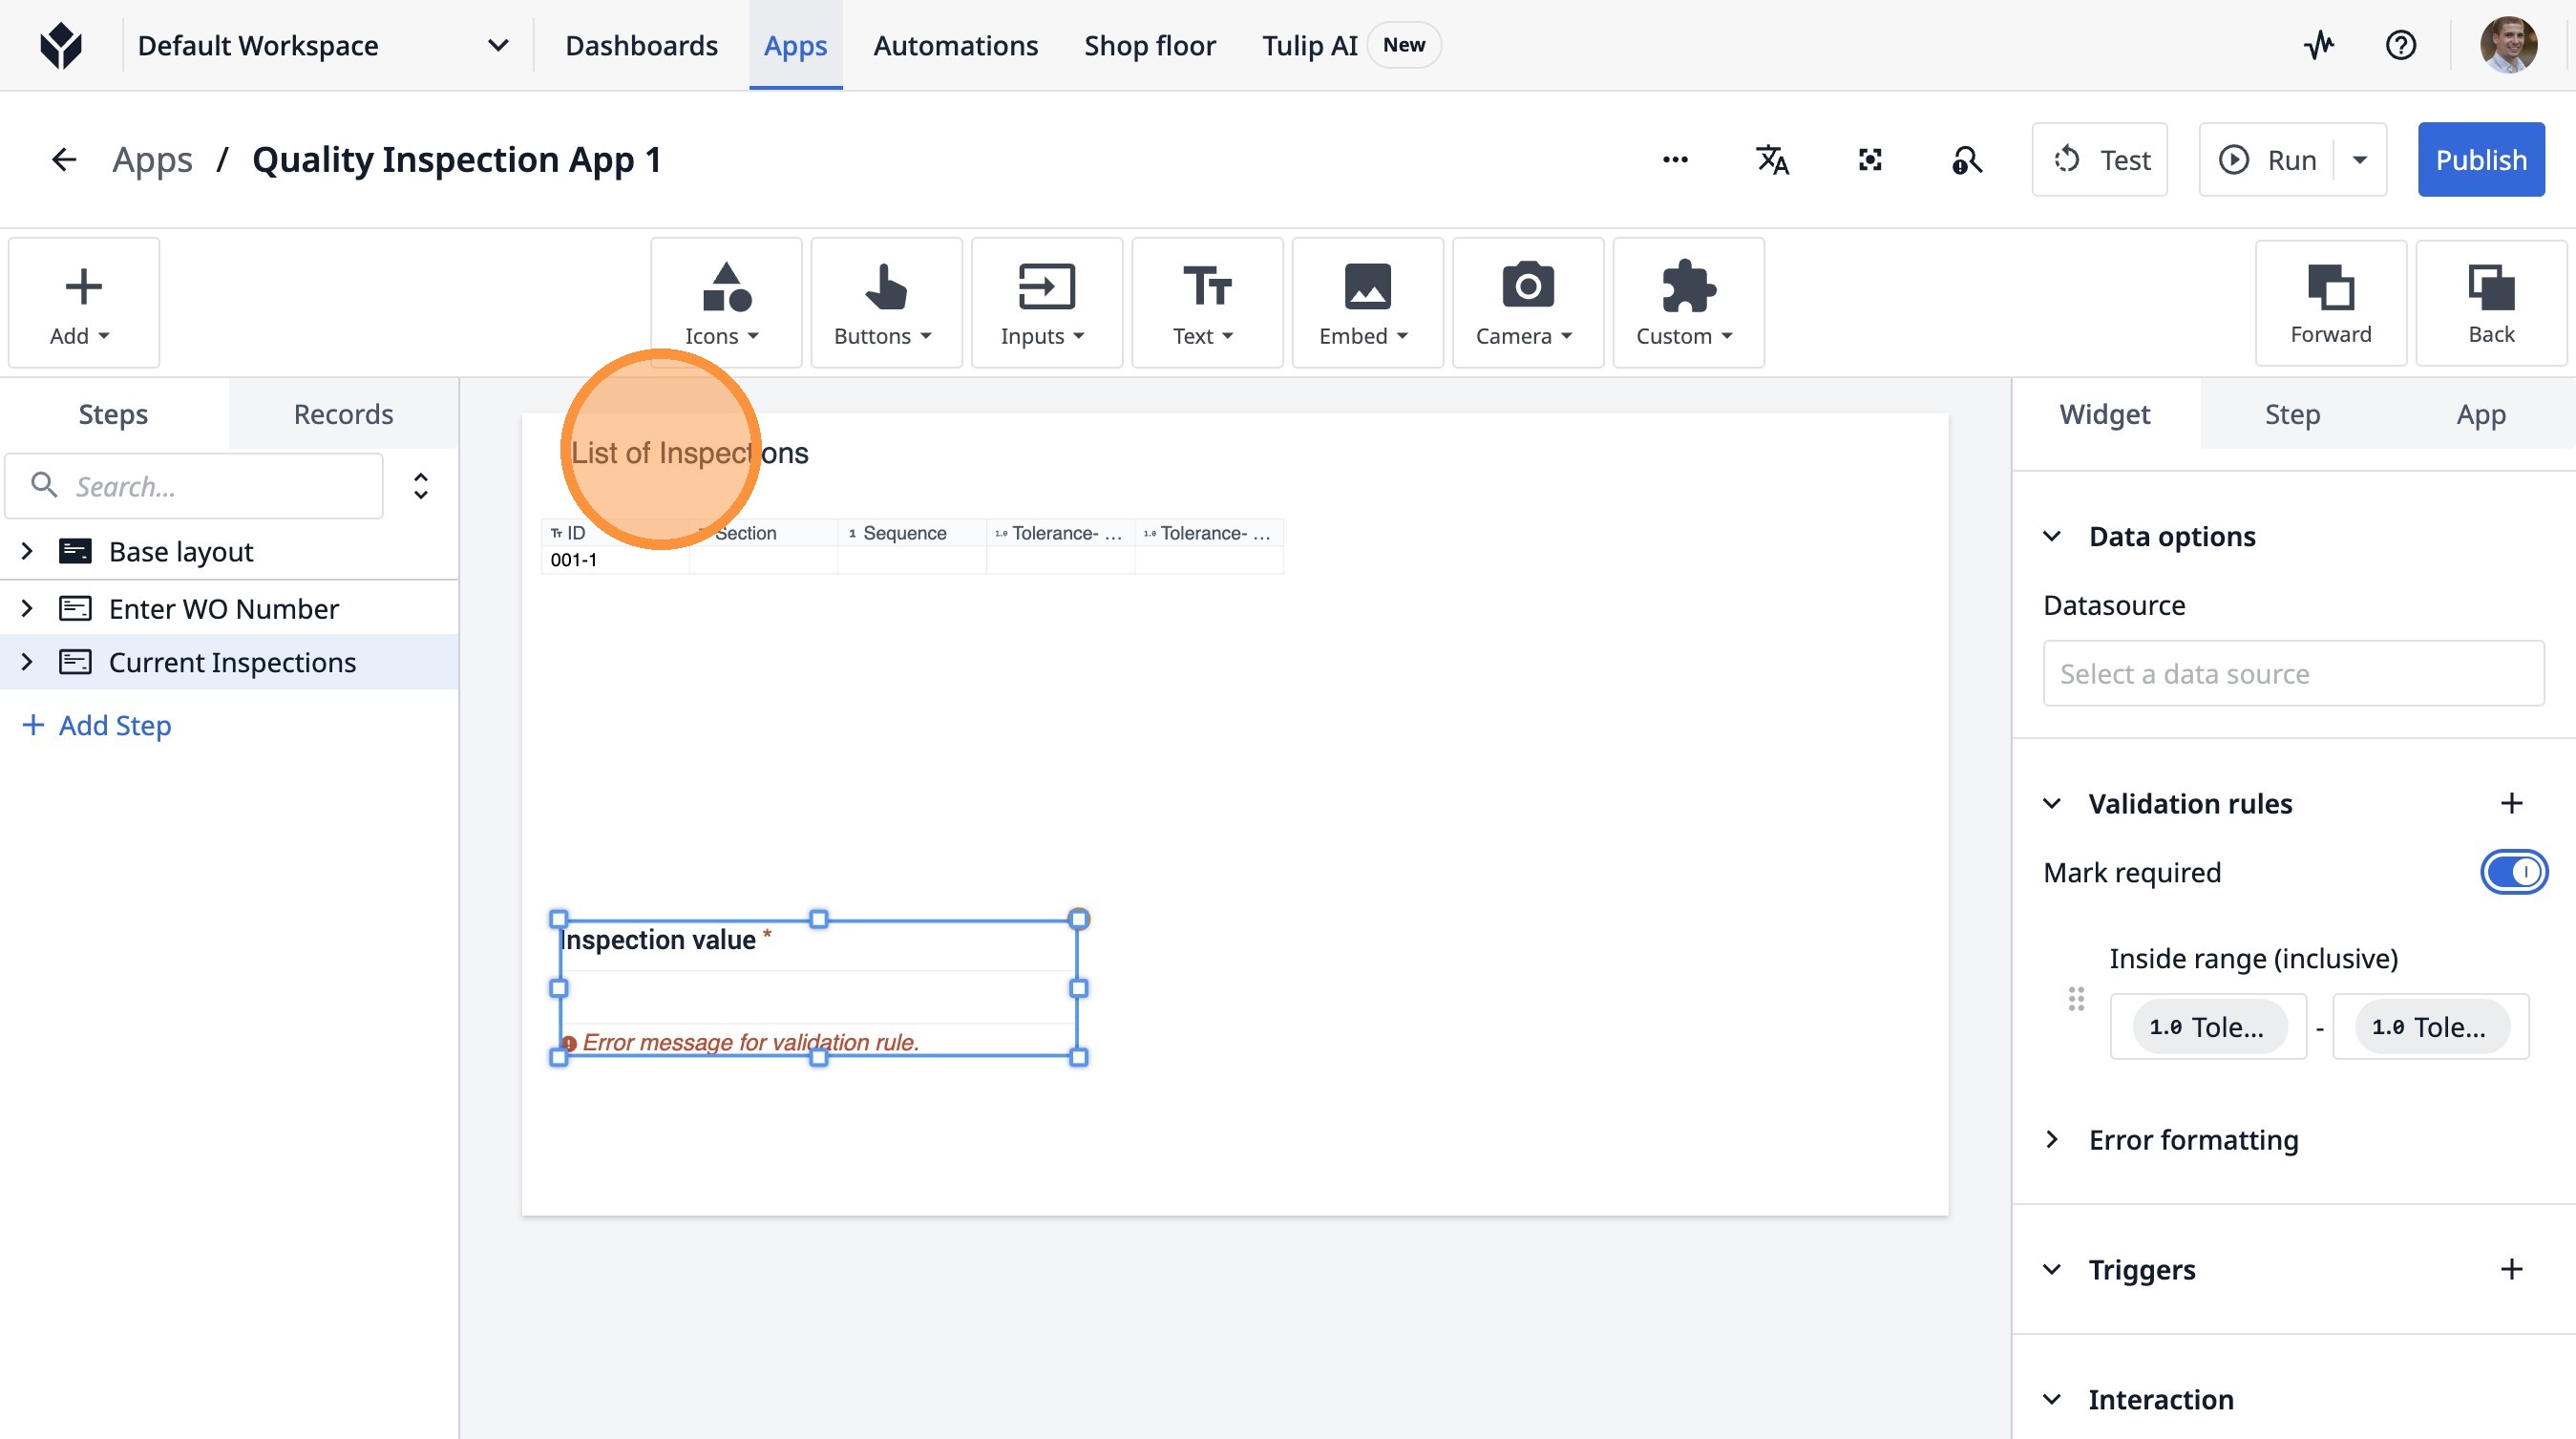
49. Click here.
50. Click "Enable "
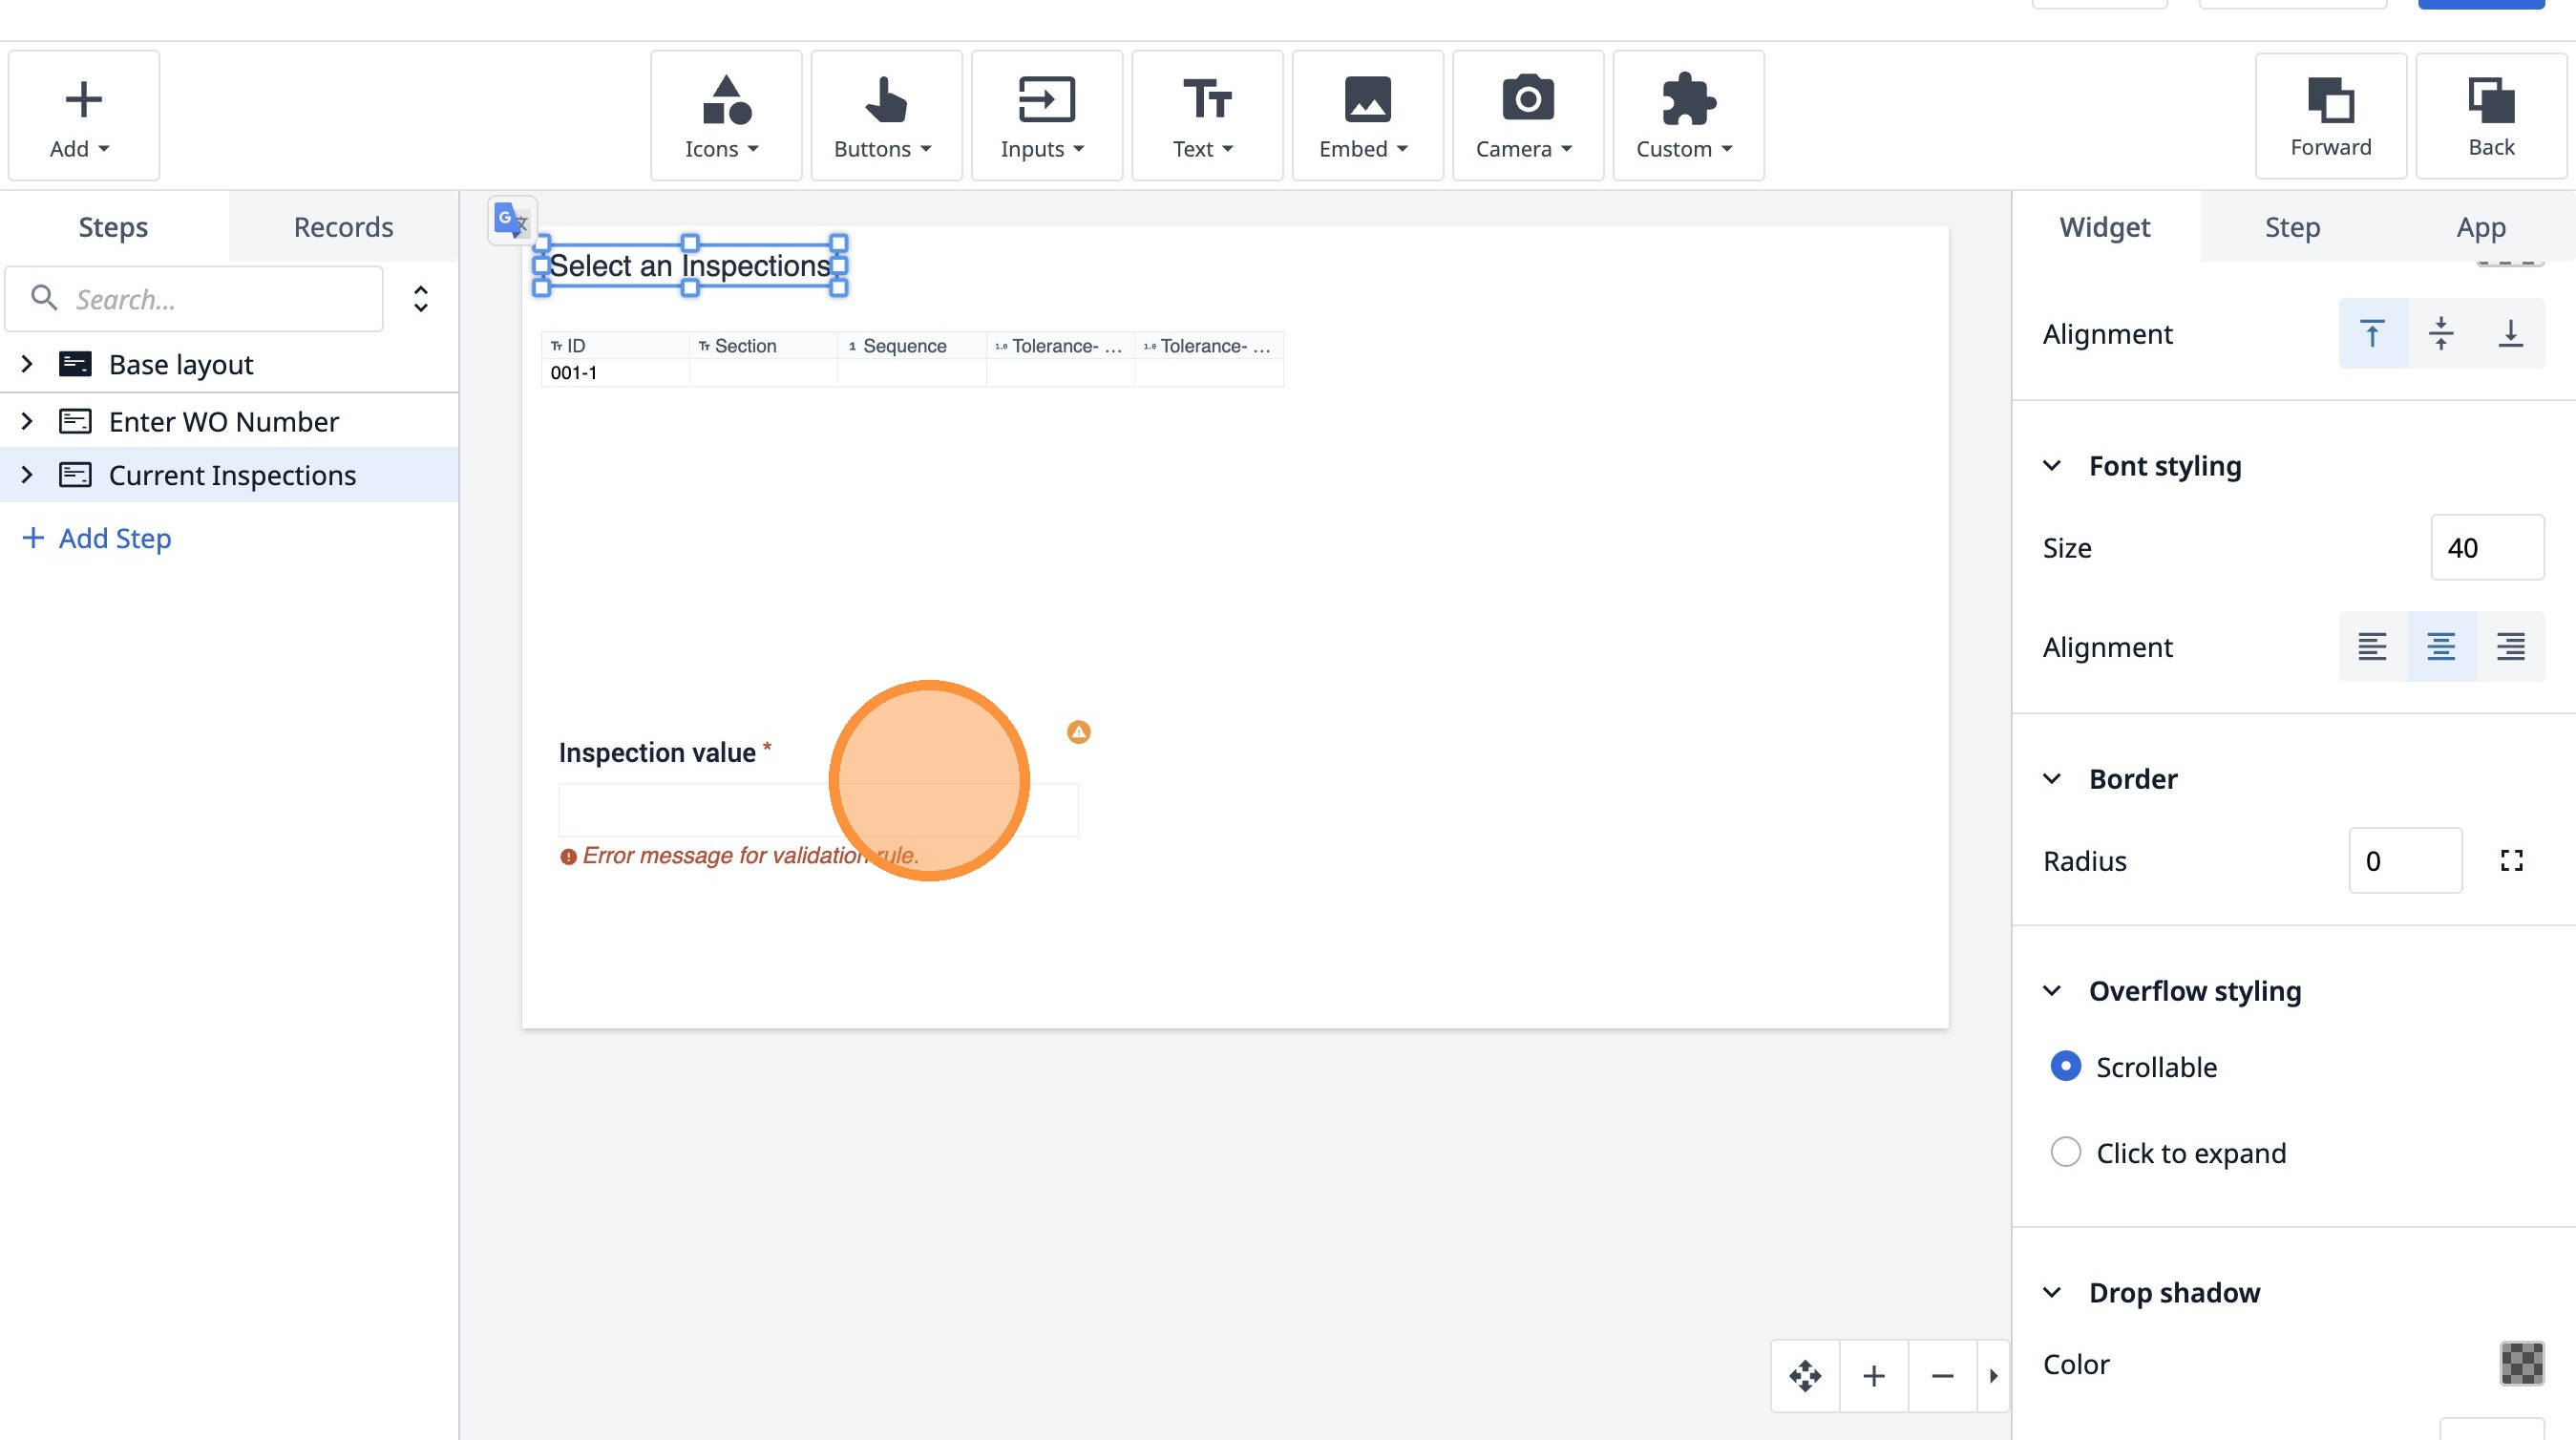
51. Double-click "List of Inspections"
52. Click "List of Inspections"
53. Type "Select an"
54. Click here.
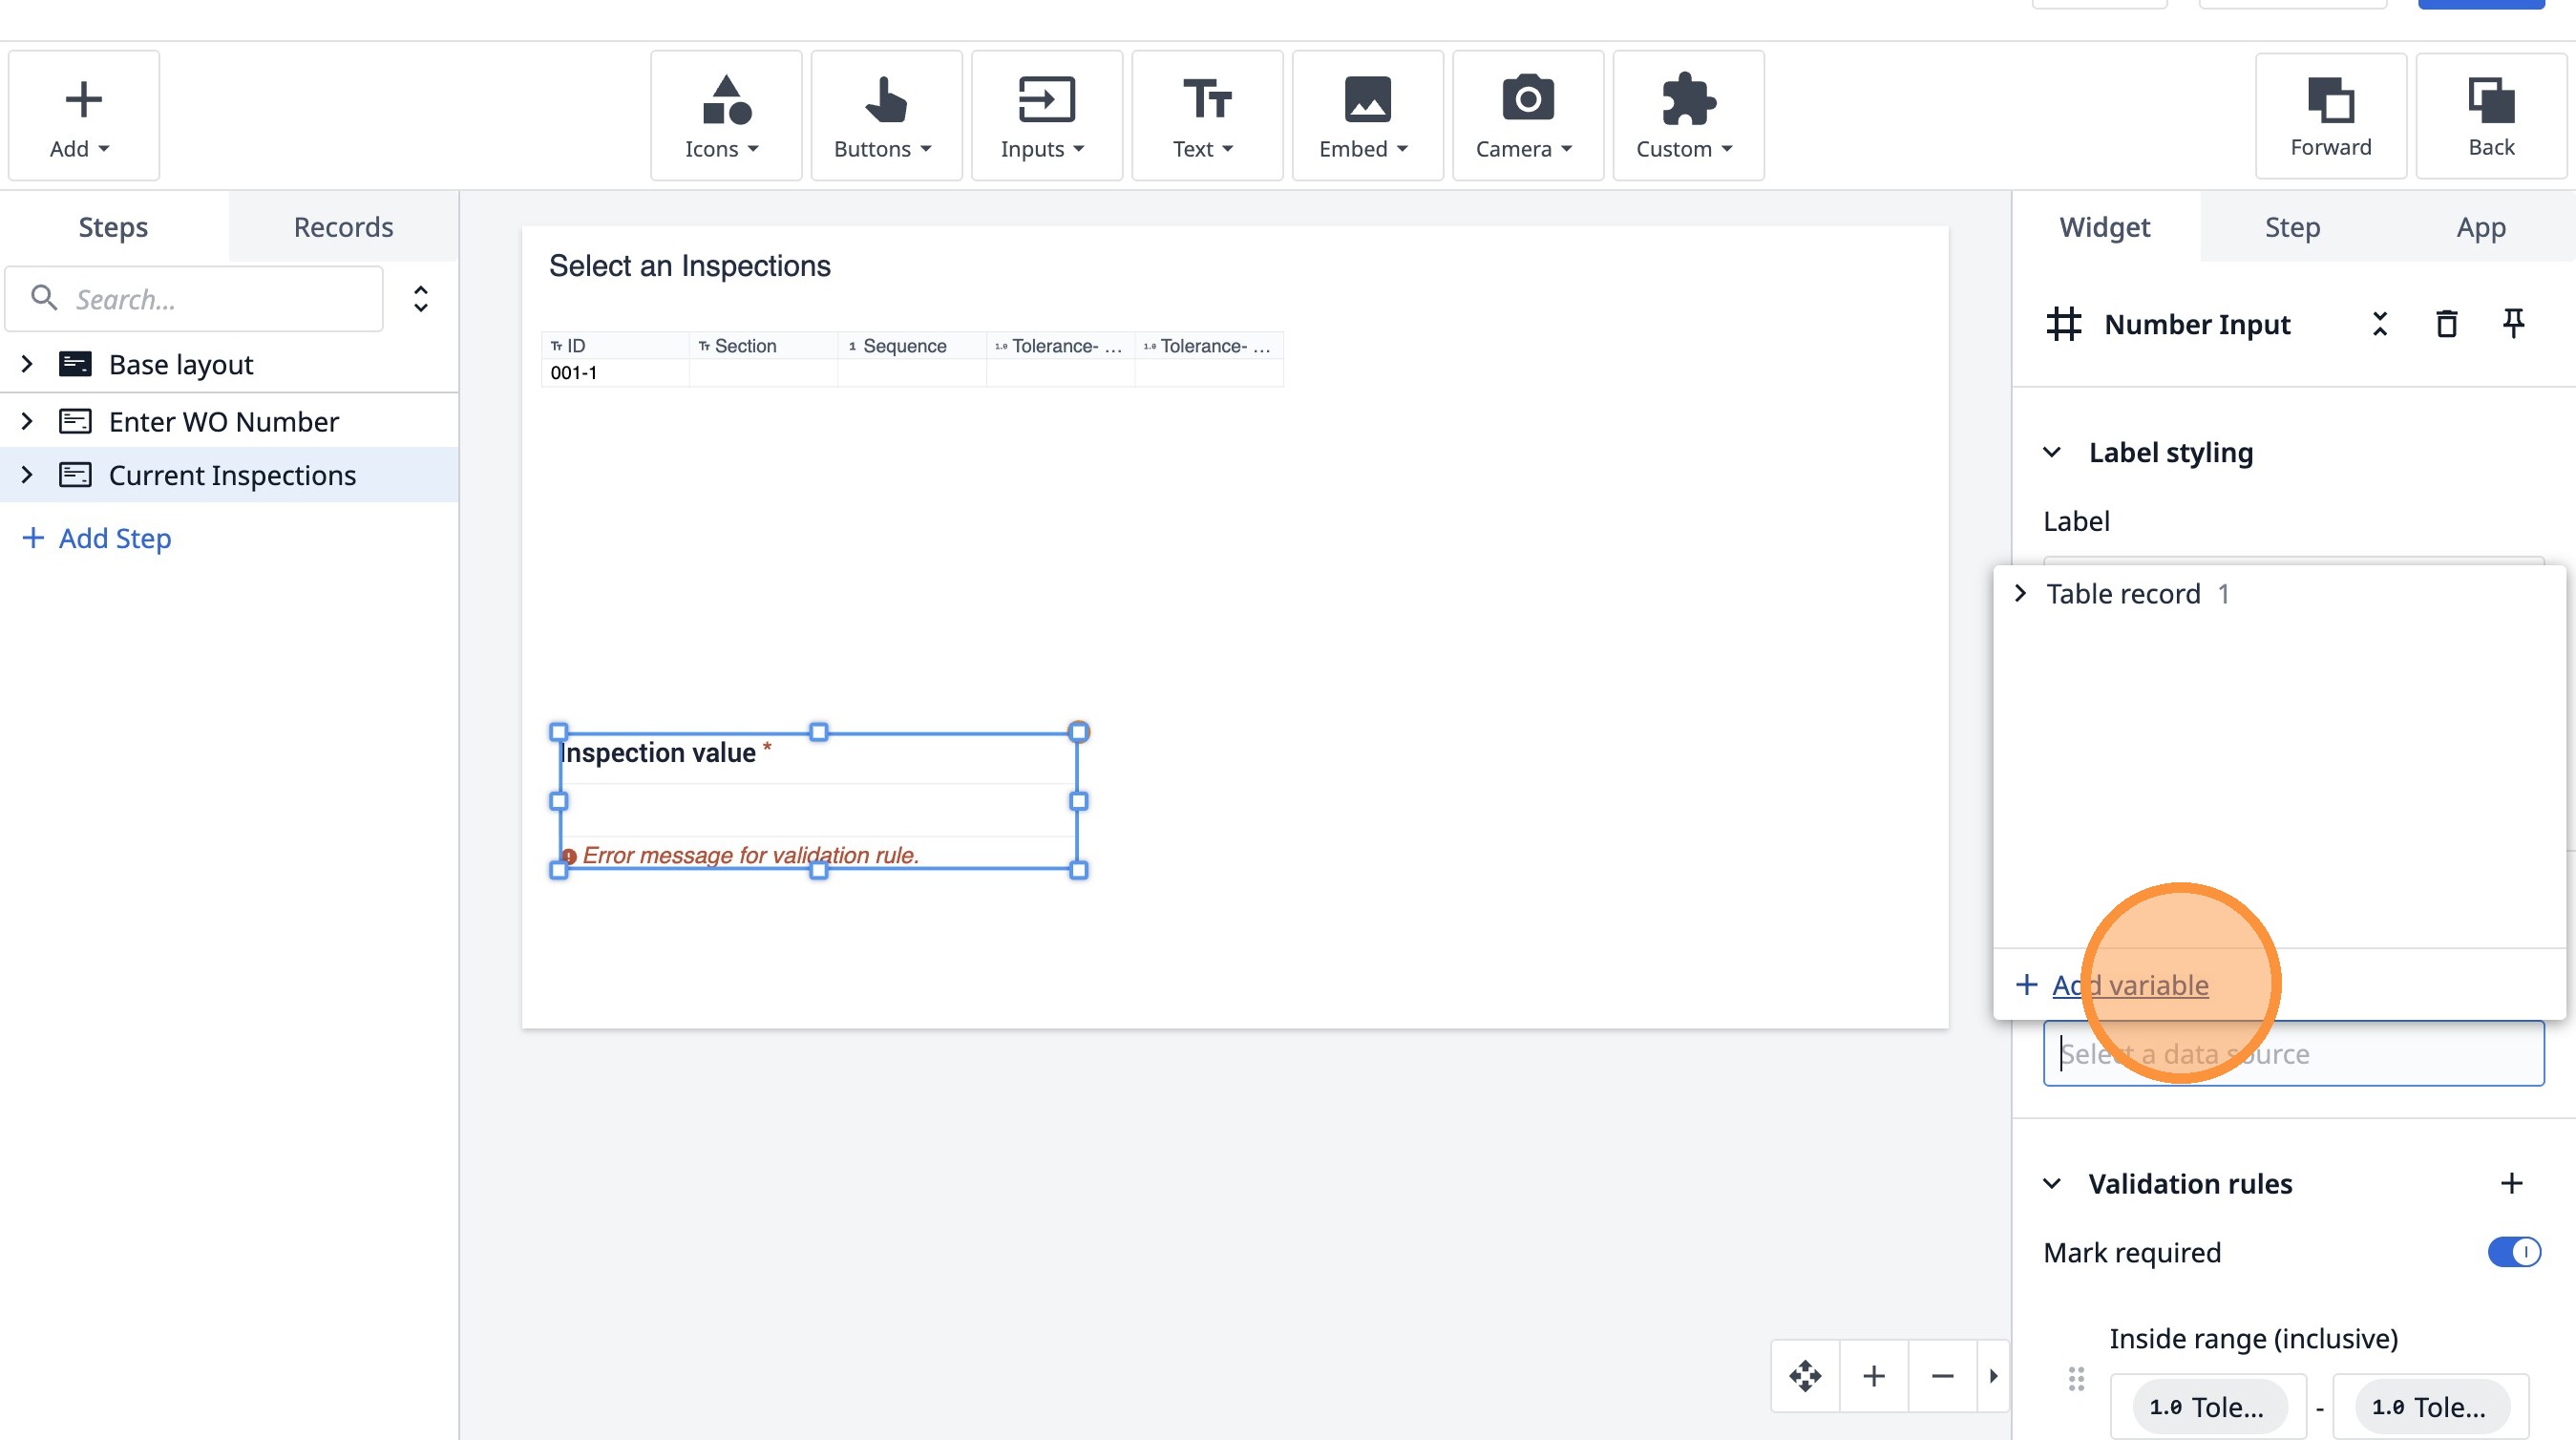
55. Click "Select a data source"
56. Click "Add variable"
57. Type "current_inspection_value"
58. Click "Integer"
59. Click "Number"
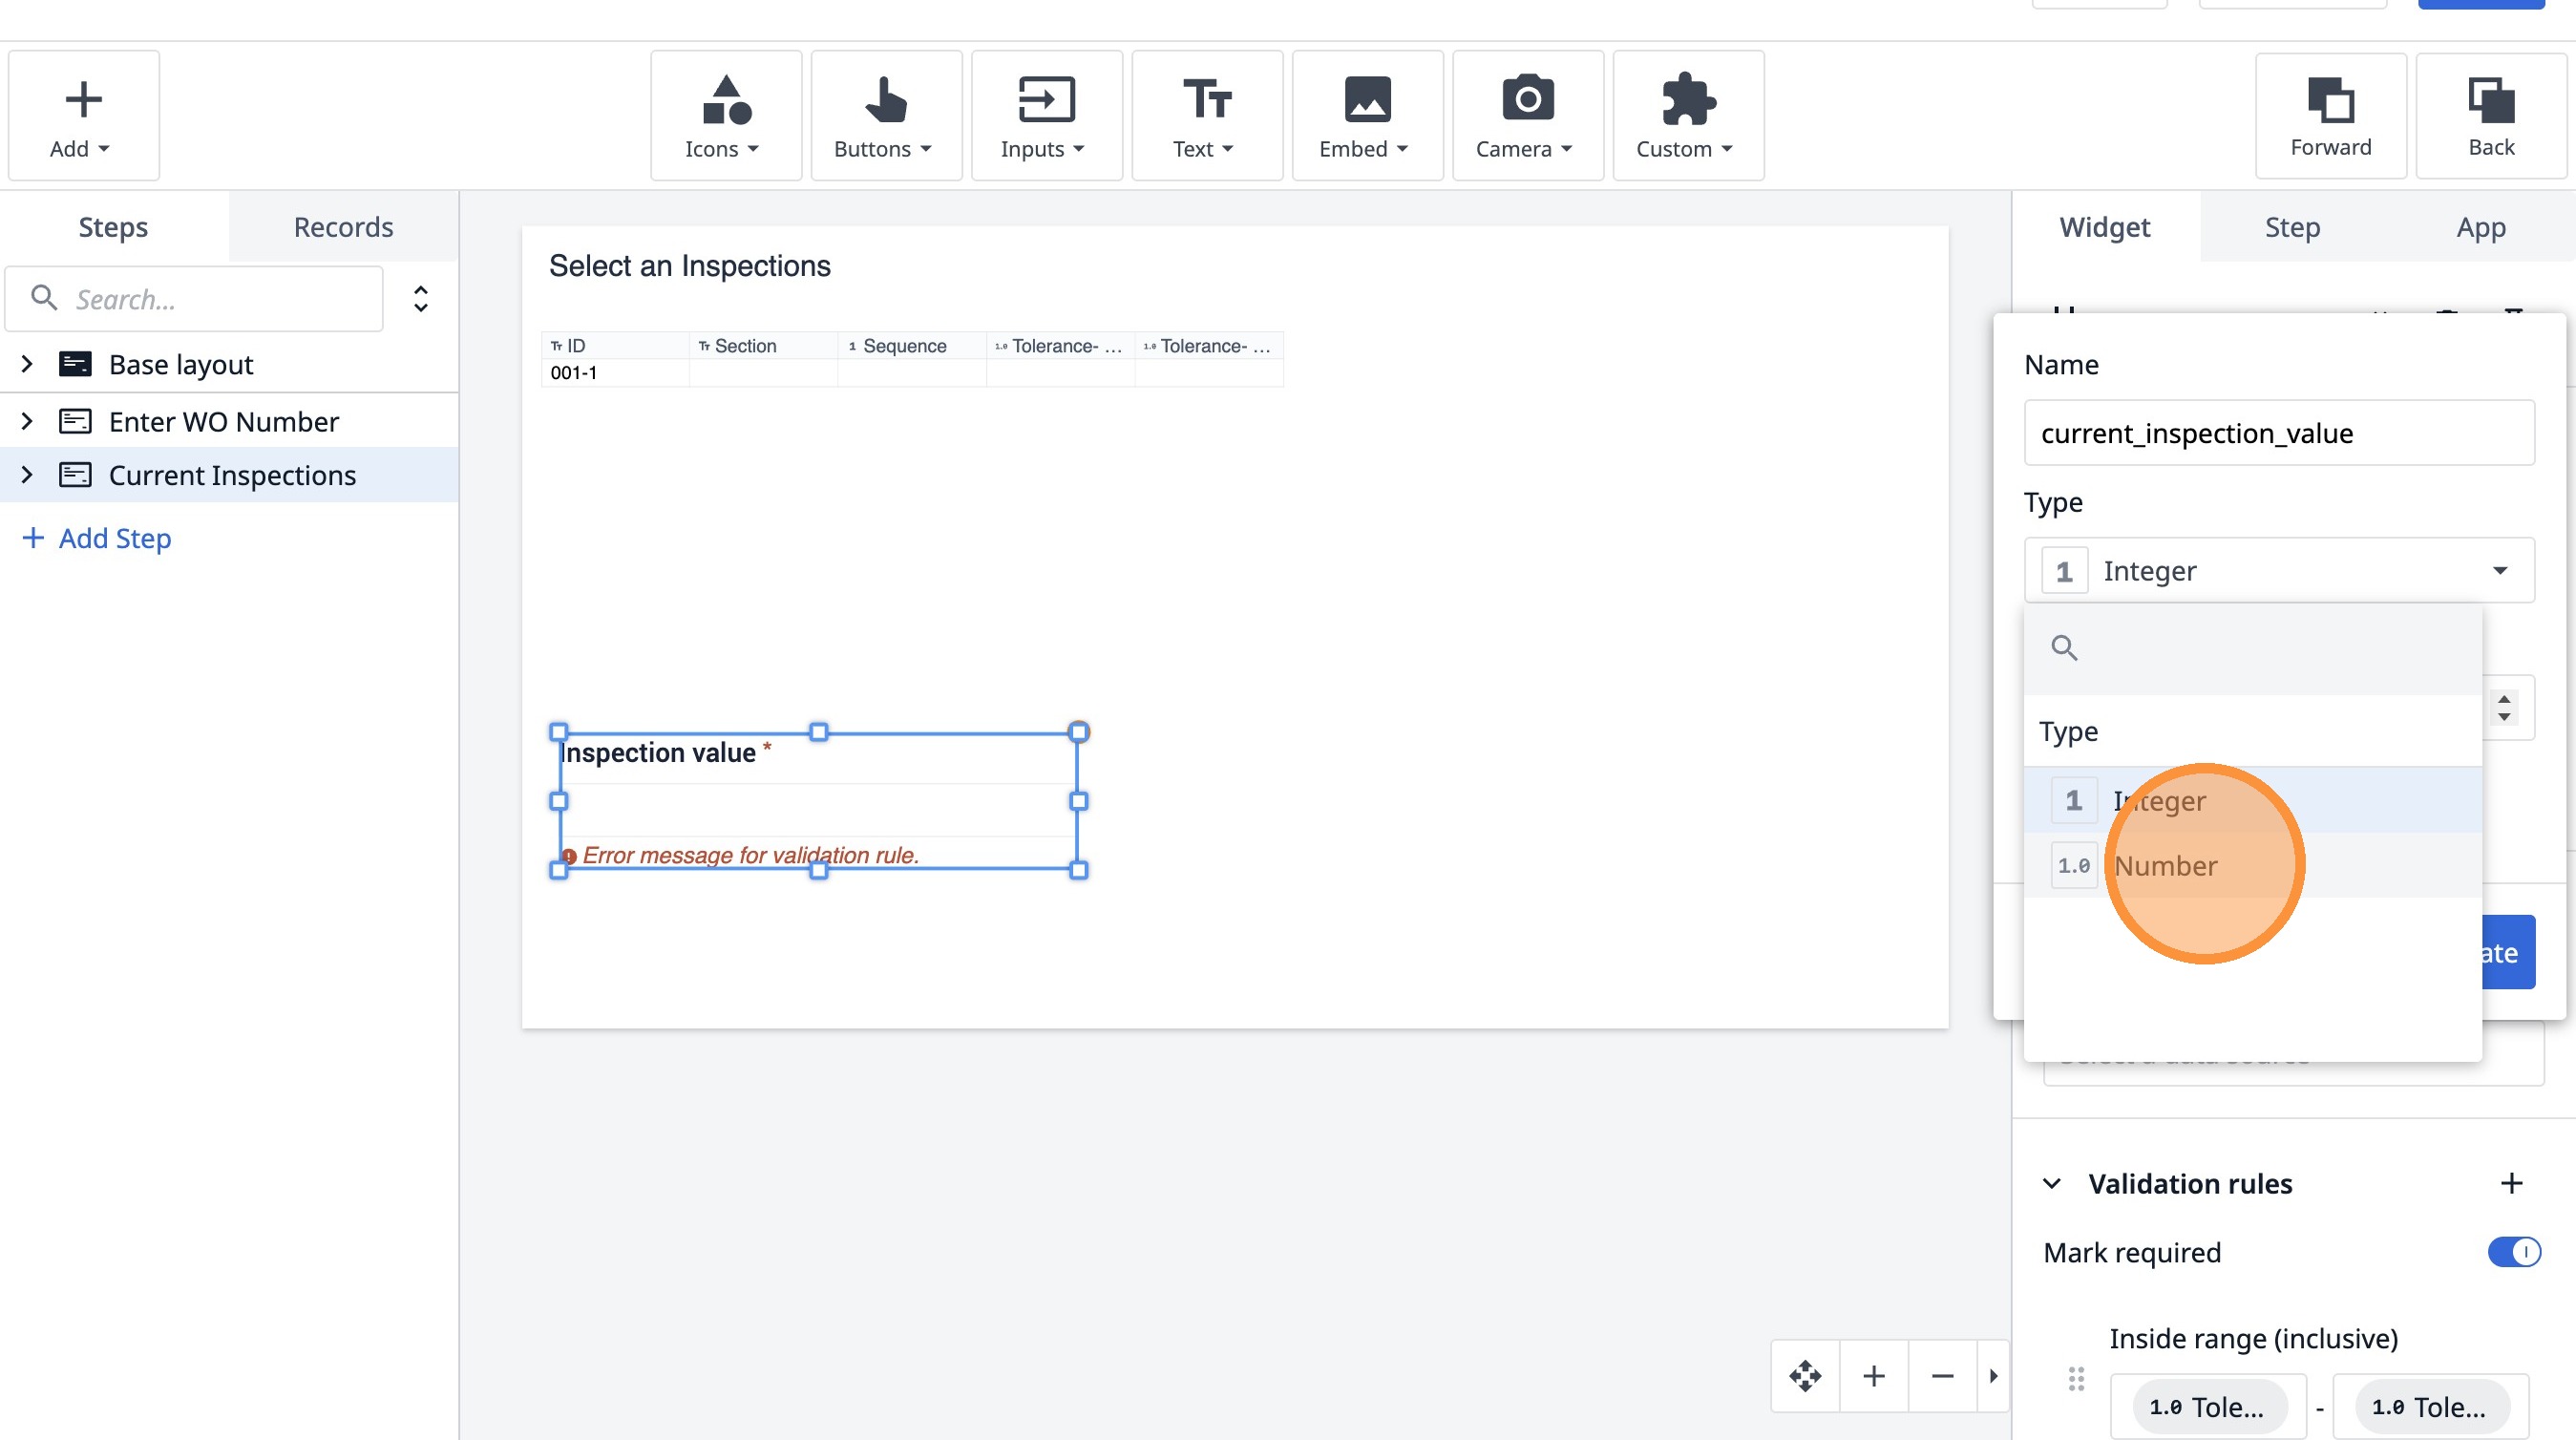
60. Click "Create"