Use the embedded gauge widget to visualize progress towards a maximum value.
There are many ways to view the live status of a variable in Tulip. One way is to use the Gauge visualization. This is a "progress bar" that shows the progress towards a preset maximum value.
Add a gauge widget
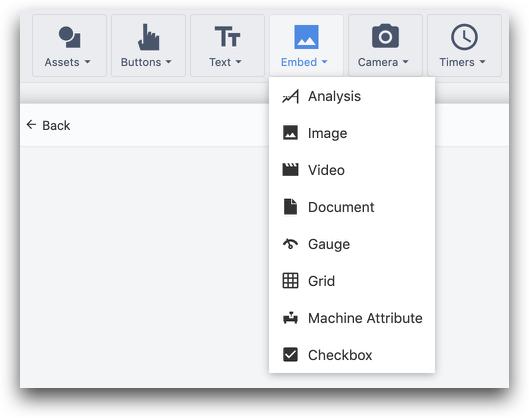
From the Tool Bar, click Embed and then select Gauge.
Customize the gauge widget via the Side Pane.
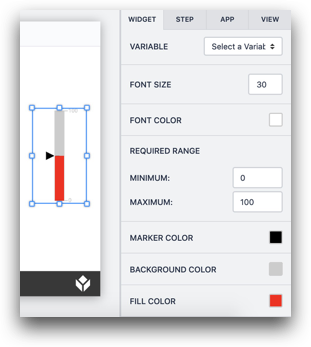
- Variable: choose the number or integer variable that you would like to visualize in this gauge
- Font Size: Change the font size of the labels
- Font Color: Change the font color of the labels
- Minimum: The minimum possible value for the variable
- Maximum: The maximum possible value for the variable
- Marker Color: The color of the marker that shows the current value of the variable.
- Background Color: Color of the space between maximum and minimum values
- Fill Color: Color for the "filled" part of the gauge
Did you find what you were looking for?
You can also head to community.tulip.co to post your question or see if others have faced a similar question!