
Purpose
Learn how to display live machine data in an app via 3 different visualizations
In this article, you will learn...
- How to get a real-time view of machine data in an app
Once you have added a Machine and created an Attribute on the Machines page, you are ready to start tracking real-time machine data.
Many of the concepts in this article are also covered in detail on Tulip University.
How To Add a Machine Widget to an App
There are three widgets that are specifically designed for machine monitoring that can display machine attributes or the status of a machine:
- Machine Attribute
- Machine Status
- Machine Timeline
Common configurations
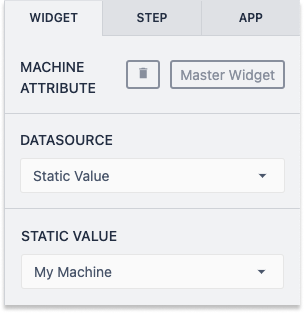
The first step for all machine Widgets is to select a Datasource and Machine. This connects the widgets to a specific machine or a Variable.
- Under Datasource, choose Static Value or Variable. Static Value will allow you to pick a specific machine to display and Variable will allow you to change the machine based on a variable while running an App.
- Depending on your selection in step 1, you can either select from a list of your machines or a list of your machine variables.
Machine Attribute
This Widget allows you to show the current value of a single machine attribute.
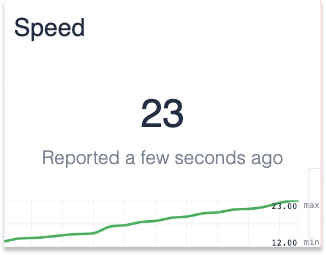
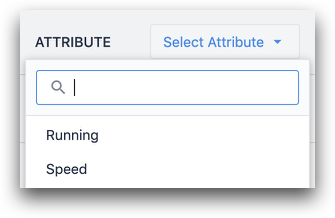
To use, just pick the desired Attribute from the side panel.
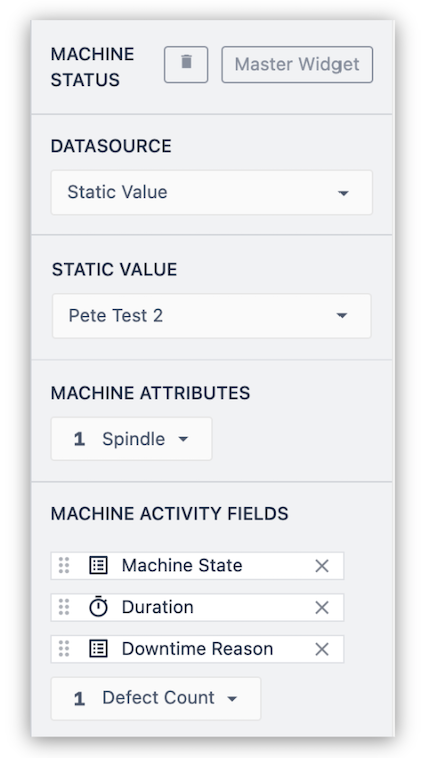
Machine Status
This gives you a live view of the Machine's "state" as well as the last output in any of its attributes.
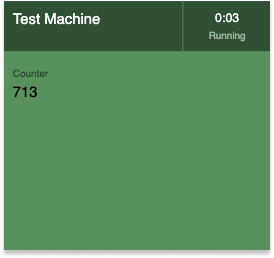
After selecting, you can determine which Machine Activity Fields and Machine Attributes you would like to view on the widget.
Once your Machine Type and Attributes are selected, you can add any Activity History Fields to the widget. Commonly these include a Downtime Reason and Status.
Machine Timeline
The Machine timeline shows the status changes of a machine over a selected period of time.
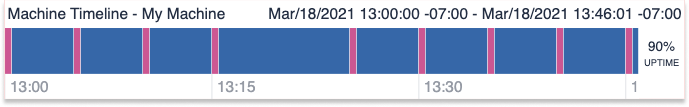
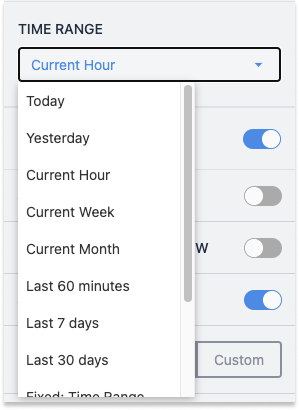
You can choose the time range or set the start and end times manually.
NOTE: only 300 data points will be shown in the timeline. If you choose a time range with more data points than this the timeline will indicate that the limit has been reached.
Additional Configuration Options
You can toggle the following options on the Machine Timeline:
- Show Key
- Show Uptime Percentage
- Show Header
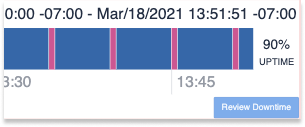
Enable Downtime Review
When this is toggled, a button will appear that allows operators to update the Downtime Reason for any time the machine was down.
Further Reading
Did you find what you were looking for?
You can also head to community.tulip.co to post your question or see if others have faced a similar question!