Using Machine Data in the Analytics Editor
- 27 Aug 2024
- 3 Minutes to read
- Contributors


- Print
Using Machine Data in the Analytics Editor
- Updated on 27 Aug 2024
- 3 Minutes to read
- Contributors
- Print
Article summary
Did you find this summary helpful?
Thank you for your feedback
Using Machine Data in the Analytics Editor
View collected machine data in an Analysis
Make sure that you've set up a Machine and understand the Analytic Editor before jumping into this article.
Machines collect a lot of useful information for the production line. It is important to be able to easily visualize this data. Tulip's Analytics Editor includes pre-configured metrics such as OEE to allow you to quickly analyze machine data.
To set up a Machine Analysis, navigate to the Dashboards tab.
Click to add a new Analysis, then select the Machine option in the modal.
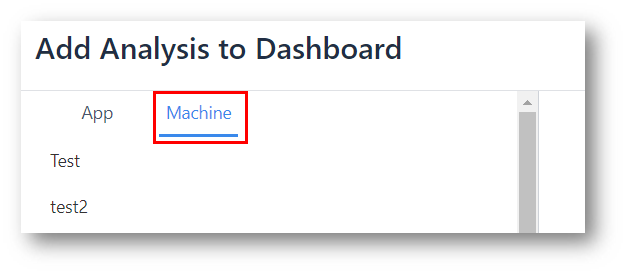
From the list, select the Machine you would like to analyze, and select "Create New Analysis".
Pre-Configured Analysis Options
There are a number of charts to select from that require no additional configuration to start viewing real-time machine data. There are many pre-configured analyses, including:
One Operation
- OEE by hour
- Availability by hour
- Performance by hour
- Quality by hour
- Machine Time per State - displays the average Duration per Machine.
Compare Variables
- State Duration by Machine
Multiple Operations
- Uptime Percentage by Machine
Single Number
- OEE
- Availability
- Performance
- Quality
KPI
- Average State Duration - A single number metric for the average time spent in selected State.
Table
- Duration by Machine and State
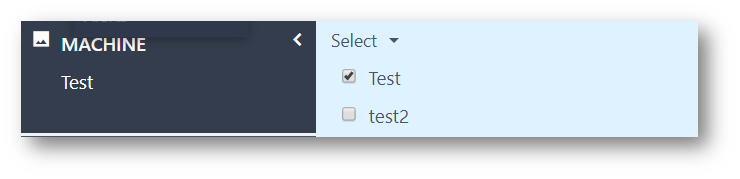
If you select an Analysis that needs to include data from multiple machines, make sure to select all the desired Machines from the Machine field in the top left.
Creating Custom Machine Analytics
You can optionally configure these Analytics entirely from your own expressions as well to display any other metrics you'd like, such as part counts.
To better understand how to do this, check out more information on the Analytics Editor:
Custom Machine Analytics are similar to some of the examples above. However, these Analytics give the option to create analysis based solely on Machine Outputs, rather than app variables.
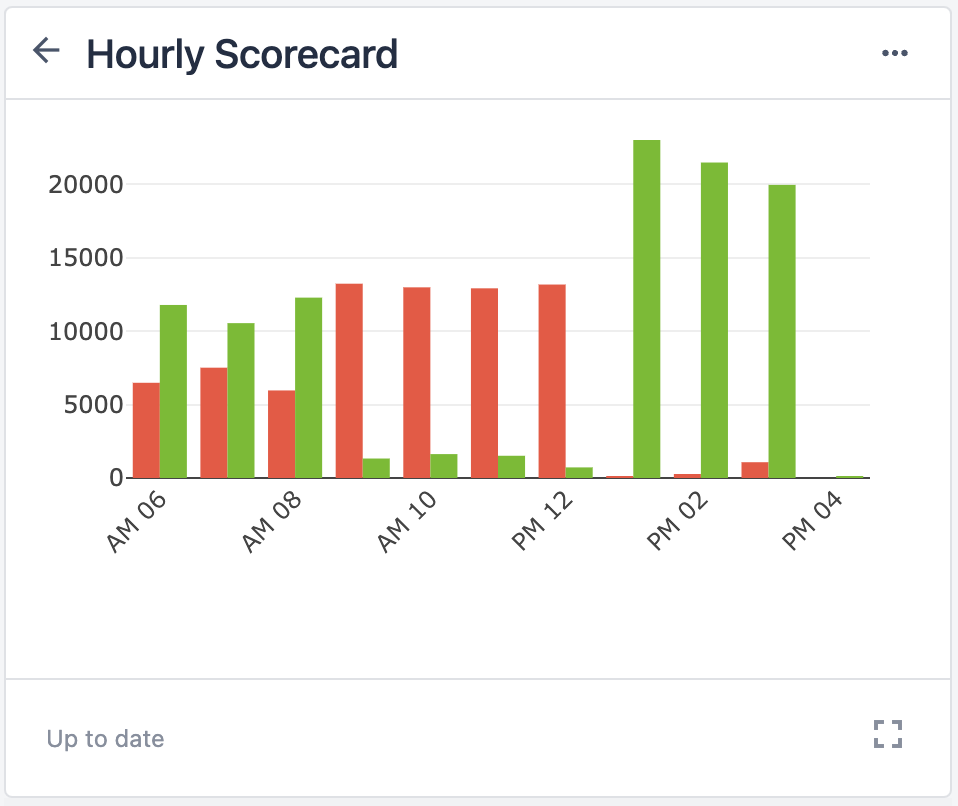
Below will follow an example of creating an analysis for Part Count by Day.
In the Analytics Editor, select an option closest to your desired outcome. In this case, that is likely the One Operation option.
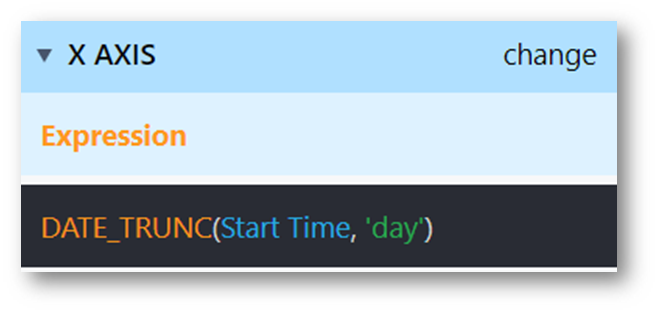
From there, the expressions loaded into the X and Y axis will need to be modified to suit the analysis. The X axis can take on any Machine Field, or any function. For example, the X axis might look like this:
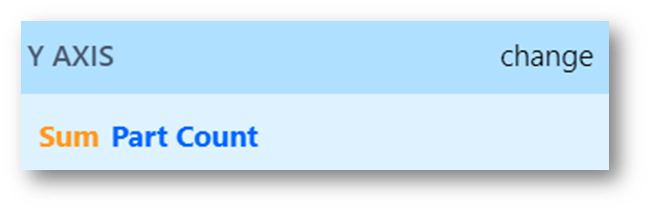
The Y axis can be made dynamically as well. The Y axis can take on Aggregation Functions, Machine Fields, or standard Functions. In this example, the part count is desired for the day, so it is likely best to use the aggregate Sum of the Part Count field.
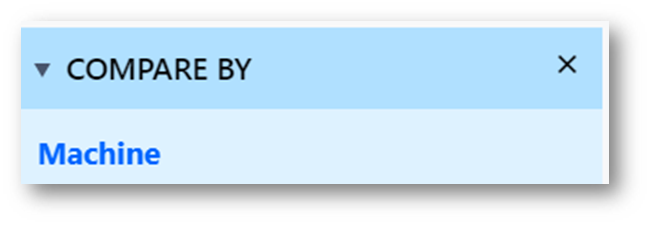
It is also possible to create comparisons by Machine Fields and Functions. In the case of having multiple machines, it is very useful to compare by Machine.
Machine Analytics can create useful dashboards with any Machine Field that collects data from your machines, regardless of which apps the machines might be used in.
Bucketing Data
Analytics data operates off the start time of the event. By default, this means a machine event will store data to the hour that the event began. You can now make machine events that last longer than an hour break into hourly buckets accordingly. In order to turn this option on, contact support at support@tulip.co or via live chat.
Did you find what you were looking for?
You can also head to community.tulip.co to post your question or see if others have faced a similar question!
Was this article helpful?