List of Fields in the Analytics Context Pane
- 17 Nov 2023
- 13 Minutes to read
- Contributors


- Print
List of Fields in the Analytics Context Pane
- Updated on 17 Nov 2023
- 13 Minutes to read
- Contributors
- Print
Article Summary
Share feedback
Thanks for sharing your feedback!
List of Fields in the Analytics Context Pane
A Guide to All the Possible Fields in the Analytics Editor.
Below is a description of all the possible fields that can be selected in Analytics
Aggregation Functions
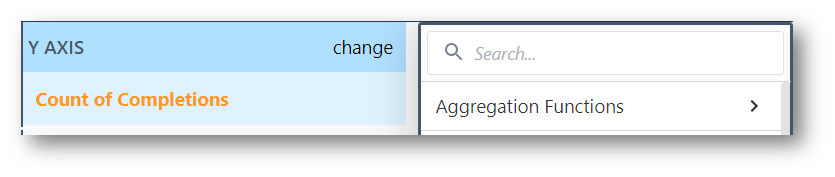
Aggregation Functions denoted with * can also be utilized in Expressions for more complex analyses.
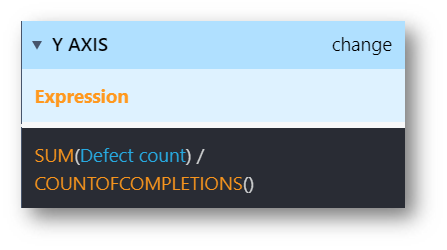
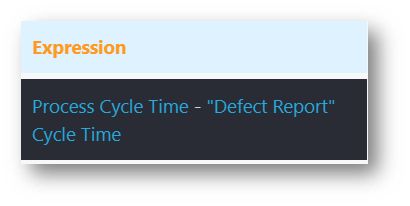
Expression
Separate from the overall expression editor, this expression editor can be used for aggregation functions, and is typically useful in the Y axis.
Example: Finding the total percentage of defective parts from the number of completions.
Count of Completions*
A summation of all the Completions that have successfully run in a given app or apps with the selected criteria. If there is no set criteria, this will return the total number of completions.
Percent of Completions
Percentage of Completions that match a given criteria.
Percent Where True
Frequency that the given criteria is True. Often, this is a good place to check for FPY using a Boolean "Pass/Fail" Variable.
Percent Where False
Frequency that given criteria is False. The is the inverse Percent Where True. Percent Where False added to Percent Where True on the same data set should equal 100%.
Count Where True
Returns the total count of Completions that match a given criteria.
Count Where False
Returns the total count of datapoints that match a given criteria that is False.
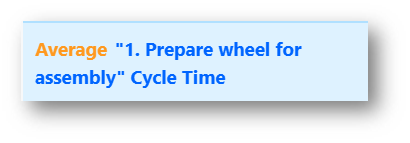
Average*
Gives the average of a number Variable.
Median
Gives the median value of a number value.
Sum*
Provides the summation for a Variable. For more complex and conditional sum statements, SUM() can be used as a function in the Expression Editor.
Minimum*
Returns the minimum historical value of a given Variable or Table Record Field.
Maximum*
Returns the maximum historical value of a given variable or Table Record Field.
Mode
Returns the most frequent value of a given Variable or Table Record Field.
Standard Deviation
Returns the standard deviation of a number Variable or Expression, categorized by the X axis.
95th Percentile
Returns the 95th percentile of a numerical data set. This value means that 95% of the values are below this number.
5th Percentile
Returns the 5th percentile of a numerical data set. This value means that only 5% of the values are below this number.
Ratio
Returns the ratio of one number Variable or Expression to another. This takes in two number variables (or expressions), where the first acts as the numerator, and the second as the denominator.
Ratio Complement
Similar to ratio, but takes in two conditions of any type. These conditions may be set when one variable or field is equal to a given condition. It may also be a number variable or an expression. This also takes the first argument as a numerator, and the second as a denominator.
Fields
Fields are best used as an X axis, or something to Compare By in analyses. This article has some more information on Fields.
NOTE
Not all of this data is available for Table Data analyses. Each field used in sorting must be added to a column in your Table to be accessable in analyses.
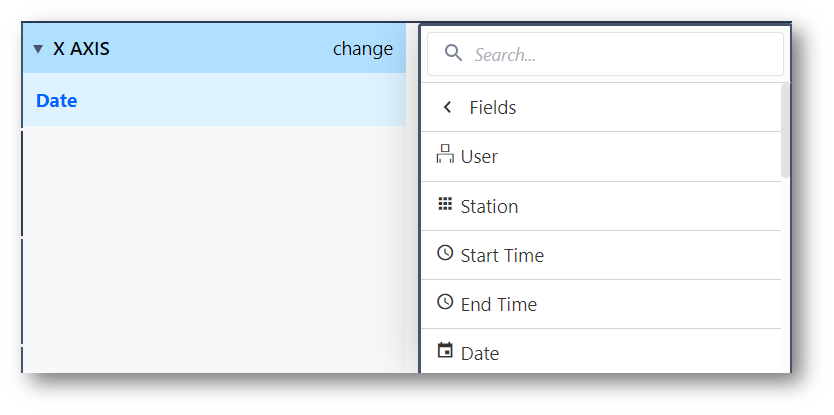
User
The logged in user who Completed the app.
Badge ID
Similar to User, but gives the assigned Badge ID instead of the name.
Station
Which station the app completed at.
Start Time
When the app began working towards a completion.
End Time
When the app completed.
Week
Groups app completions by the week they completed. Useful for viewing aggregations on a week-by-week basis.
Month
Groups app completions by month.
Year
Groups app completions by year.
Shift Type
Categorizes data by the Shift Type worked. Only applicable to Enterprise Accounts.
Shift Duration
Displays or categorizes the duration of the Shift Type. Only applicable to Enterprise Accounts.
Is Working Day
Categorizes completions by the status of being a scheduled workday or not. Only applicable to Enterprise Accounts.
Day of Week
Categorizes completion data by the day of the week. This will aggregate matching days. For example, if given an All Time range, the analysis will stack all Monday values together.
Hour of Day
Categorizes completion data by hour of the day. Aggregates similarly to Day of Week.
Hour
Distills all data to the hour it was completed. This field gives all historical data by hour, and is not aggregated like Hour of Day.
Process Cycle Time
Displays the overall runtime of the App completion.
App
Categorizes data by which app the data came from. Applicable only to analyzing data from multiple apps.
App Version
Groups app data by the Version of the App ran to create the Completion.
Table Records
Here, you can select any table field that is used within the app in the analysis. For more detailed information, check out this article on Table Analyses.
App Variables
A list of all app variables used within the target app can be found here.
App Steps
All Steps within the app are listed here, in the form of cycle time spent on the steps.
Example 1: find the average time spent on a given step.
Example 2: filter out undesired step times from Process Cycle Time.
App Forms
Provides a list of all the fields used within application form steps.
This includes the Signature Form. This is named based on the label of the signature widget within the Signature Form Step. You can use this field as the "X Axis" to show all operators that have signed via the Signature Form, for example.
Functions
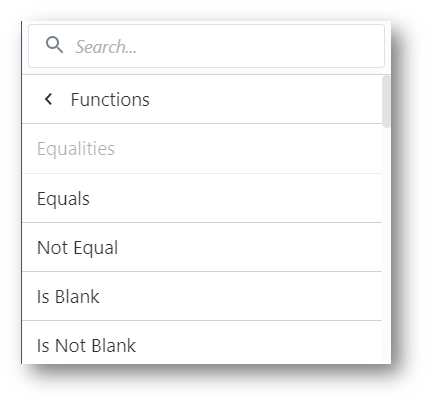
Functions vary slightly in each place used. The entries for variables and expressions may differ slightly when used in the X-axis, Y-axis, or Compare By fields. The following will outline what each function does.
Equals
Checks for equivalency between a Variable or Table Record Field or expression to a given state or value.
Not Equal
Checks that a Variable or Table Record Field or expression is not equivalent to a given state or value.
Is Blank
Checks for completions where the given variable is blank.
Is Not Blank
Checks for completions where the given variable has a value.
Not
Not acts as a modifier to use another Function. It will check for completions where the inverse of the given Function(s) is satisfied.
And
And is another modifier which allows for multiple Functions to be checked, and returns completions where both statements are satisfied.
Or
Or is a third modifier which allows for multiple functions, and returns completions where any of them are satisfied.
Greater Than
Checks that a numeric value is greater than a given value or expression.
Greater Than Or Equal To
Checks that a numeric value is greater than or equal to a given value or expression.
Less Than
Checks that a numeric value is less than a given value or expression.
Less Than or Equal To
Checks that a numeric value is less than or equal to a given value or expression.
In Last N Working Days
Checks completions that were in the previous N days. Working days are set on a default, unless defined by Schedules (Enterprise Accounts).
Expression
Expression allows use of the Expression Editor to write custom expressions. For more detail, read about using the Expression Editor in Analytics
Bins
Allows binned separation of a numeric value. This allows a histogram to be made in any number of bucketed value ranges with a selected minimum and maximum range.
Link Fields
Returns the data of the first Variable or Table Record Field unless it is null. In that case, the second given variable is returned.
Length Of
On the X-axis, groups completions by the length of a variable in digits. On the Y axis, can be used with an aggregation function to check a given length.
Starts With
Checks that a Variable or Table Record Field begins with a given value.
Ends With
Checks that a Variable or Table Record Field ends with a given value.
Contains
Checks a Variable or Table Record Field contains a given value.
Is Exactly
Checks that a Variable or Table Record Field matches completely with a given value.
Is Not Exactly
Checks that a Variable or Table Record Field is anything other than a perfect match to a given value.
Contains All Of
Not yet released. Checks that the contents of a variable matches the given value anywhere.
Example - Variable value 'ABCDE' contains all of 'BCD'
Does Not Contain All Of
Not yet released. Checks that a variable's contents do not match the given value anywhere.
Further Reading
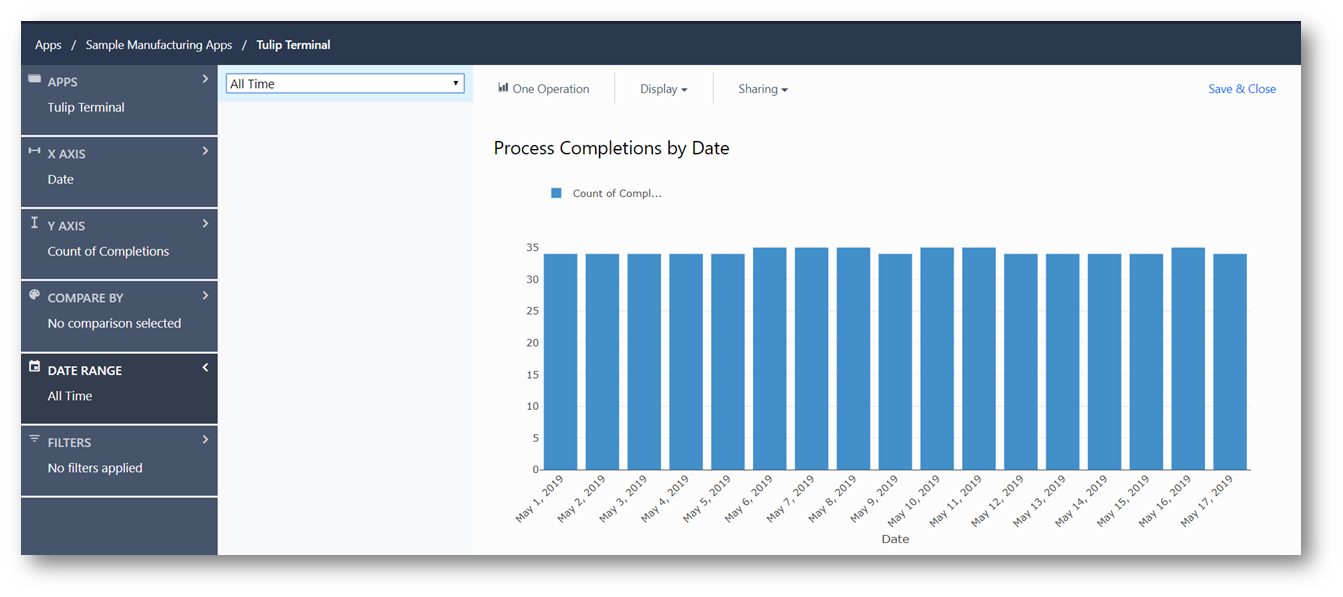
To better understand these functions, try playing around with sample data. The Tulip Terminal app in each instance has sample data to use. Make sure to filter the analysis to All Time to test the analysis' data.
Did you find what you were looking for?
You can also head to community.tulip.co to post your question or see if others have faced a similar question!
.gif)
Was this article helpful?