To download the app, visit: Library
Scopo
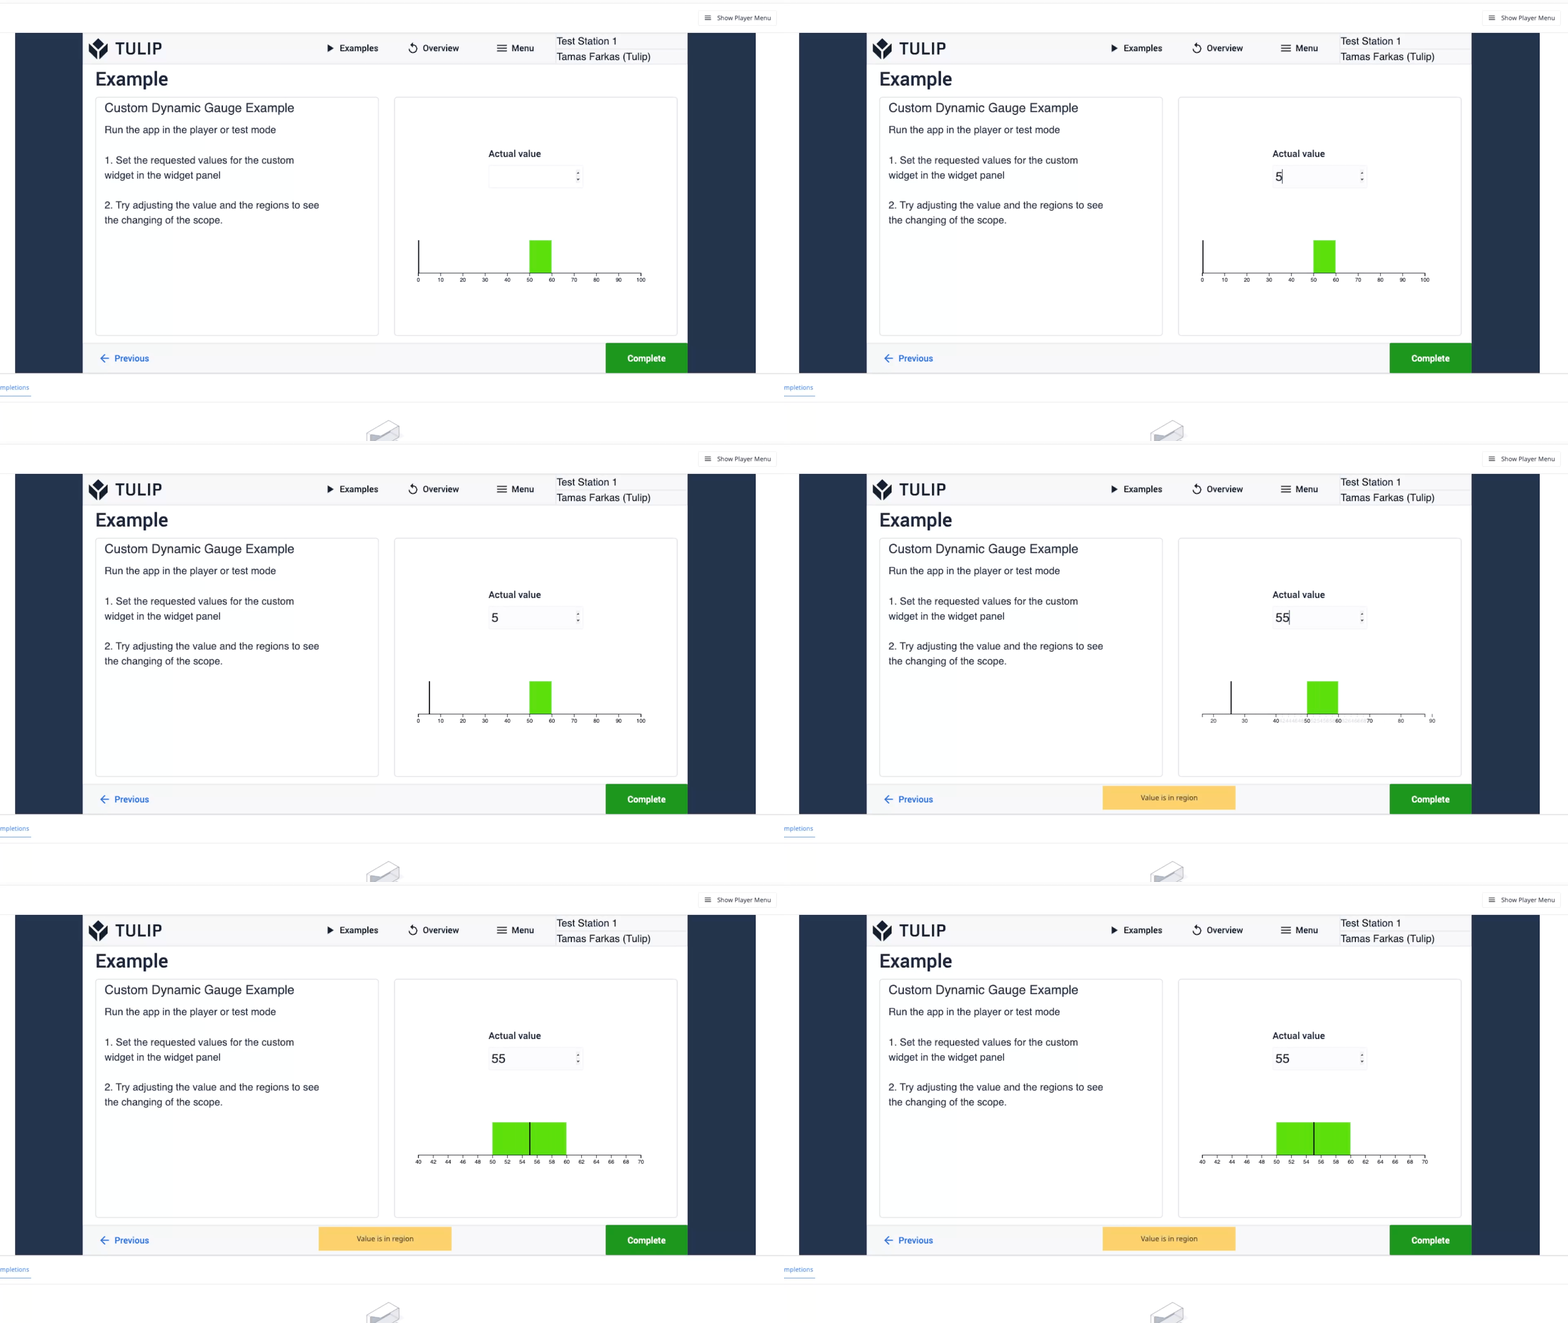
Lo scopo di questo widget personalizzato è quello di consentire agli utenti di visualizzare facilmente i valori all'interno di una scala. L'indicatore regola dinamicamente la sua portata man mano che il valore si avvicina all'area specificata.
Configurazione
Il widget ha i seguenti parametri da impostare:- Valore: È possibile selezionare la fonte del valore effettivo che il widget visualizza.- Valore minimo: Impostare questo valore per definire il punto più basso della scala: Impostare questo valore per definire il massimo della scala.- Limite inferiore: definisce il punto inferiore dell'intervallo di accettazione nella scala.- Limite superiore: definisce il punto superiore dell'intervallo di accettazione nella scala.- Regione: Imposta il colore dell'intervallo di accettazione**.Trigger:**- Errore: Questi trigger si attivano se il valore effettivo supera i limiti definiti.- Stato: Questi trigger si attivano se il valore effettivo rimane entro i limiti definiti.
Come funziona
Il widget prende automaticamente il valore reale e lo visualizza sulla scala. Se il valore effettivo è vicino al limite definito, la scala viene automaticamente ingrandita in questa regione per fornire una rappresentazione più accurata e dettagliata del valore all'interno della scala.

Ulteriori informazioni
Se desiderate saperne di più sui widget personalizzati, visitate il sito sottostante:
