Learn how to download Tulip data based on an individual App or Analysis.
There are two types of data you can export:
- App data
- Databased on Analytics you’ve previously created
Export app data
-
To export app data, open the App Summary View of an app.
-
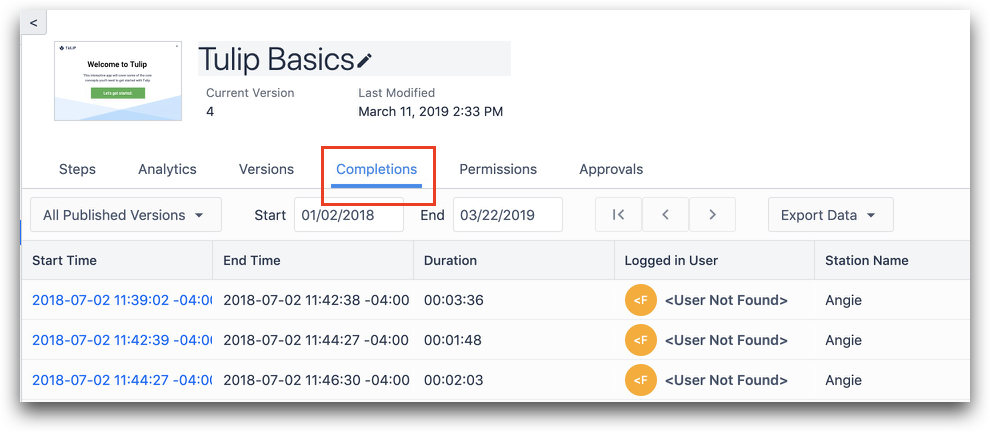
Click the Completions tab.
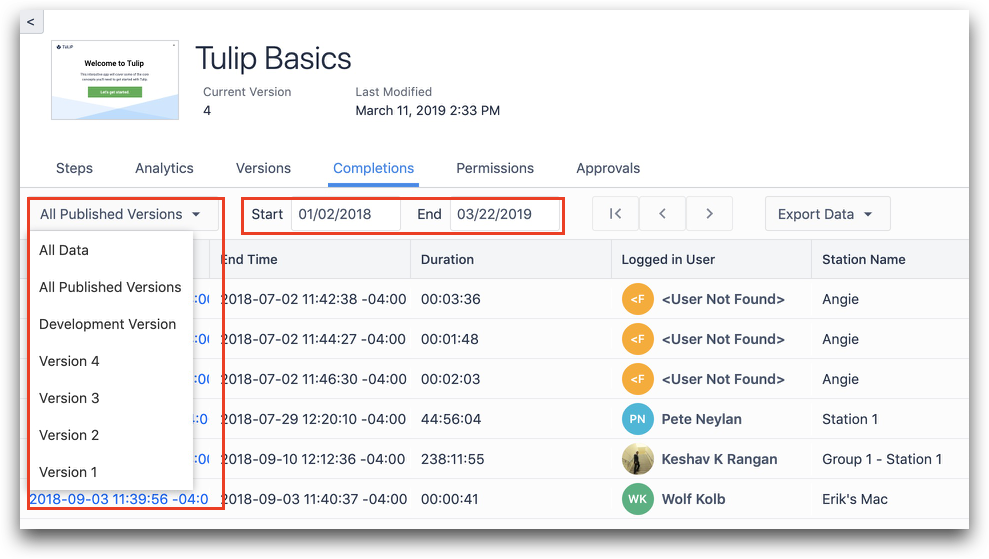
- Choose the app Version and the time frame of the information that you would like to export.
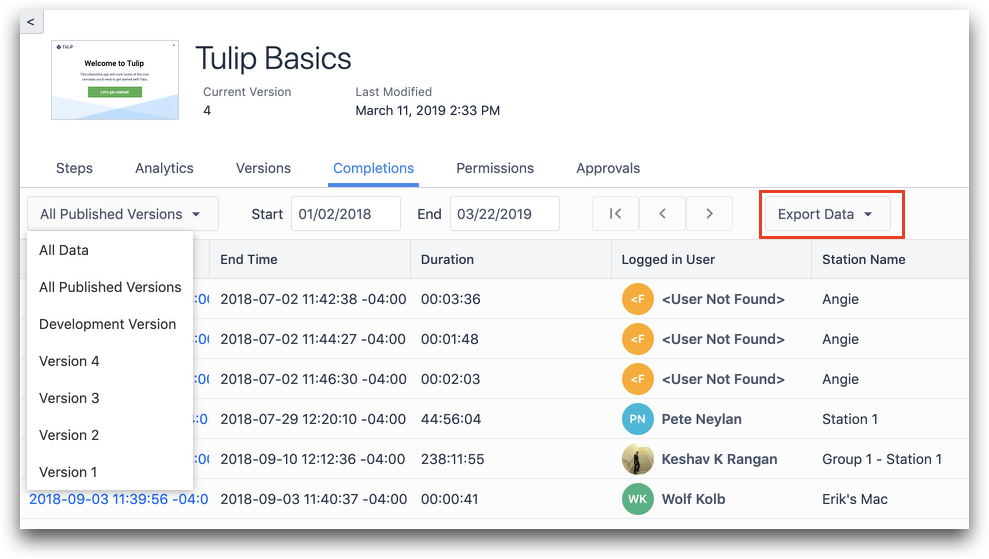
- Click Export Data. The data will be organized by app completion.
Export app data by step
You can see individual app Completions to see app usage by Step.
- Click the timestamp of an individual app completion on the list.
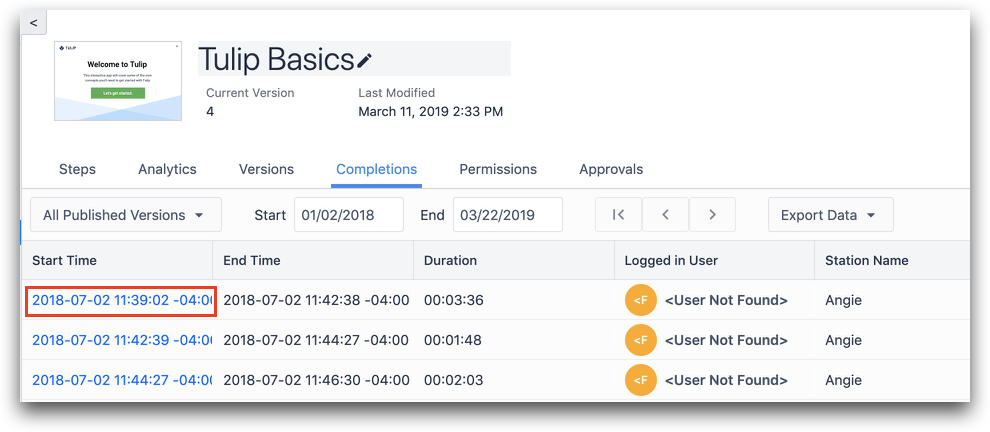
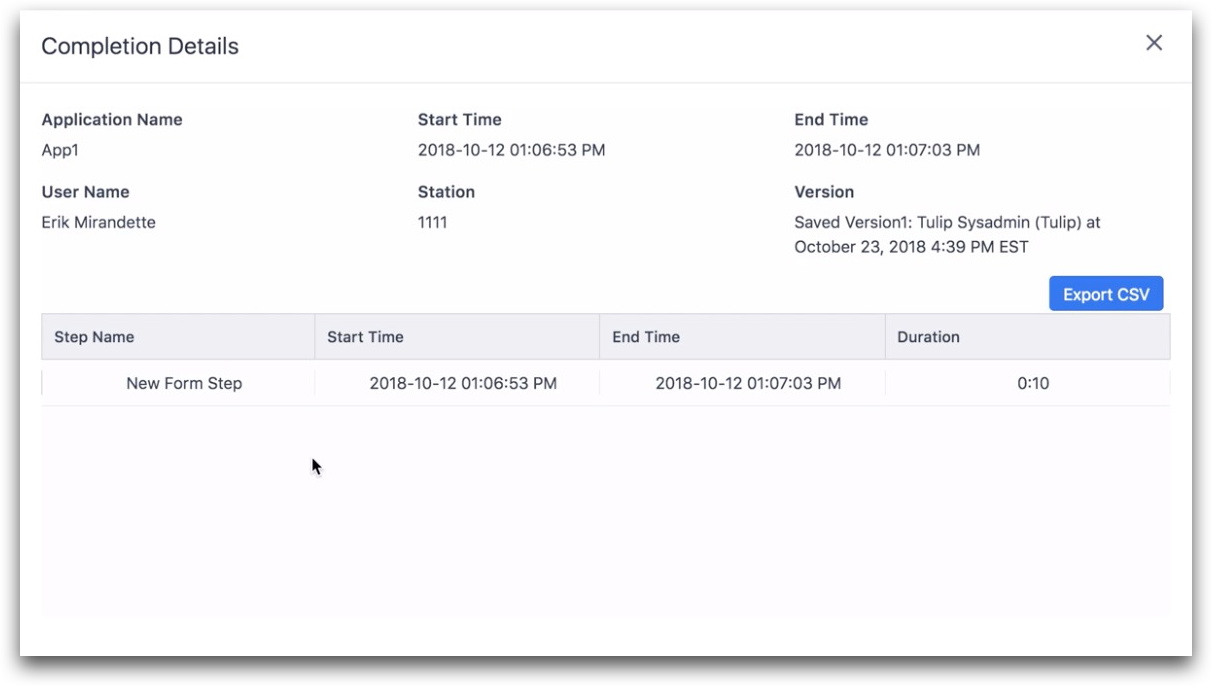
You can now see data per app step for that completion.
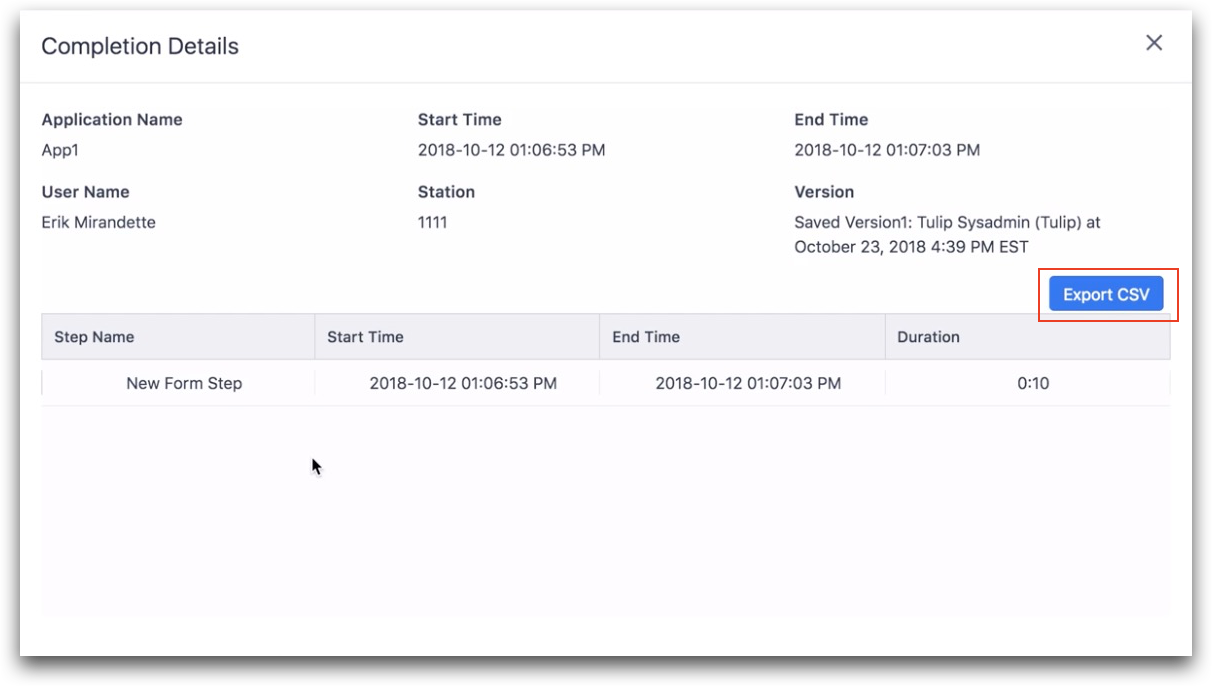
- Click Export CSV.
Export data from analysis
To export data from an Analysis, you need to create a Table analysis.
-
To export data from an existing table, open the analysis in the Analytics Editor.
-
Click Export CSV.
Did you find what you were looking for?
You can also head to community.tulip.co to post your question or see if others have solved a similar topic!
Analytics
Analytics are live updating graphs and metrics calculated based on app data, Table data, and machine data. Analytics can be embedded and dynamically filtered within an application.
Published Version
The Published Version of a Tulip app is a complete version of your Application. When an app is ready to be run in production, its logic can be frozen by Publishing that app. One application can have multiple published versions. If a Station is assigned to run the Published version of an application, it will only see changes when they are published.
App Completion
App Completions are a mechanism to store immutable data from a Tulip app. When an app is completed, all Variable's current values will be stored in the app completions tab. This completion data can be analyzed in Analytics.
By default, after a Completion users will be brought back to the Begin Screen of your application. This behavior can be adjusted with other Transition types.
Step
A view your users will see within an application. Steps can be viewed chronologically or in whatever order best fits your process.
Steps can be grouped into Step Groups to manage and organize your app Steps.
Analysis
An analysis is a live updating combination of a data query and a visualisation. It allows to show metrics based on app completion data, Tulip Table data, or machine data. Analyses can be embedded and dynamically filtered within apps, placed on dashboards and shared via a direct link
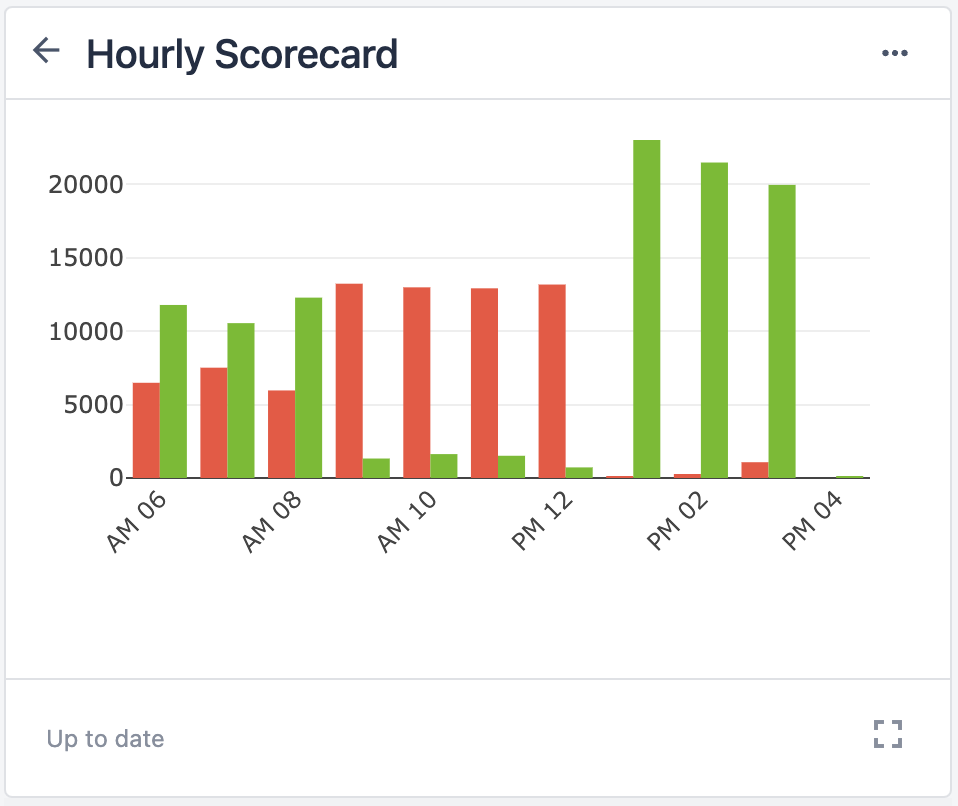
Example - Bar chart