What are Analyses?
- 10 Apr 2024
- 1 Minute to read
- Contributors


- Print
What are Analyses?
- Updated on 10 Apr 2024
- 1 Minute to read
- Contributors
- Print
Article summary
Did you find this summary helpful?
Thank you for your feedback
Overview
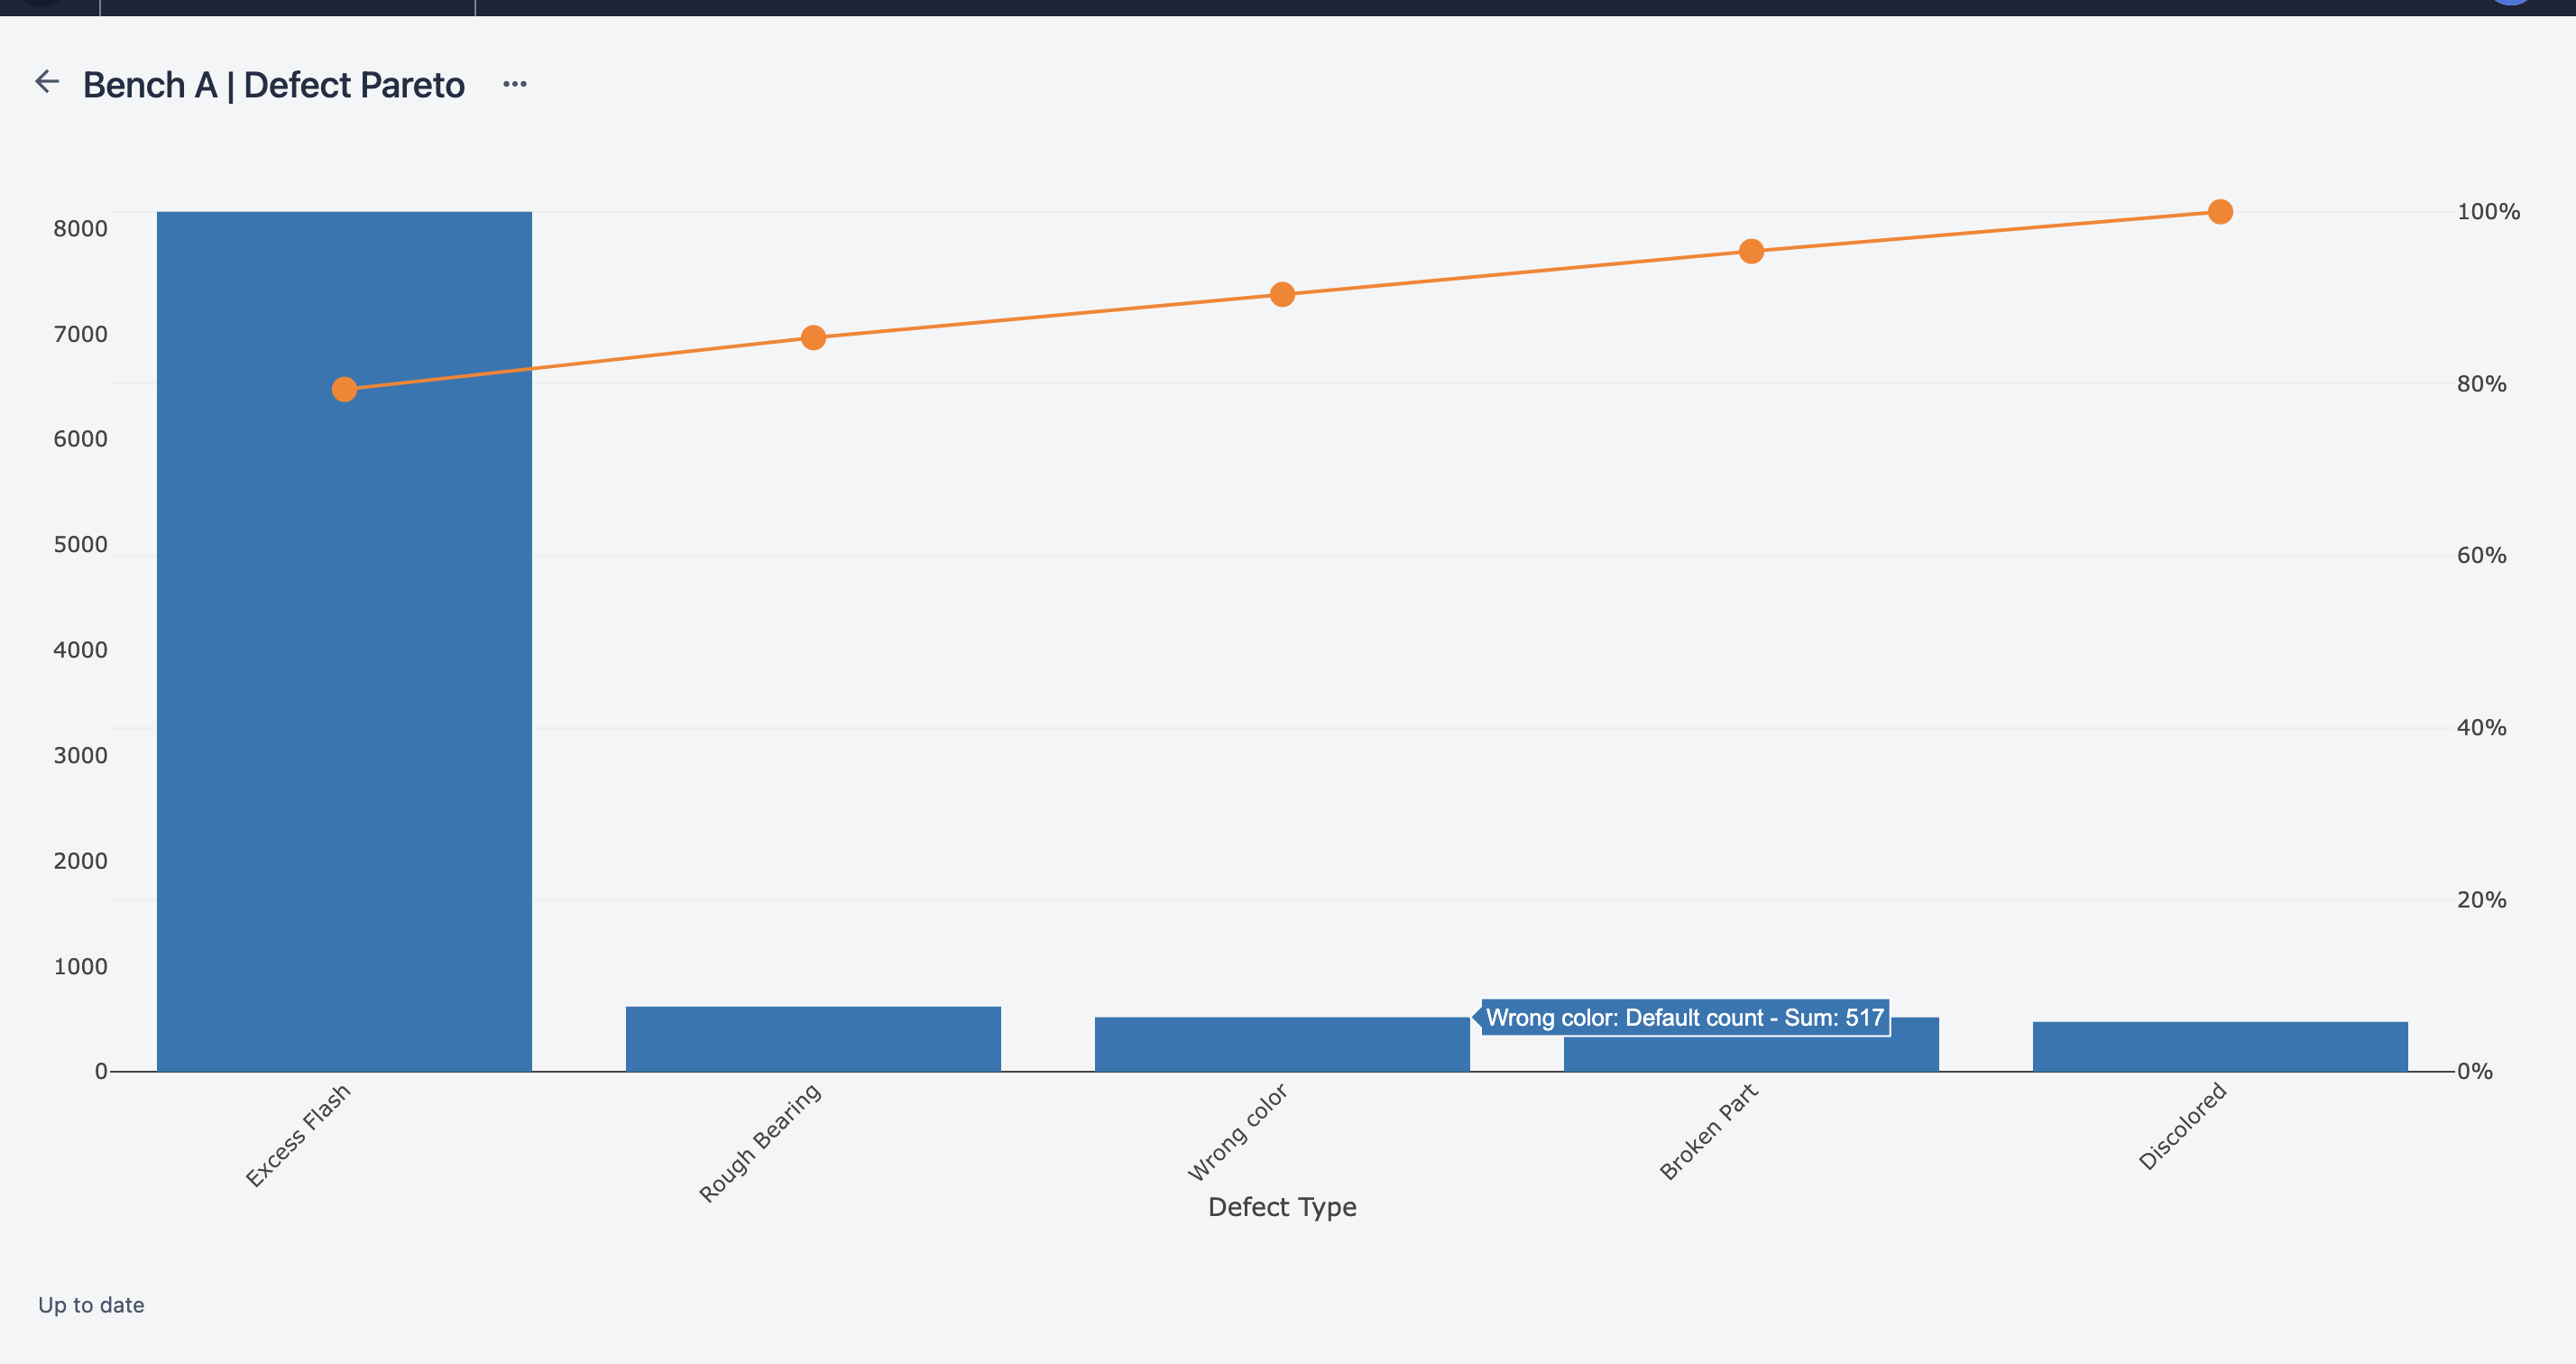
Analyses are dynamic visualizations of the data that your operations create. Leveraging analyses can enable KPI-driving improvements within minutes, instead of days of weeks.
Analyses can drive insights from all the different data sources in Tulip:
- App Completions
- Table Data
- Machine Data
Analyses automatically update so the insights just keep coming!
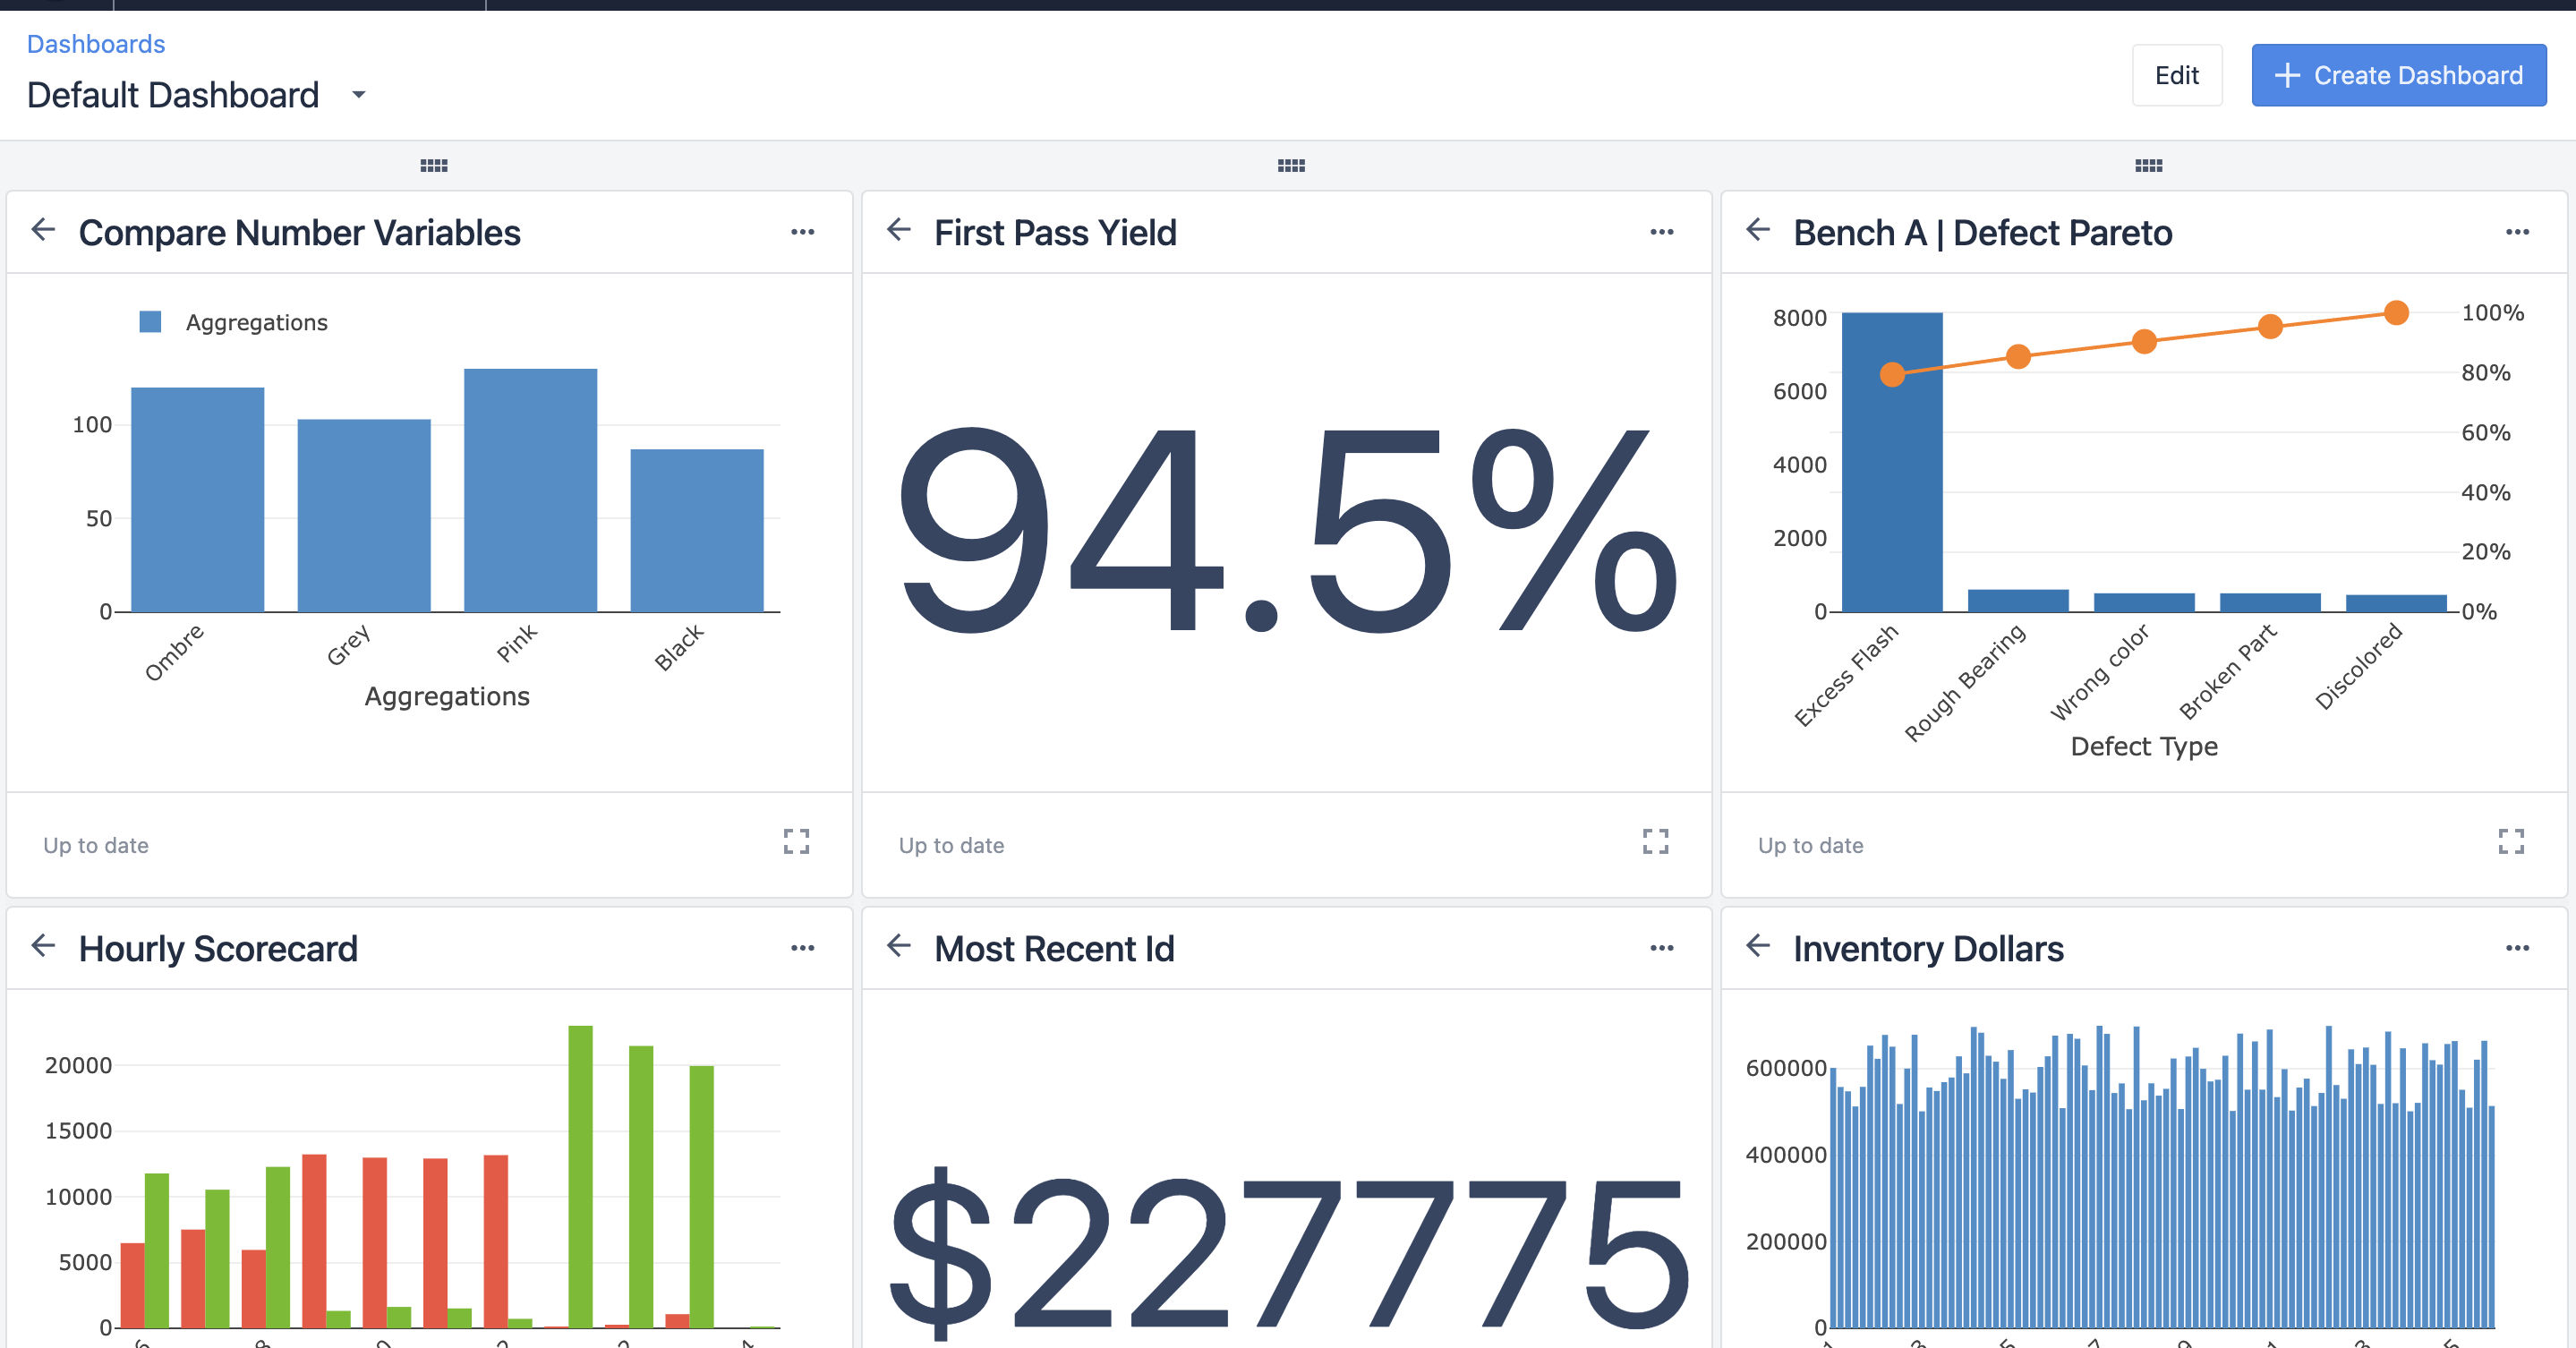
Dashboards
Dashboards are groupings of analyses. Often one metric doesn't represent success or failure, but instead a group of analyses are needed to illuminate your process performance.
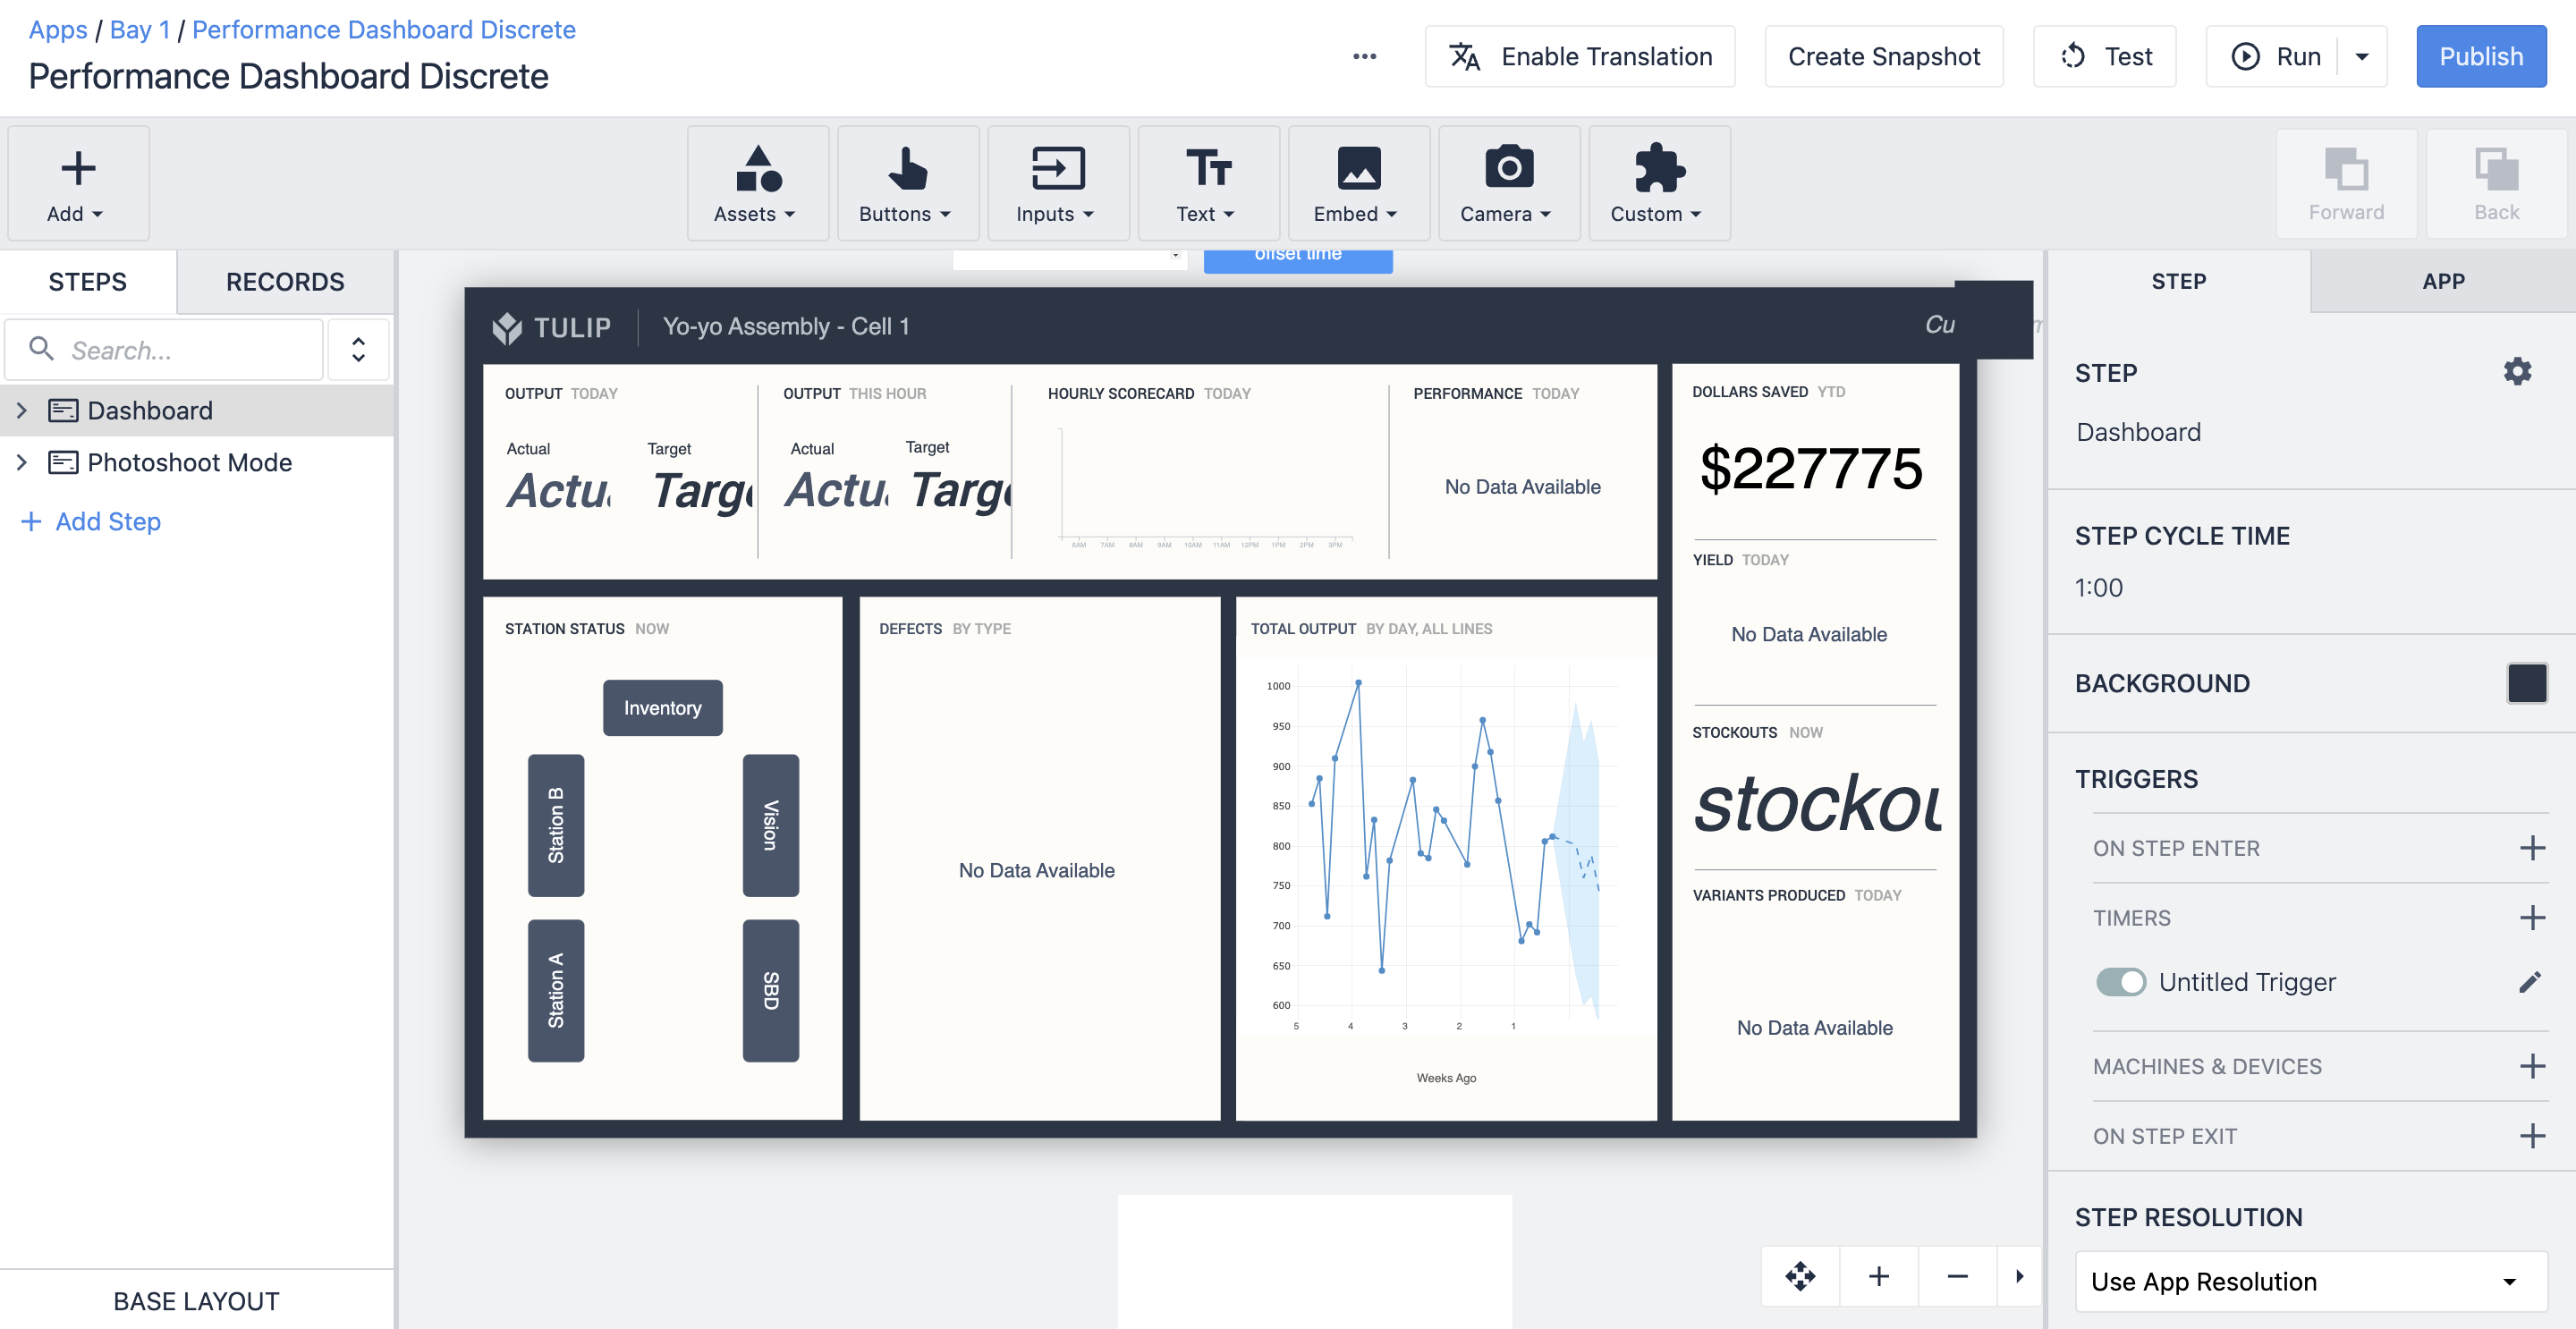
Apps
Anaytics can also be embedded within applications to further the discoveries for your operators. Game-ify your operations with displaying for your users, the metrics they are being expected to maintain.
Embedded Anaytics further enrich the Tulip experience by enabling dynamic filtering of the data that matters for your operators.
Further Reading
.gif)
Was this article helpful?