Purpose
Get up to speed in minutes collecting data with the simple data logging app.
This article walks through the Simple Data Logging App installed in every new Tulip instance. This app is just a starting point for what you can build with Tulip!
Before digging into this app, check into Using Tables and Using Triggers Those two apps walk through the two key components the simple data logging app uses.
How This App Works
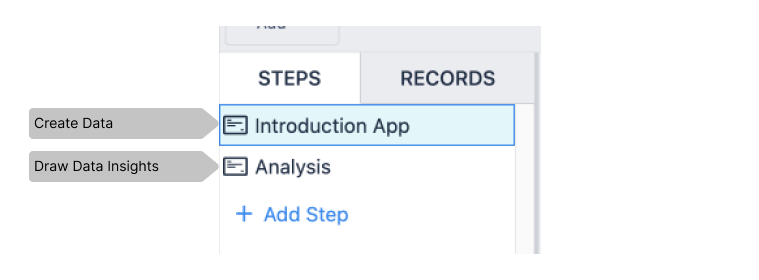
This app is split into two steps. Steps can be though as different views a user might see. In this case we have 2 steps, Introduction App is a step where the user can create new data entries. On the Analysis step users can see basic analytics that will automatically updated with insights about your data.
Introduction App Step
All of the logic for this app is on the Trigger on the SAVE DATA button. Open it by selecting the button, then the pencil next to the "Save Data to Table and App Log" Trigger.
NOTE: The SAVE DATA button must be selected to see its triggers.
This trigger does a few things...
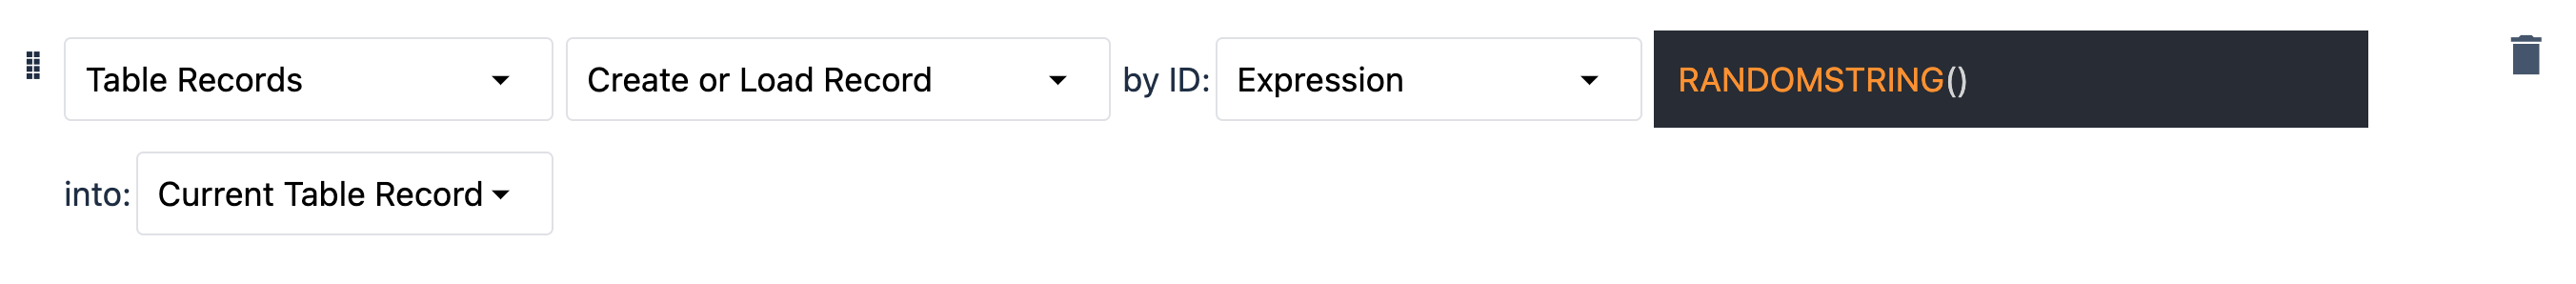
- Create a new record in the Simple Data Logging Table. In this case the unique ID for our record is going to be a random string. This new record is assigned to our Current Table Record placeholder. Having this record in our placeholder will allow us to update fields in it in future steps.
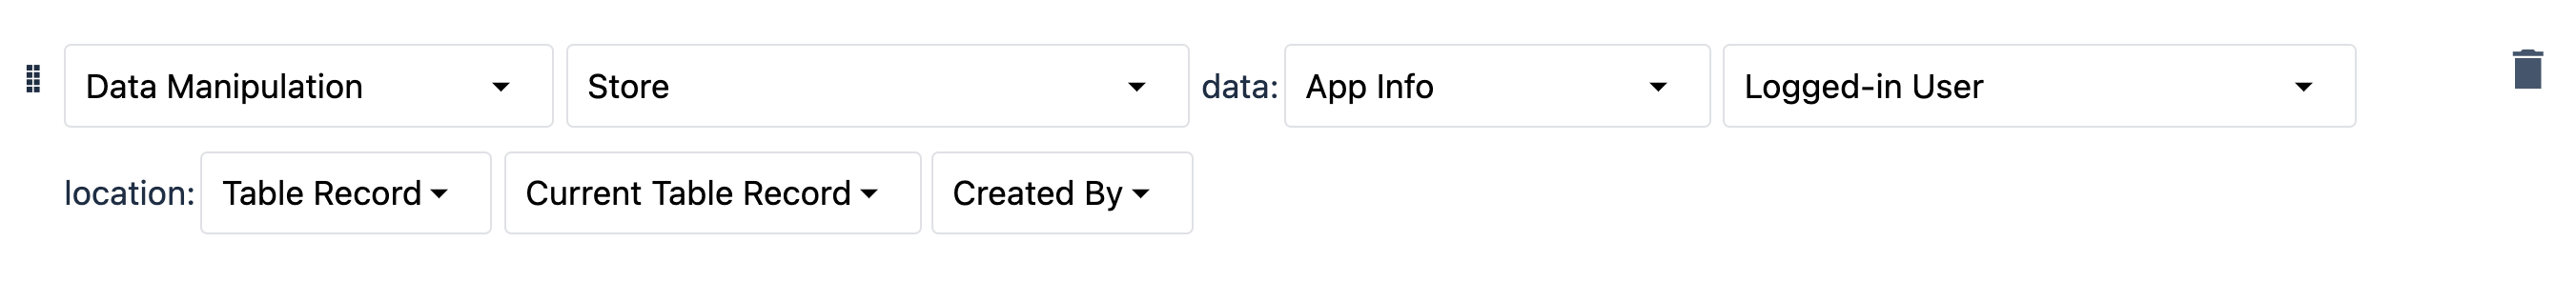
- Store the user who is currently logged into your app to the Created by field in the Current Table Record placeholder. Remember, this placeholder represents the row in our table, so adjusting its value will adjust our table.
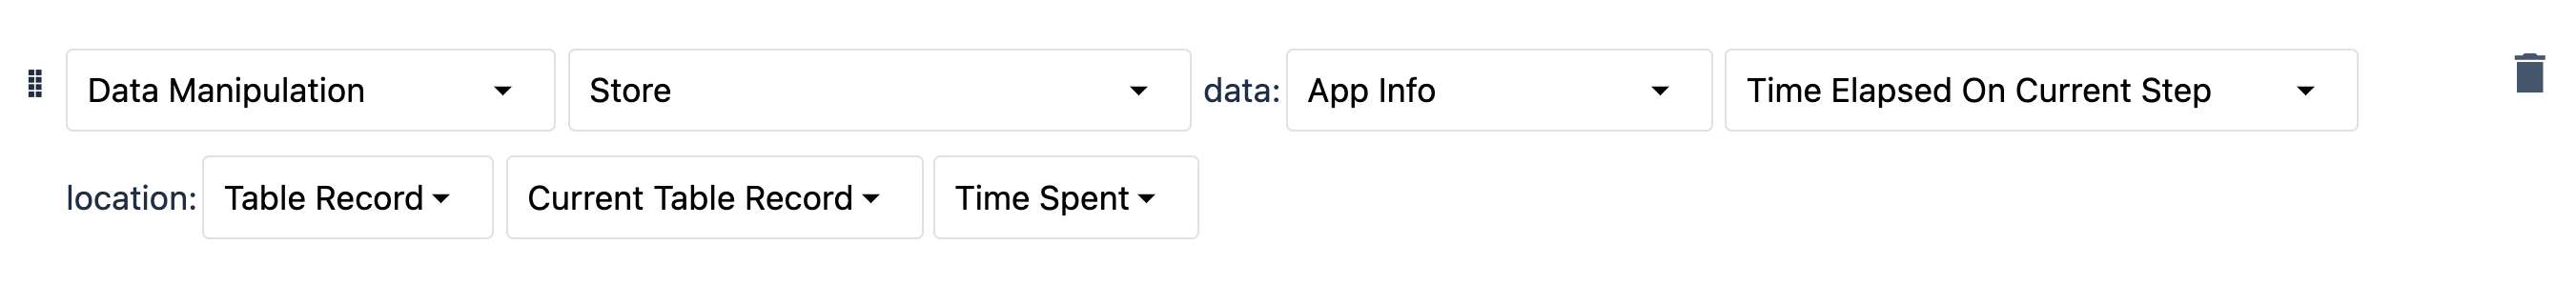
- Next, We store the amount of time the user has spent on this step to the Time Spent field in our placeholder, again this will update our table field.
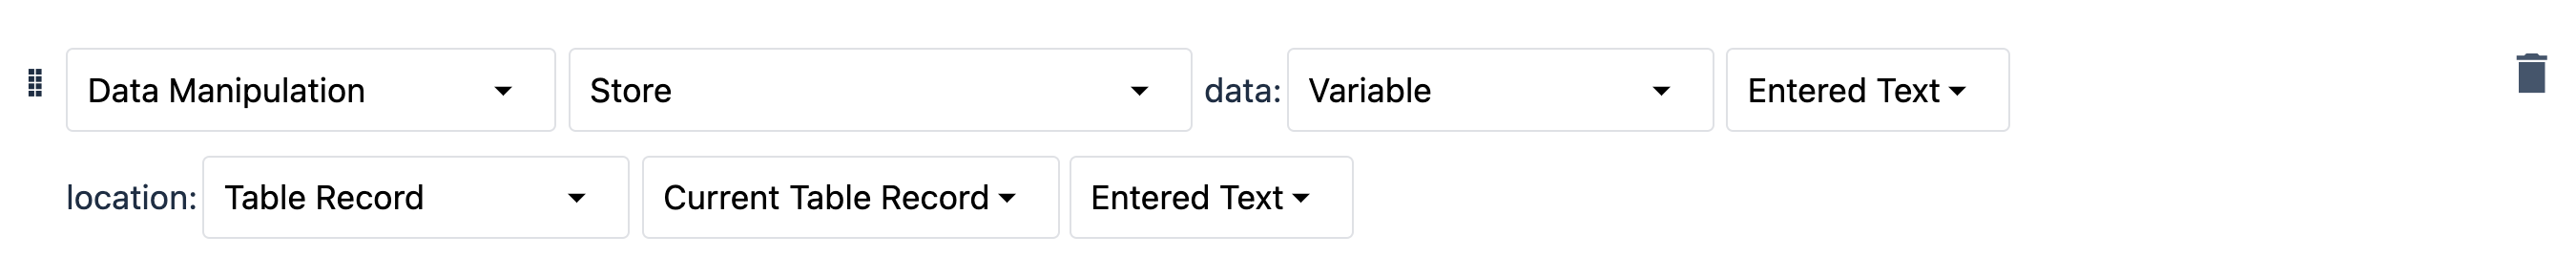
- We store the text the user entered into the Entered Text field in our table.
- Finally, we save all app data. This will reset the timer for how long a user has spent on this step without changing what step they are on. More information on App completions available here

Analysis App Step
This dashboard is intended to help decision makers make decisions. This app step has 3 simple analytics on it, a scatter plot of incident time vs. step time, a count of entries, and a pareto of downtime reasons. If you want more information about analytics, check out these articles:
- Intro to the Analytics Builder
- How to Embed Analytics in an app.
- How to Create your First Shop Floor Dashboard
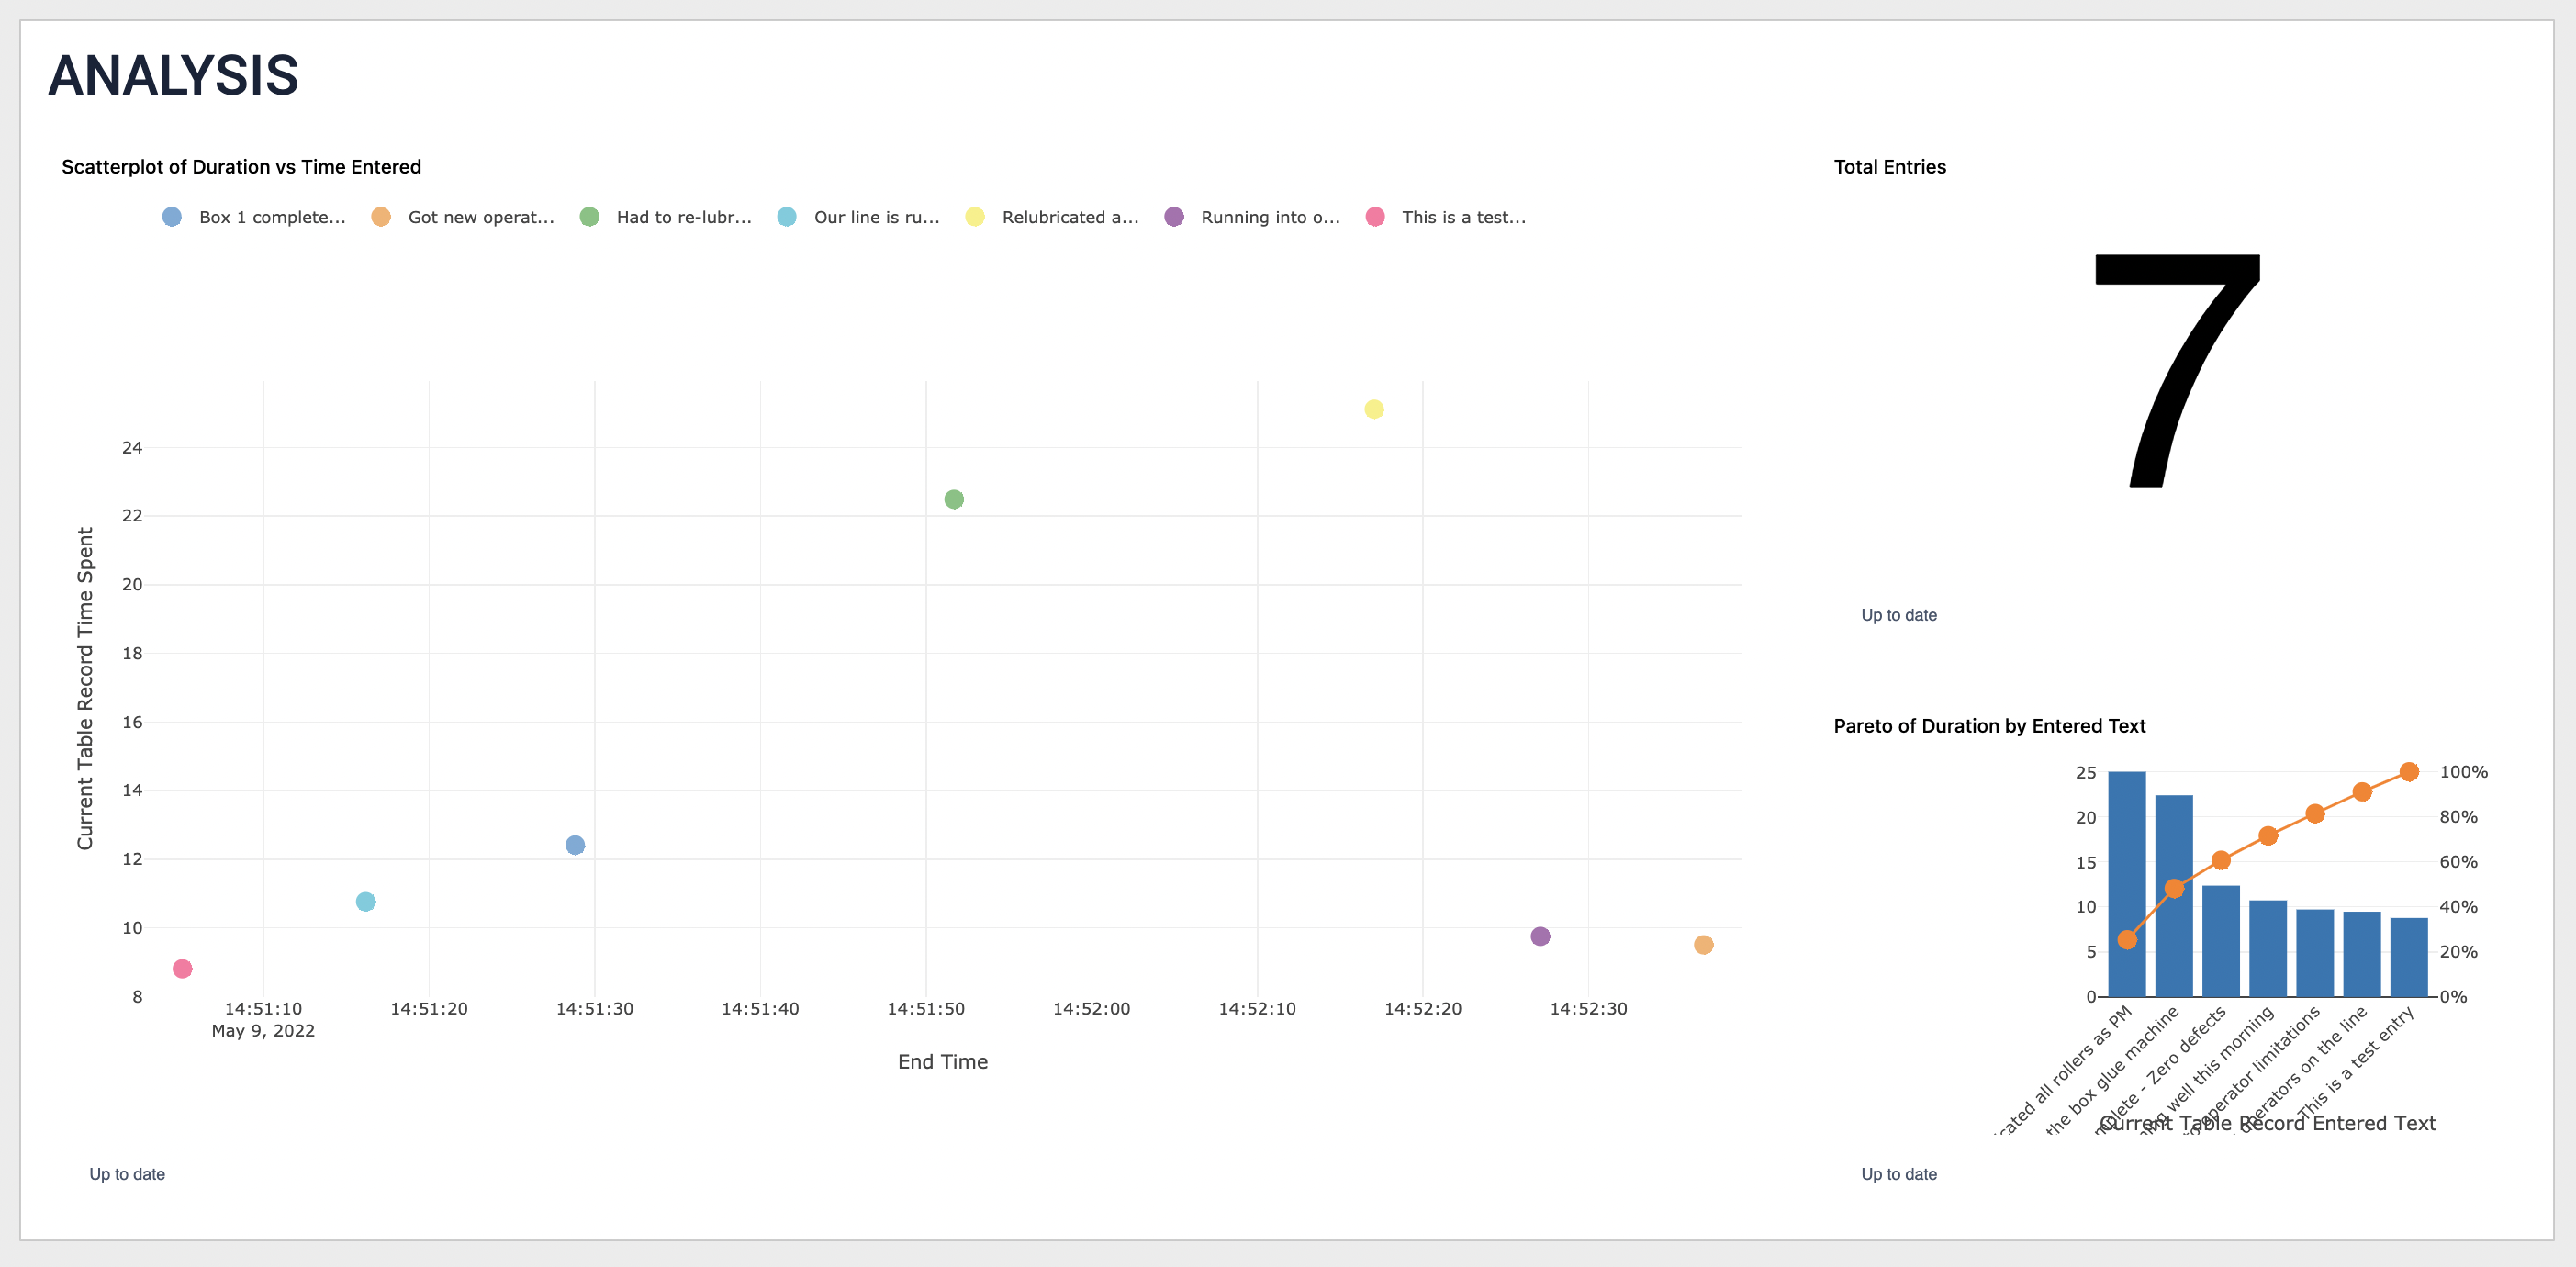
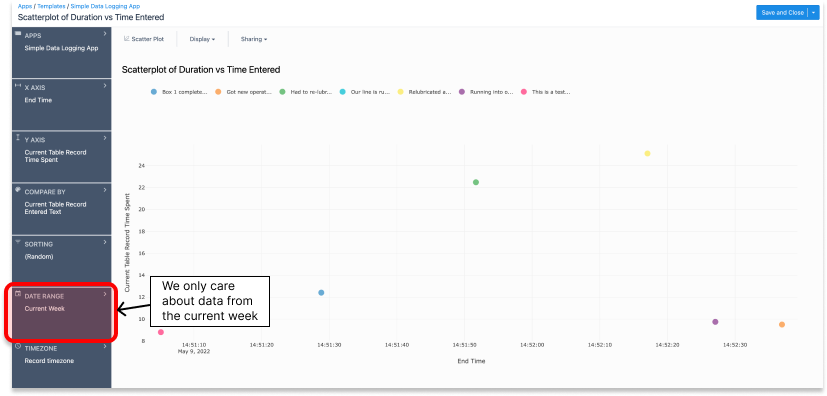
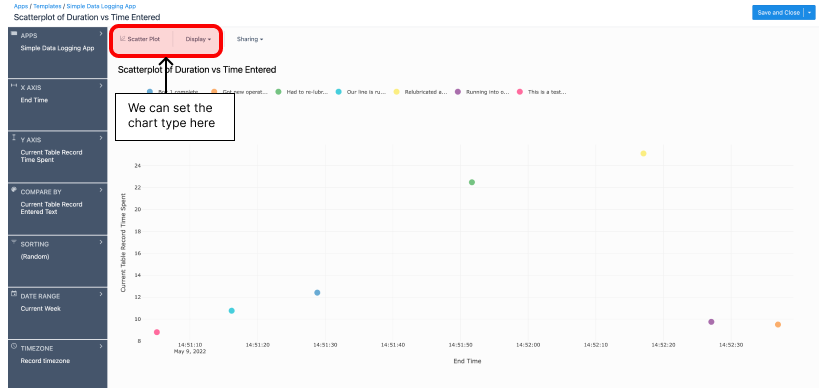
Lets deep dive into one of these analytics...
Analytics are entirely configurable to drive the insights you care about.
- Chart type can be changed to best suit your needs.
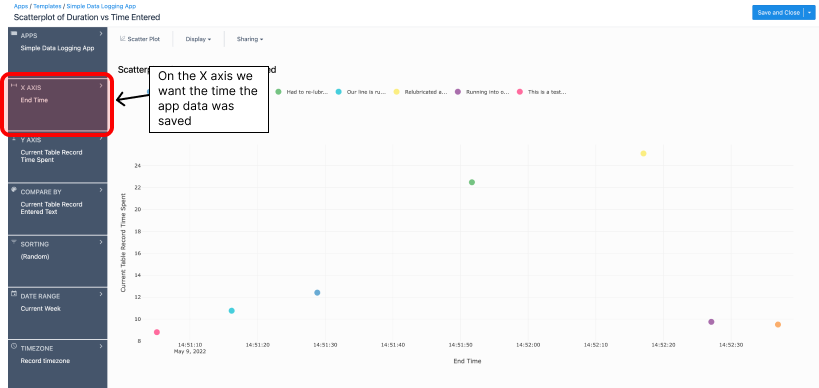
- The X axis is set to be the time where the Save All Data happened.
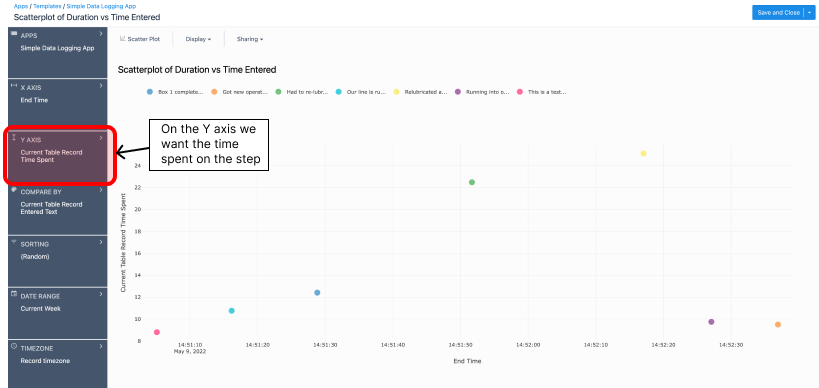
- The Y axis is the time spent on the step
- The compare by field allows you to conditionally format your analytic, in this case I want to sort by data by the text entered.
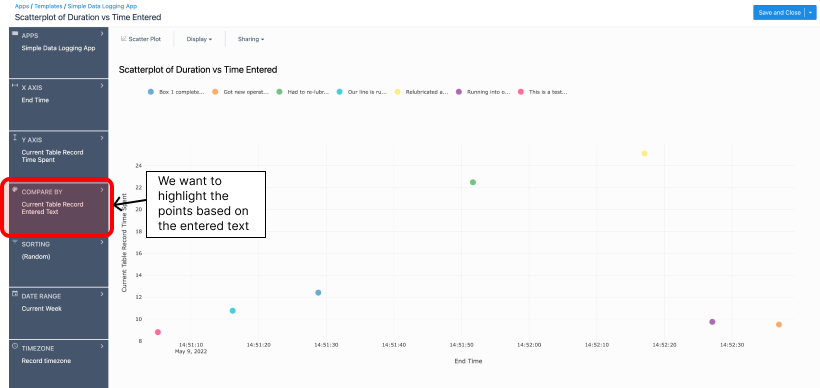
- By default your analytic will be filtered to the past week, this can be adjusted to fit your needs.