How to Create a New Analysis
- 17 Nov 2023
- 3 Minutes to read
- Contributors


- Print
How to Create a New Analysis
- Updated on 17 Nov 2023
- 3 Minutes to read
- Contributors
- Print
Article summary
Did you find this summary helpful?
Thank you for your feedback
Overview
Here are the range of chart formats in Tulip.
Analyses in Tulip are always associated with a specific App, Tulip Table or machine.
To create a new analysis, you first need to have an app with user completion data, a Tulip Table with data, or a machine configured in Tulip.
With the Tulip Analytics Builder, you can create and share charts and tables to analyze your factory’s performance.
How to Create a New Analysis
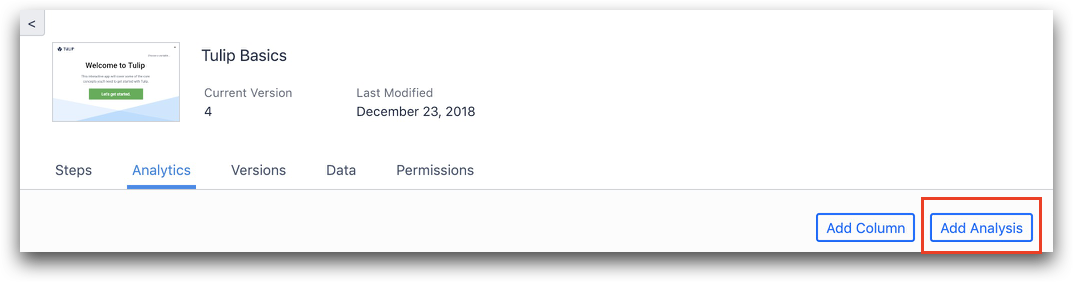
From the App Summary View, go to the “Analytics” tab and click “Add Analysis”:
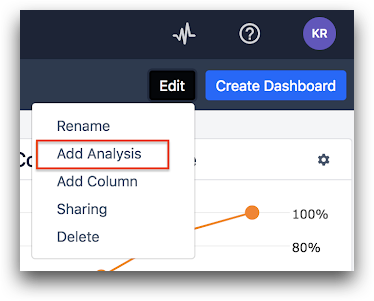
Alternatively, from a dashboard, select “Edit” and click “Add Analysis”.
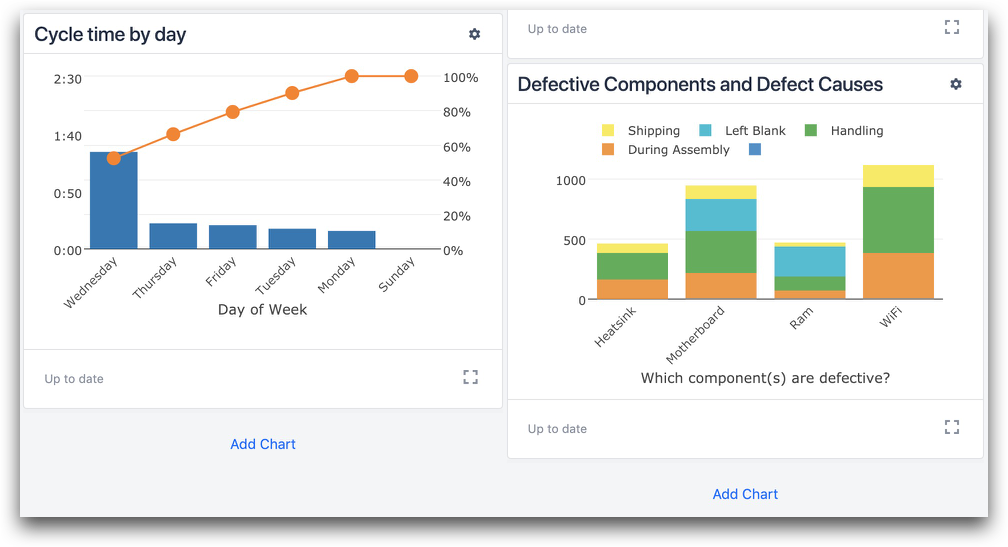
Or, scroll to the bottom of the dashboard and click “Add Chart” at the bottom of any column. You may then select a specific App and click “Create an Analysis”.
Once you have begun creating a new analysis, you will be prompted to select one of 7 different templates. The templates represent types of charts. Once you select a template you will be able to customize the data it shows. The templates are:

NOTE
Different analysis datasources have different visualization options.
One Operation - Compare one metric across one or two groupings. You can select pre-built options for:
- Process Completions by date
- Process completions by user
- Process completion by cycle time
Compare Variables - Compare multiple metrics from one or multiple apps. You can select pre-built options for:
- Average step time by users
- Comparing number variables
- Comparing boolean variables
Multiple Operations - Compare different metrics and Variables in the same place
Scatter Plot - Compare two continuous variables
Slideshow- If the app uses image capture in a Form Step, you can create a carousel of multiple images taken by operators with associated details.
Single Number - A single number
Table - Compare any number of operations and Variables
Once you have selected your analysis, you may customize the data you use in your analysis or your method for displaying it.
Did you find what you were looking for?
You can also head to community.tulip.co to post your question or see if others have faced a similar question!
.gif)
Was this article helpful?