Account Usage Page
- 23 Jan 2024
- 2 Minutes to read
- Contributors


- Print
Account Usage Page
- Updated on 23 Jan 2024
- 2 Minutes to read
- Contributors
- Print
Article Summary
Share feedback
Thanks for sharing your feedback!
Note
The Usage Page does not capture data before Q4 2023. Reach out to your Tulip Representative if you require usage data predating this period.
The Usage Page may not be available on all Tulip Instances. Contact your Tulip Representative if you are interested in gaining access.
The account usage page provides administrators with a high-level overview of the usage across your Instance. When product limits are approaching, they are highlighted on the Usage Page.
How To
Navigating to the Usage Page
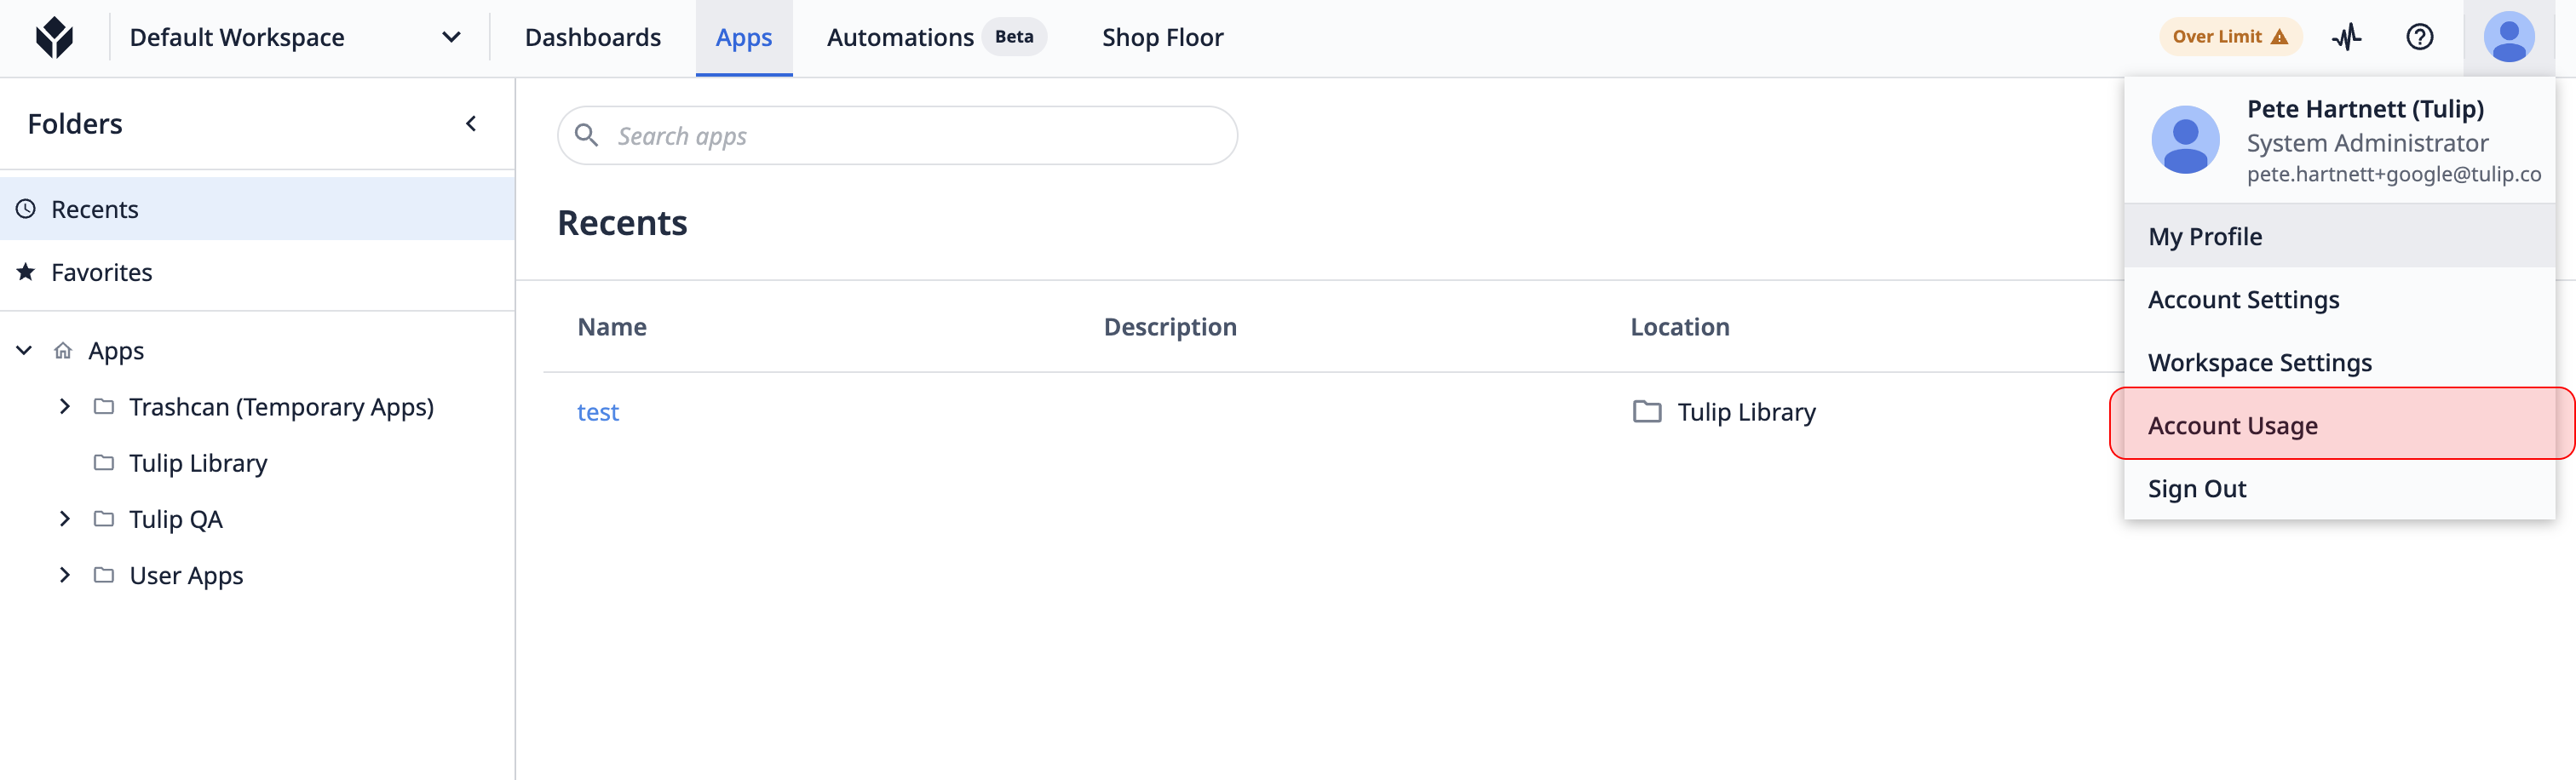
Accessible to users with the Account Owner Role (Adding Users and Managing User Roles), the Usage Page can be found in the user profile menu. Users without access will not see this menu option.
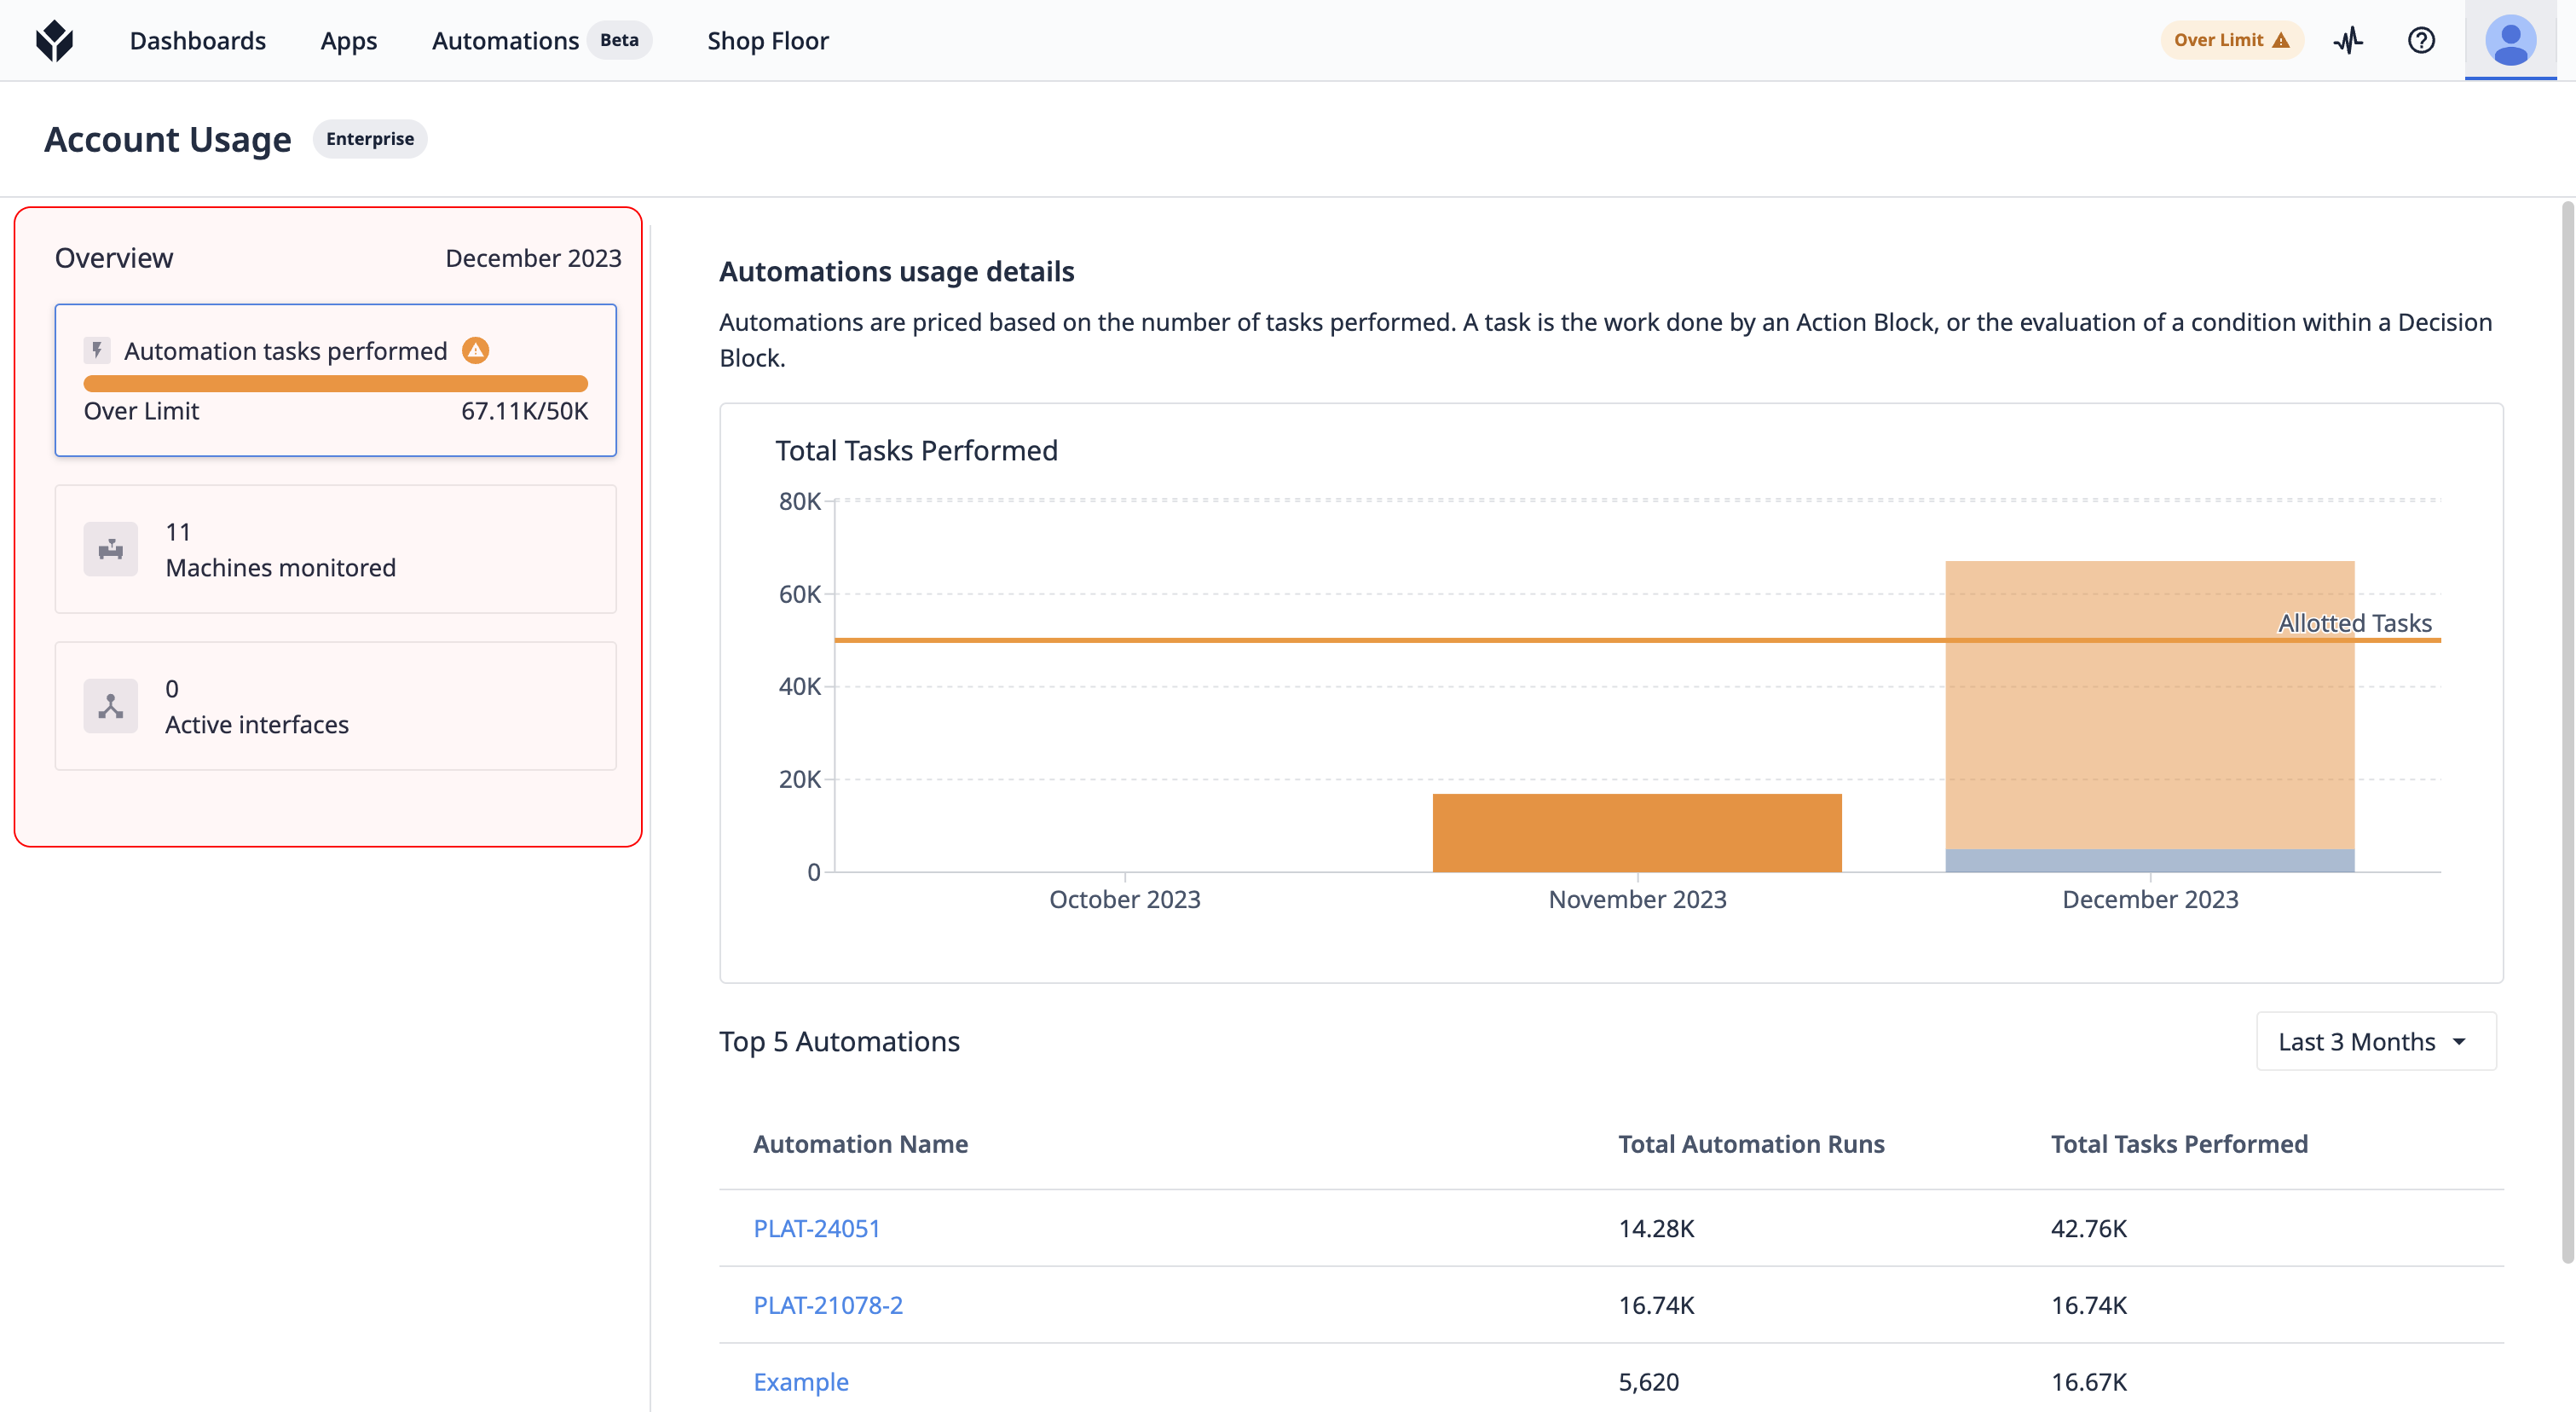
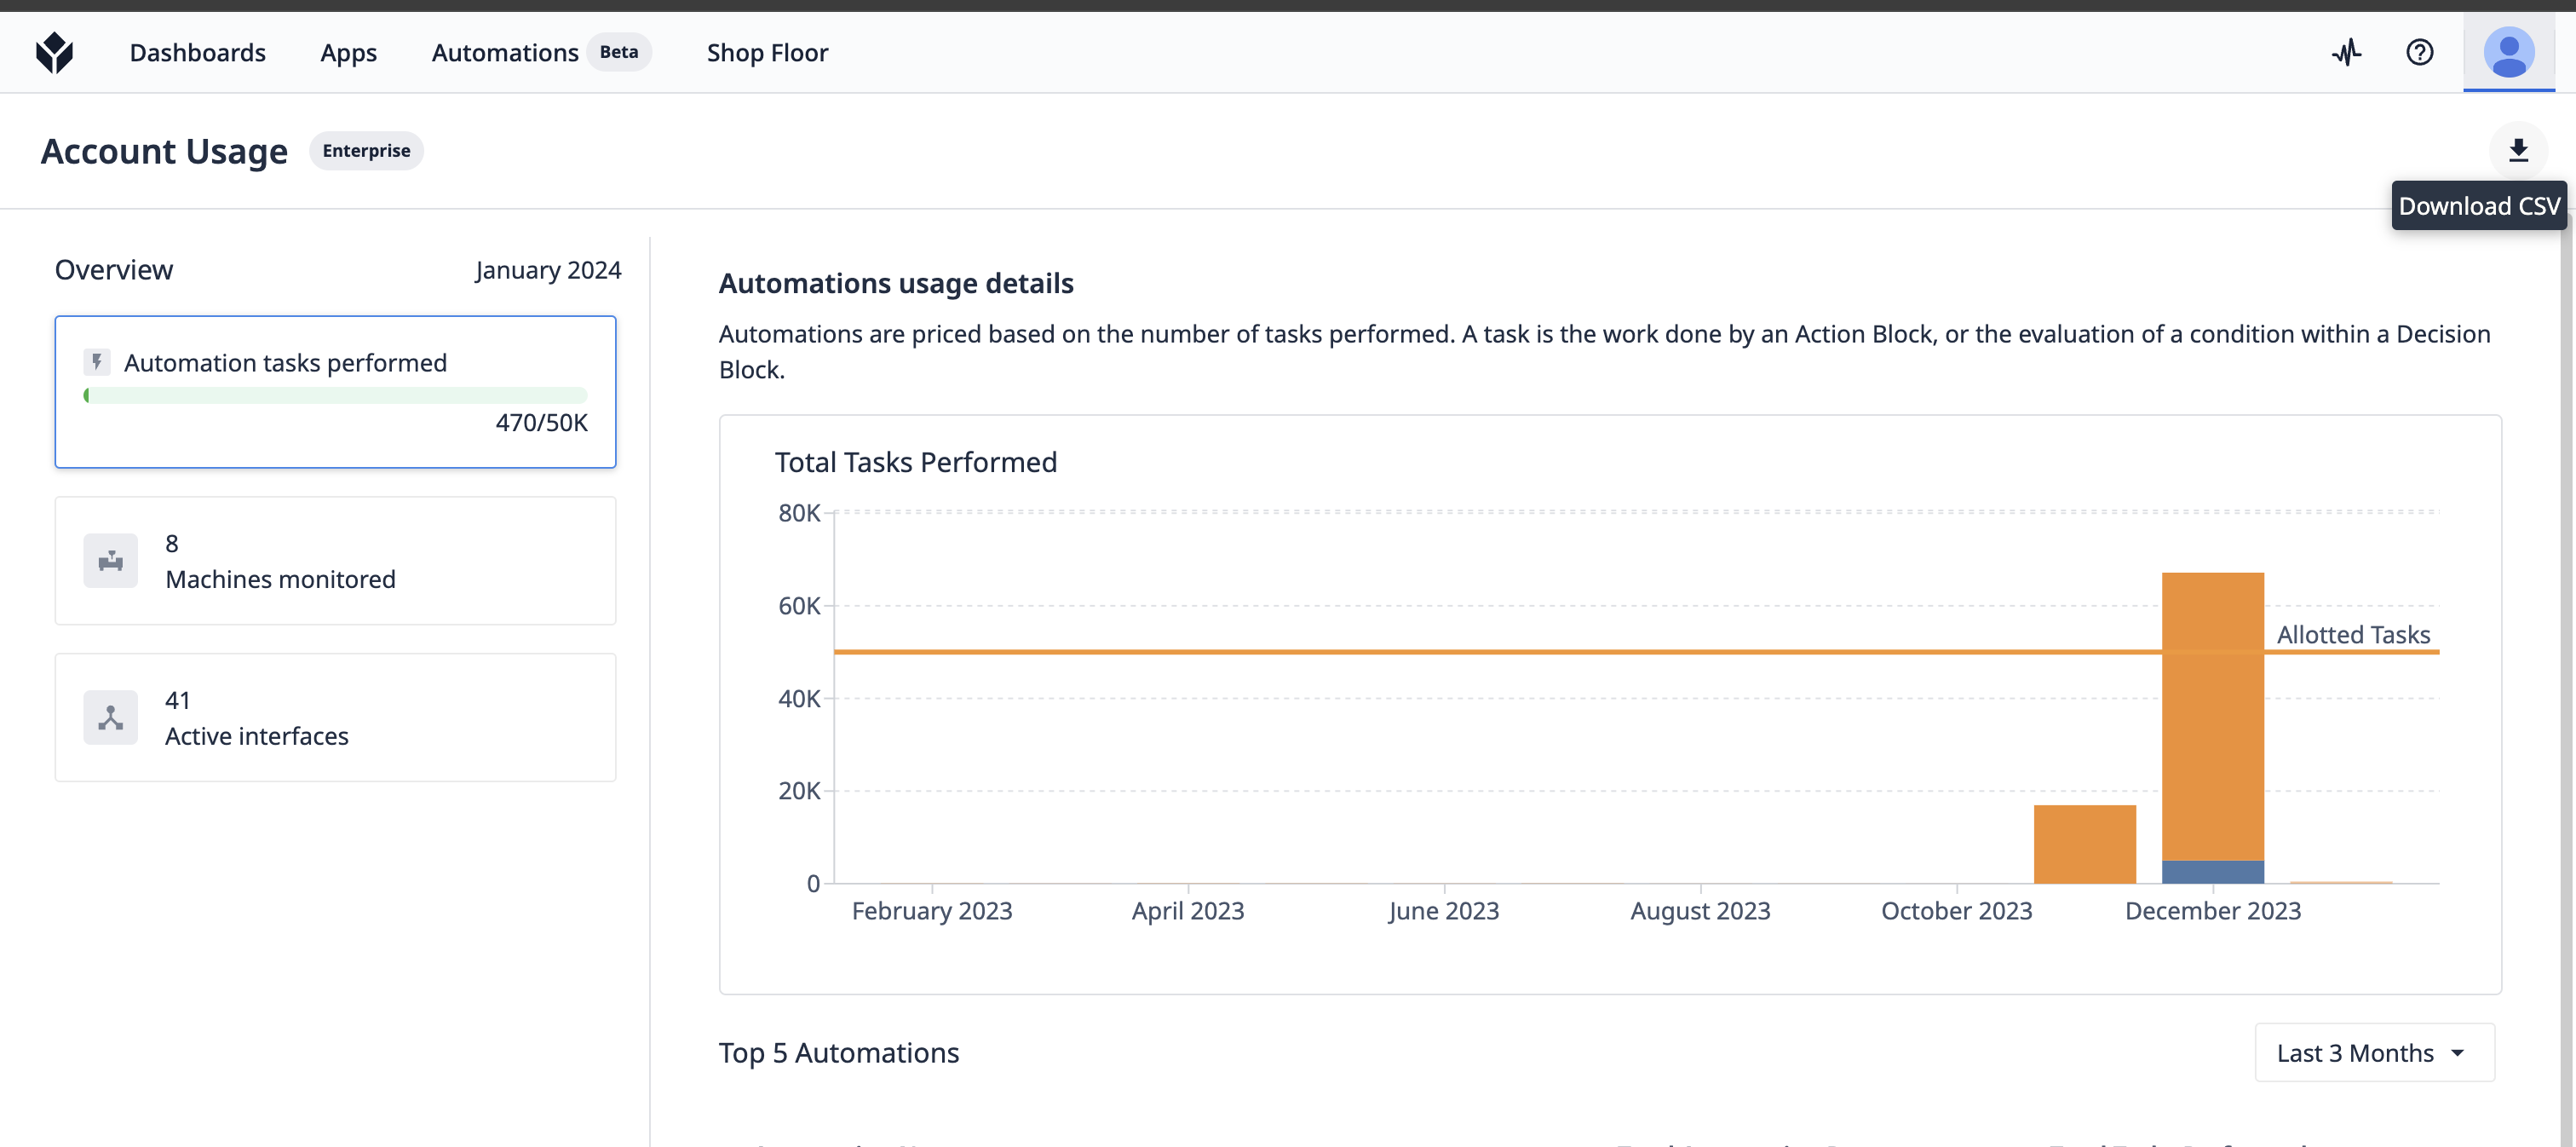
Usage Cards
Usage is categorized into cards for machines, interfaces, and Automations. Clicking on each card reveals the respective asset's usage data.
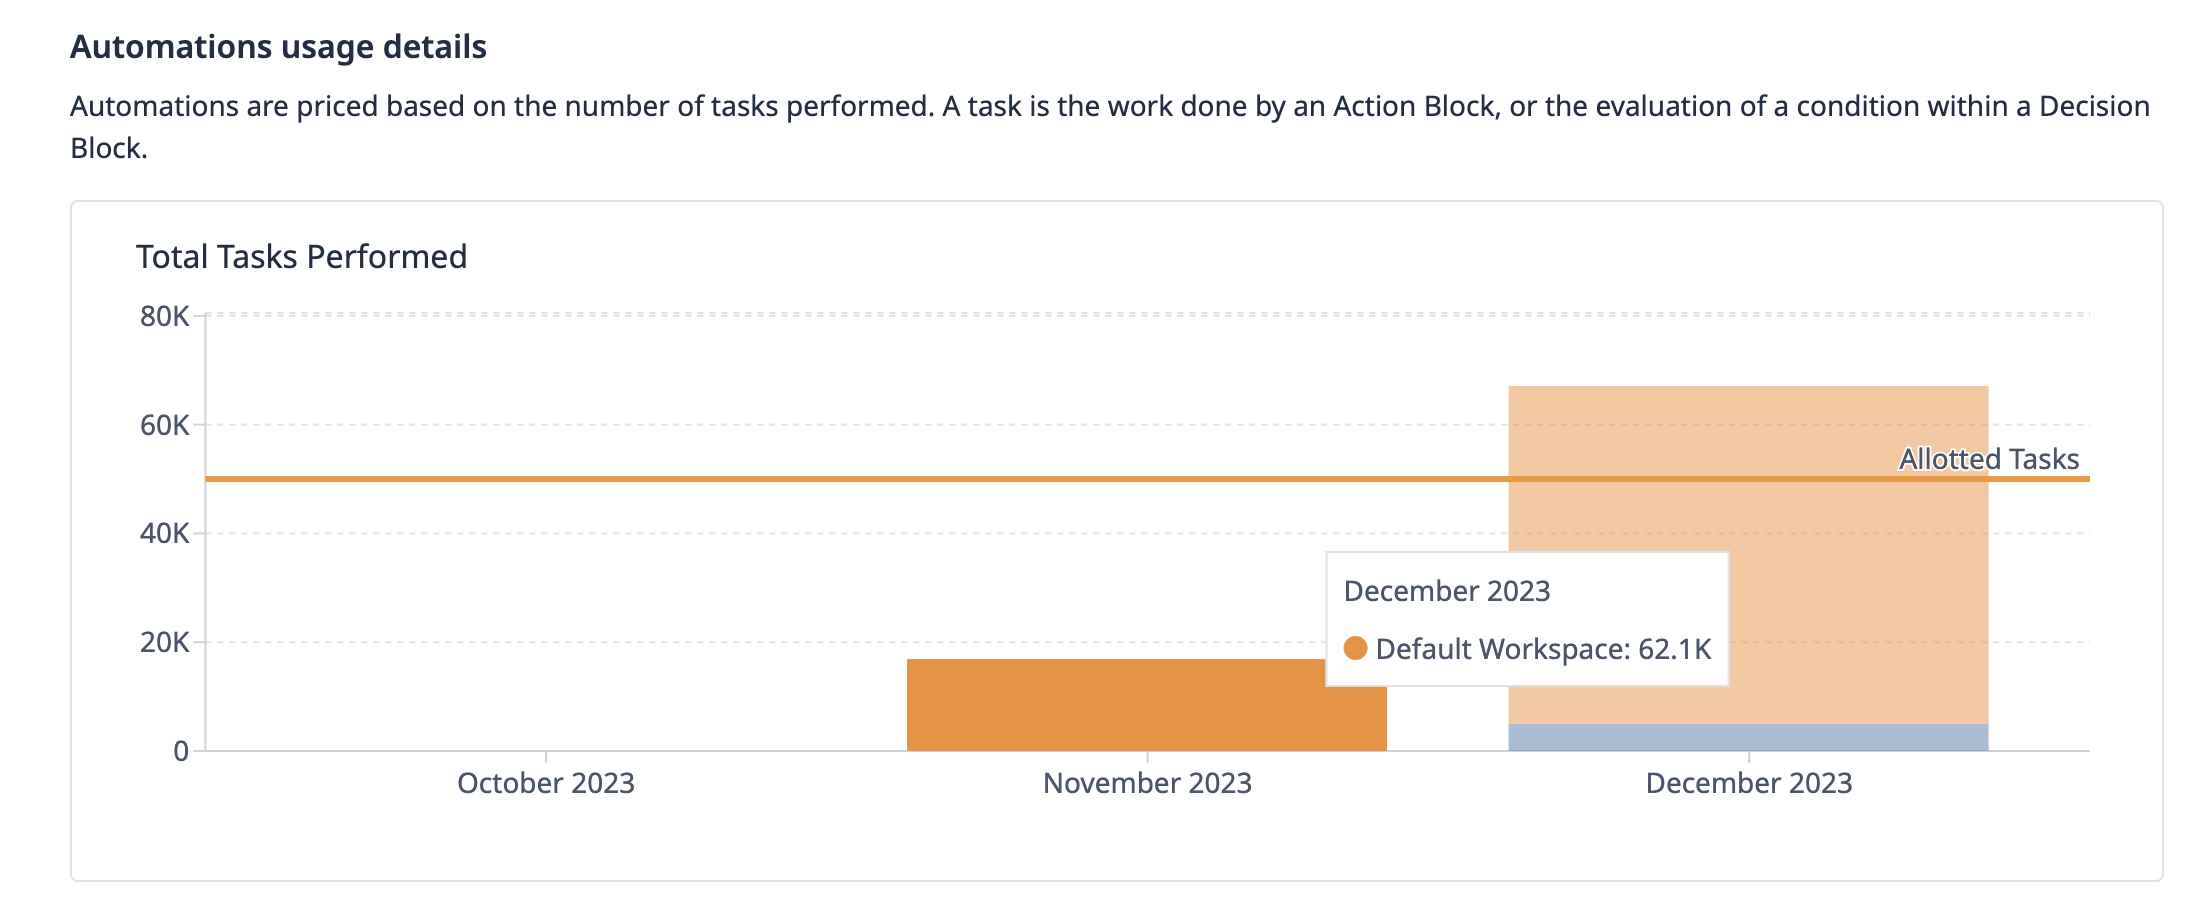
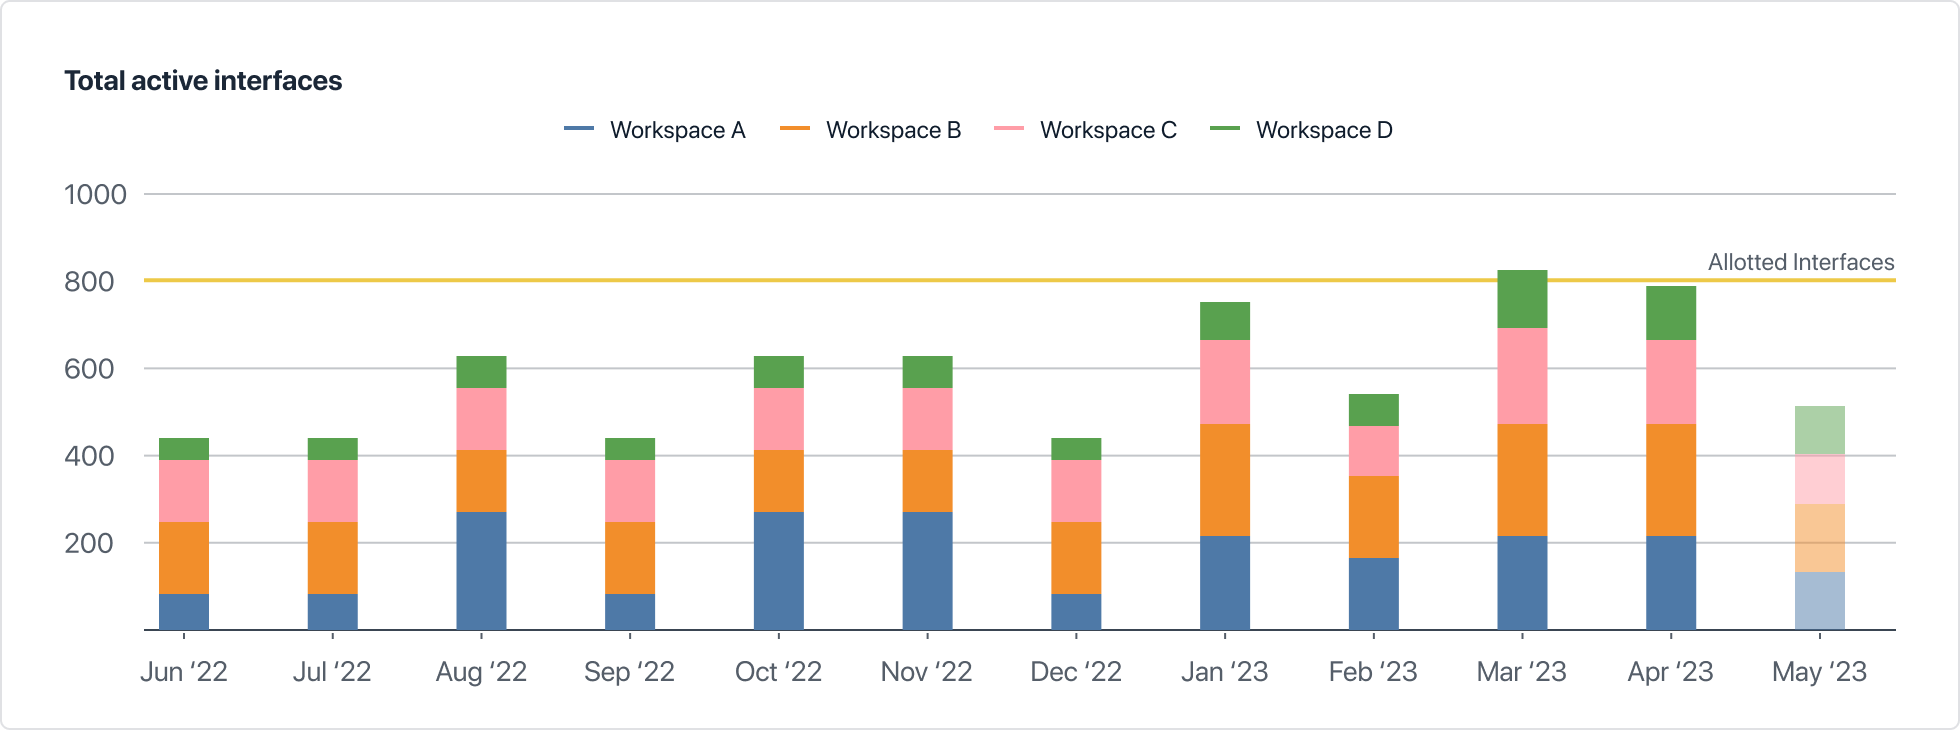
Month-by-Month Chart
Usage data is organized by month and segmented by Workspace (if enabled). Hovering on the graph exposes usage for each bar section. If available, 12 months of data will be shown.
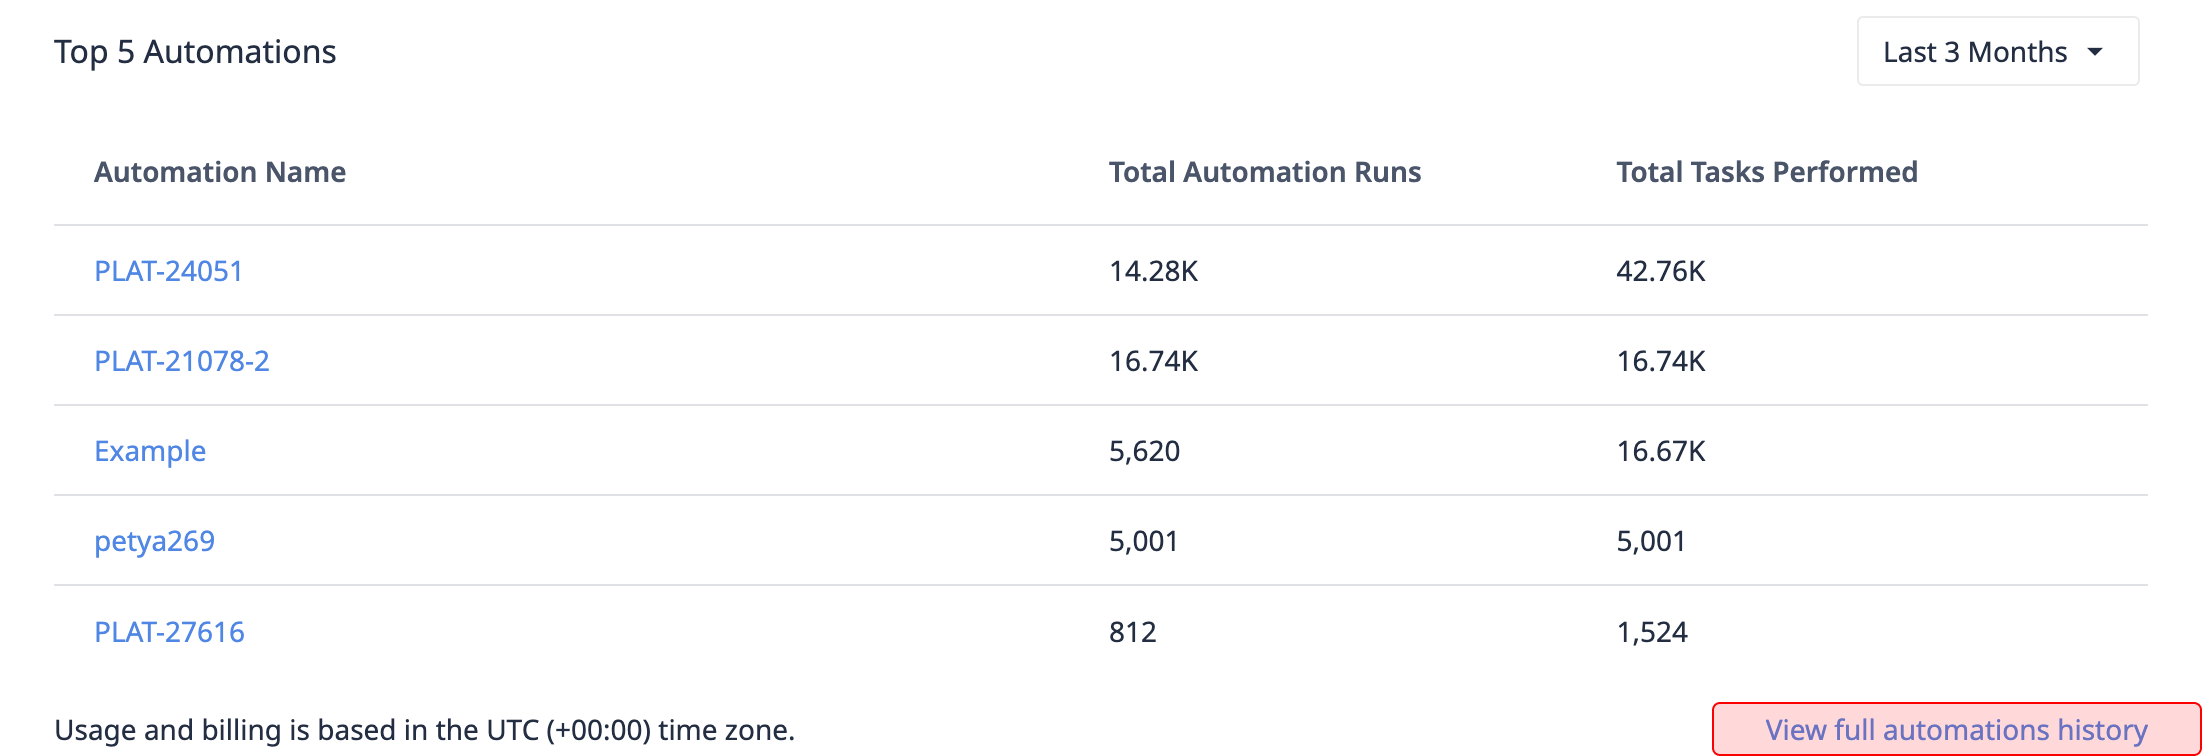
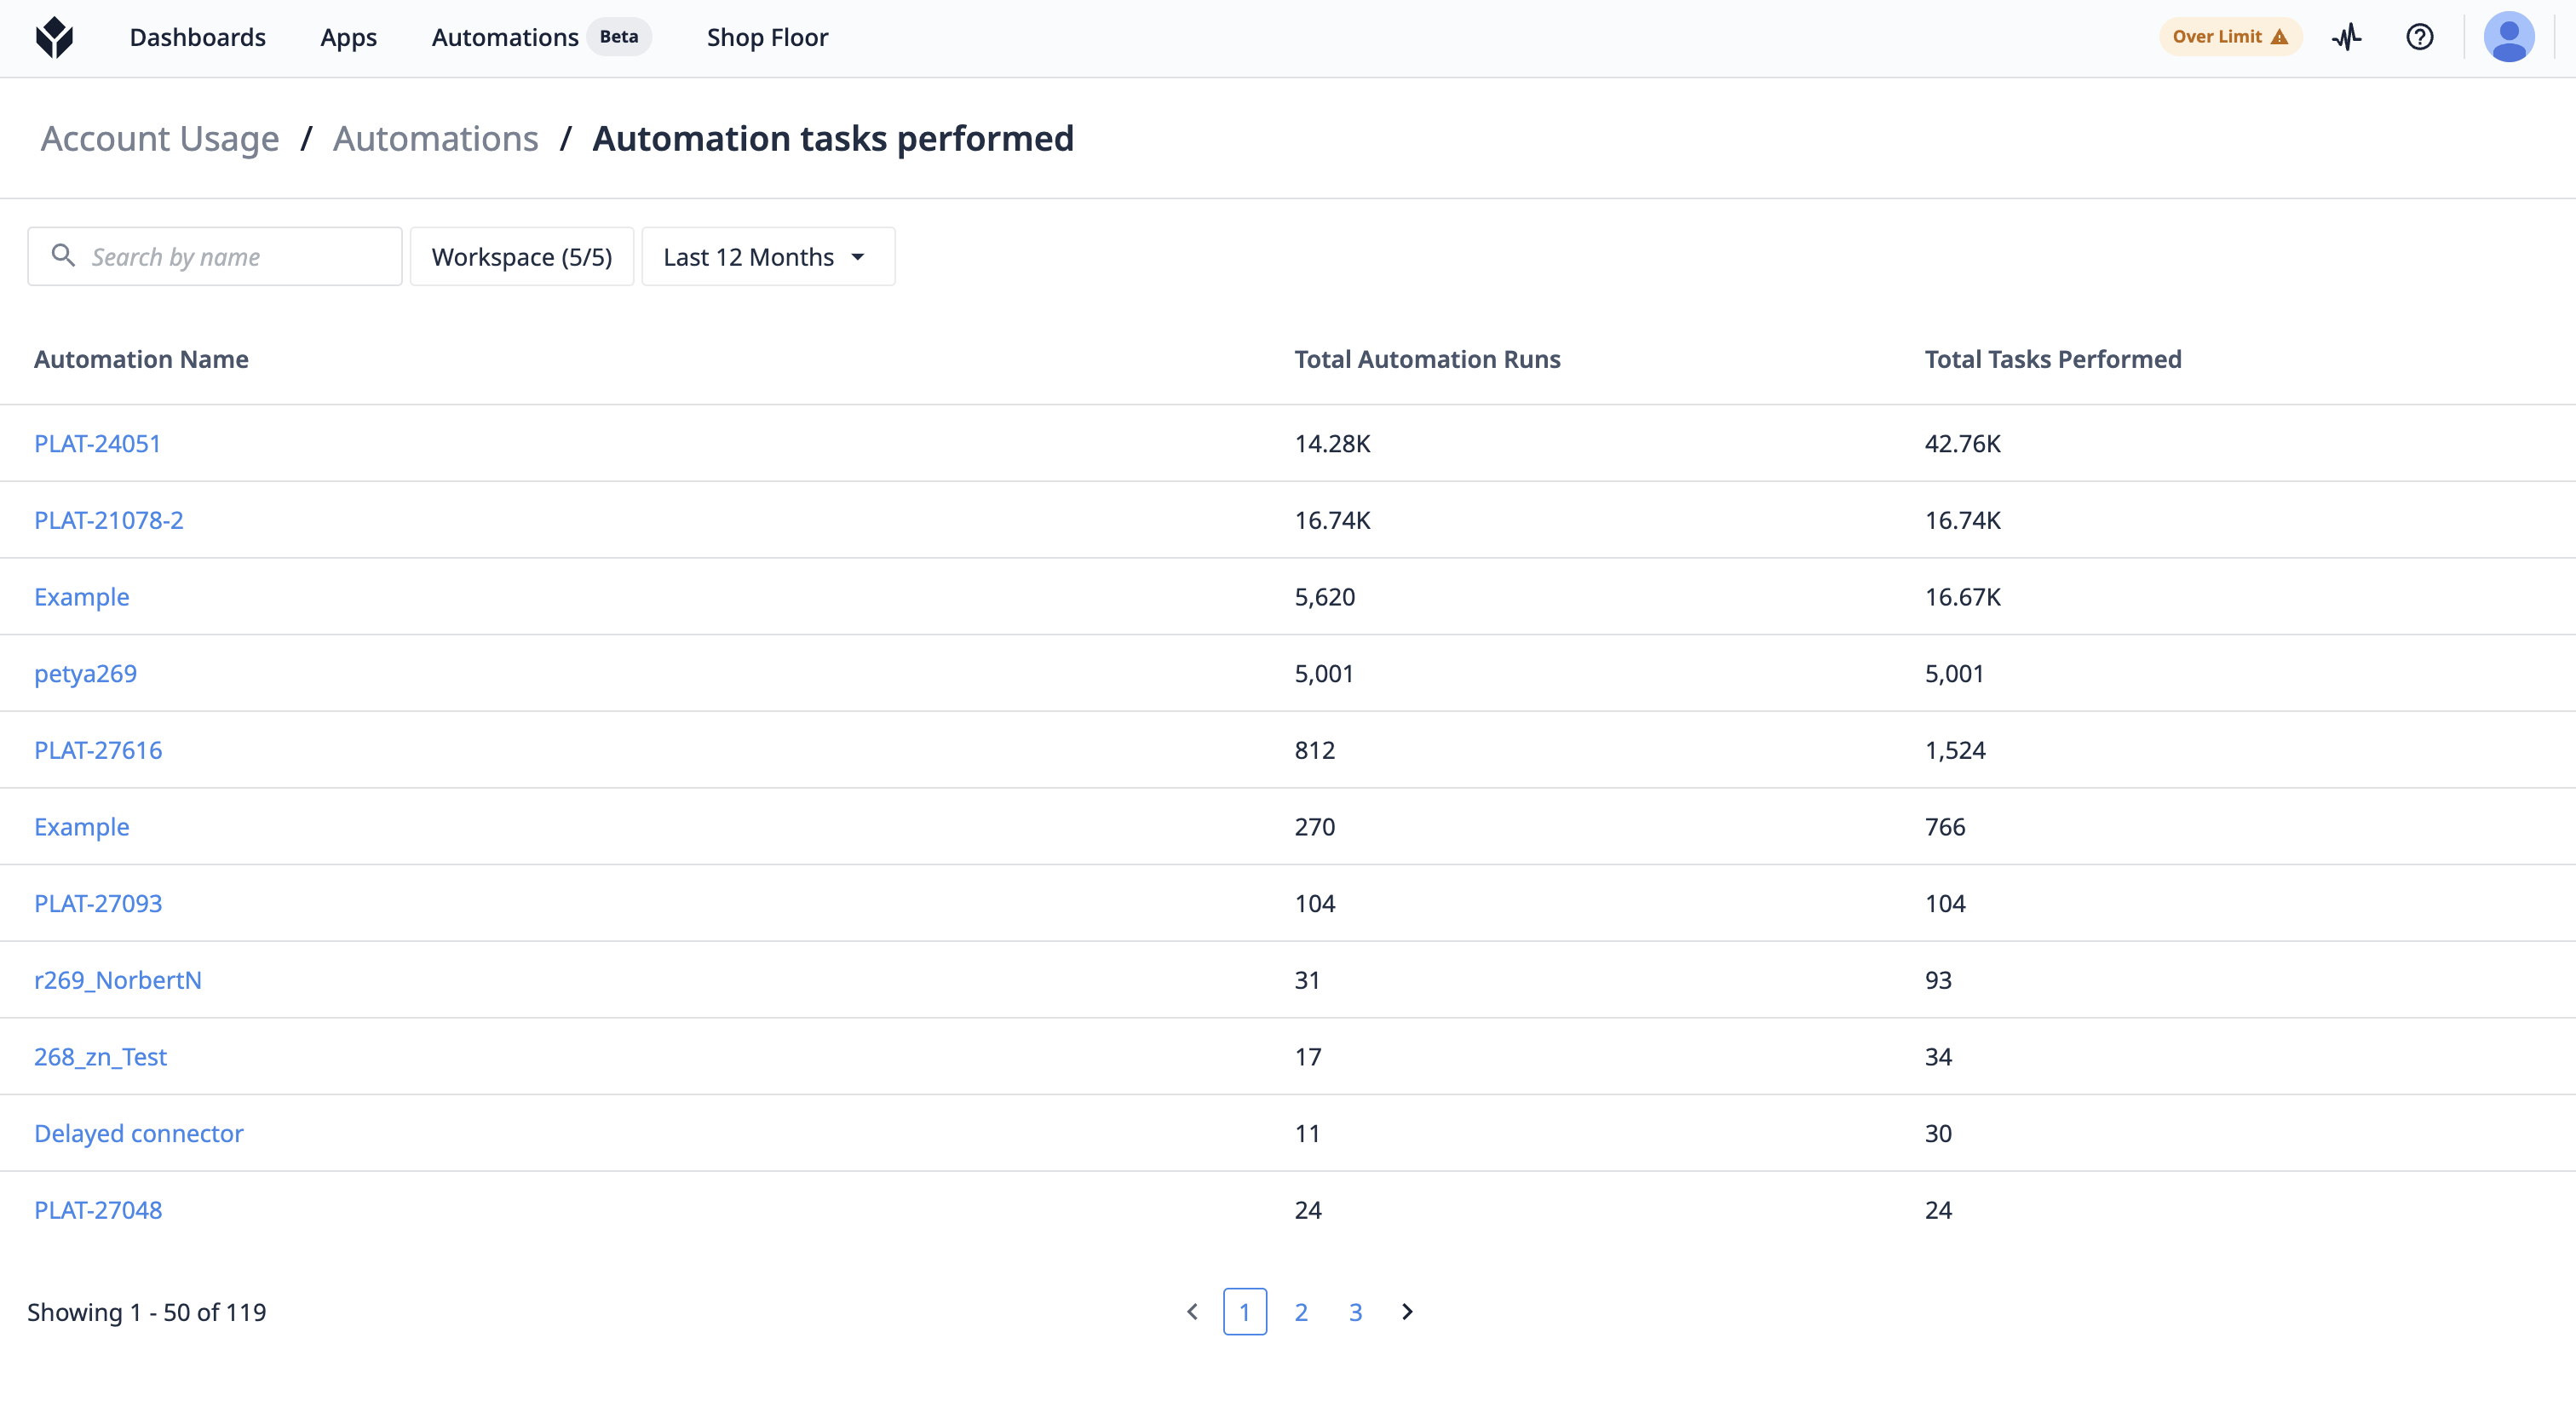
Usage Table
The most active Automations/Machines/Interfaces are displayed below the month-by-month chart. View full usage data by selecting "View full automation/machine/interface history".
Export Data
For external tracking, the usage data by month can be exported to a .csv file.
 |
|---|
| Account Usage Page |
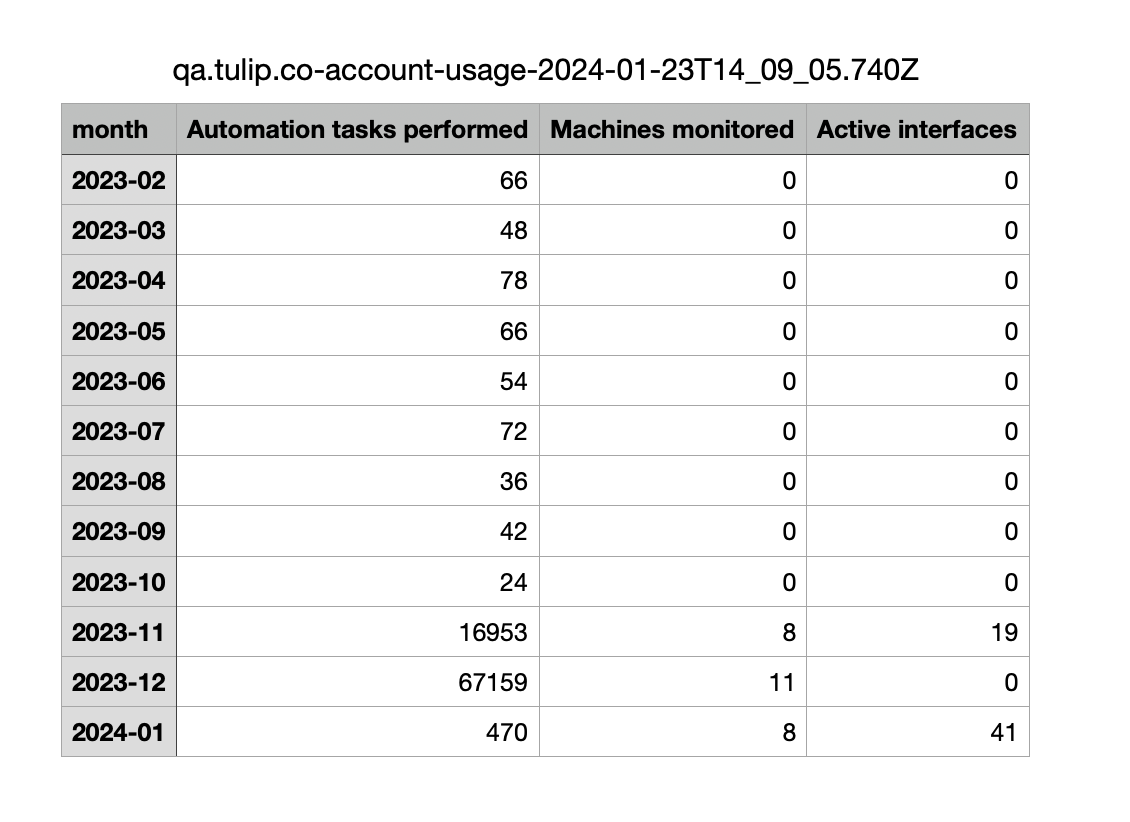 |
|---|
| Exported Data |
Usage Limits
Each Tulip Instance has limits for Automations, Machines, and Interfaces. As you approach these limits, a progress bar appears on the usage card, accompanied by a horizontal allocation limit line on the month-by-month chart. Although Tulip doesn't automatically block usage upon reaching limits, warnings will be exposed throughout the product. These limits can be adjusted by your Tulip Representative if needed.
For each asset, there are performance limits, significantly higher than allocated limits, to protect product performance. These limits cannot be easily extended, and reaching them may limit additional usage.
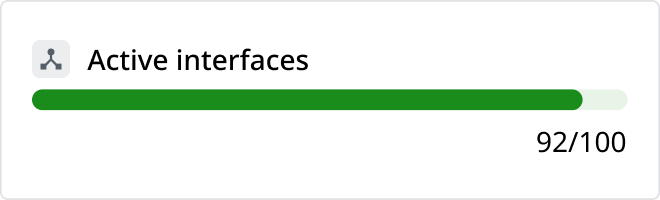
Nearing Limit
Approaching allocated limits adds a horizontal line to the usage chart, with progress towards the limit on the usage card.
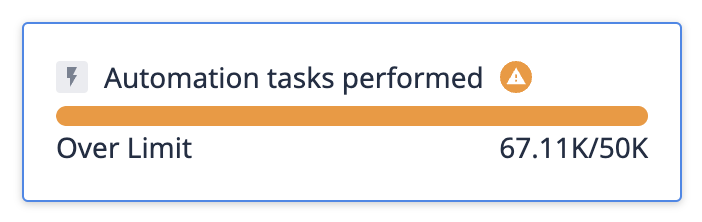
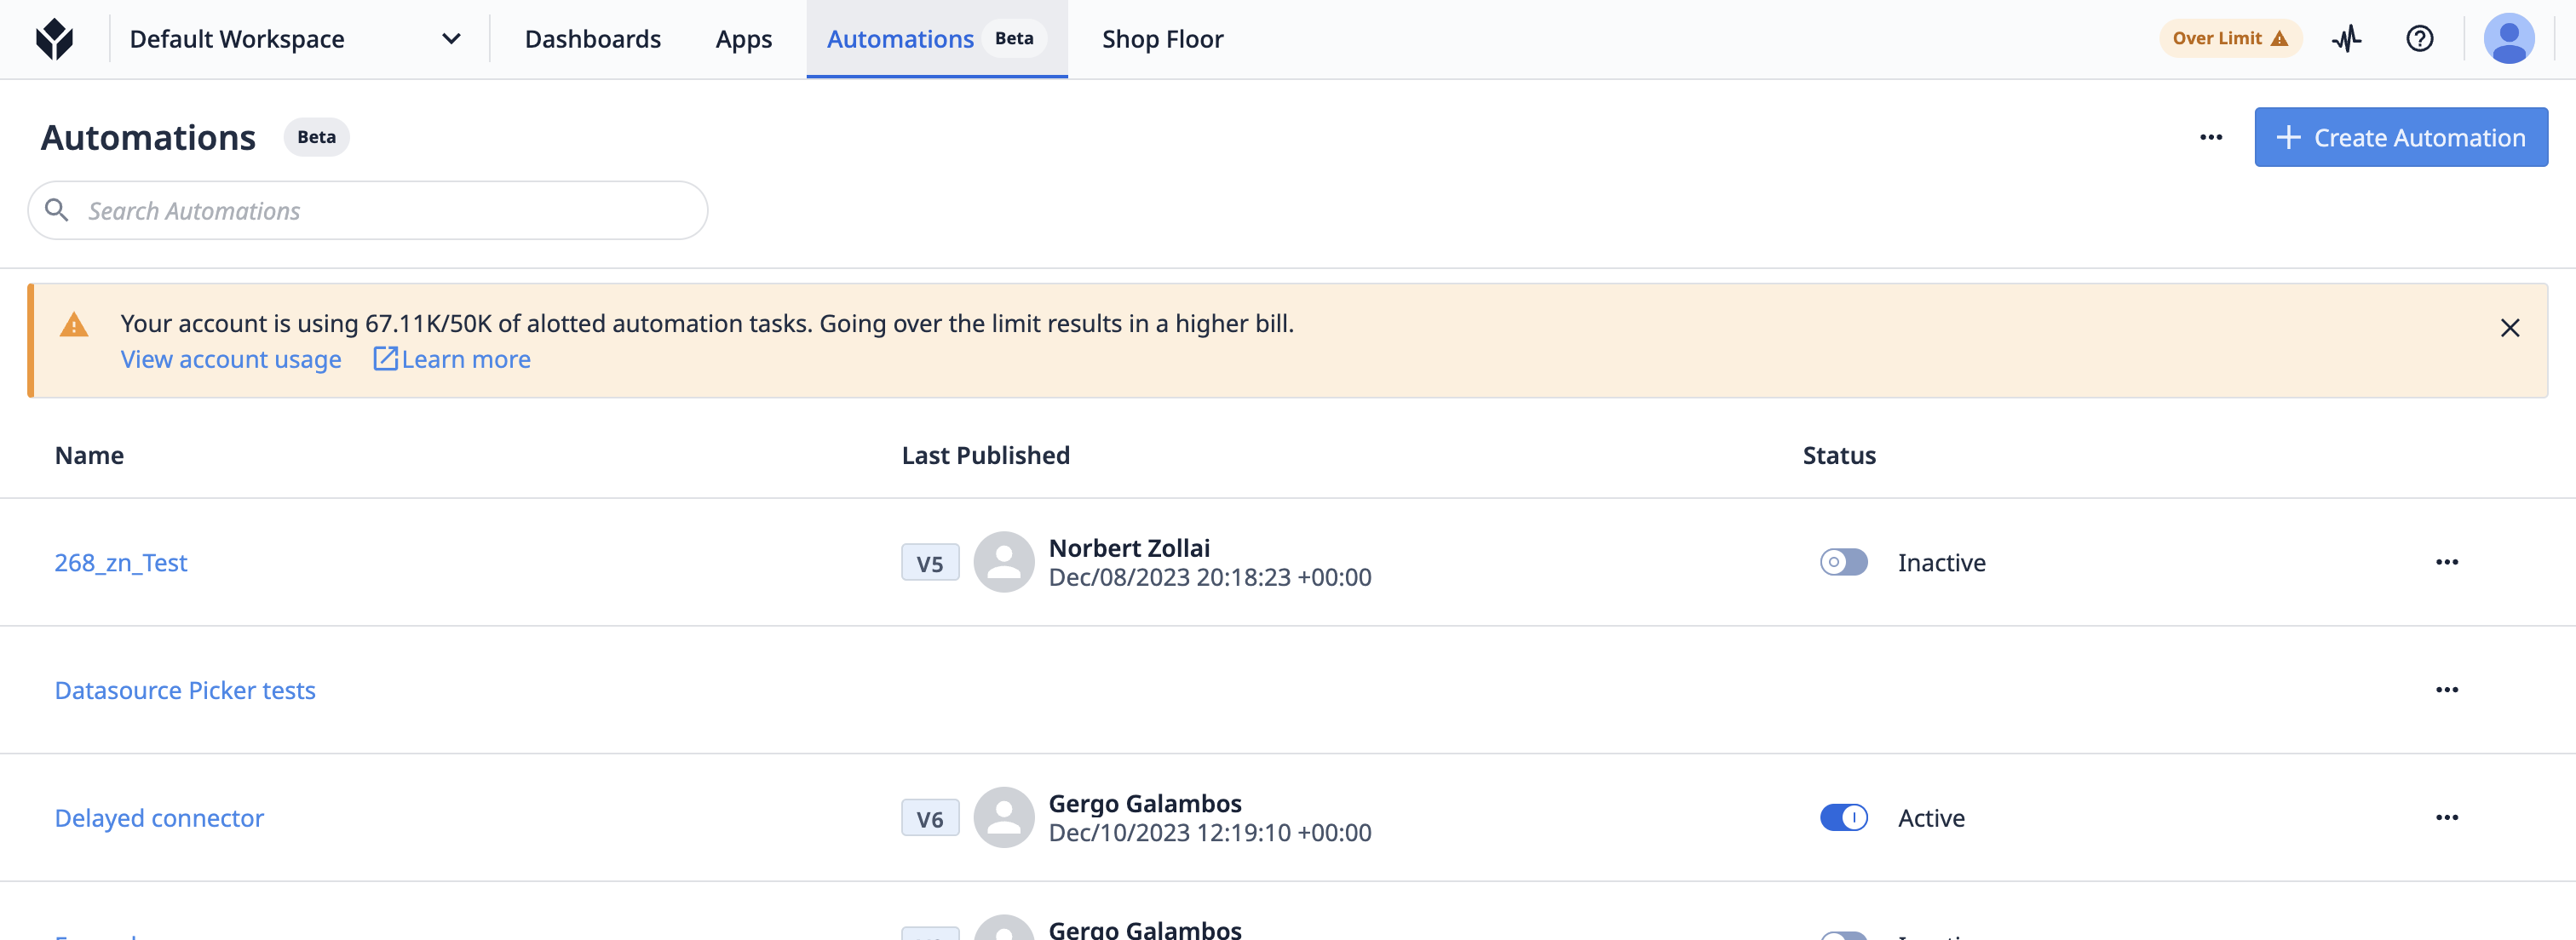
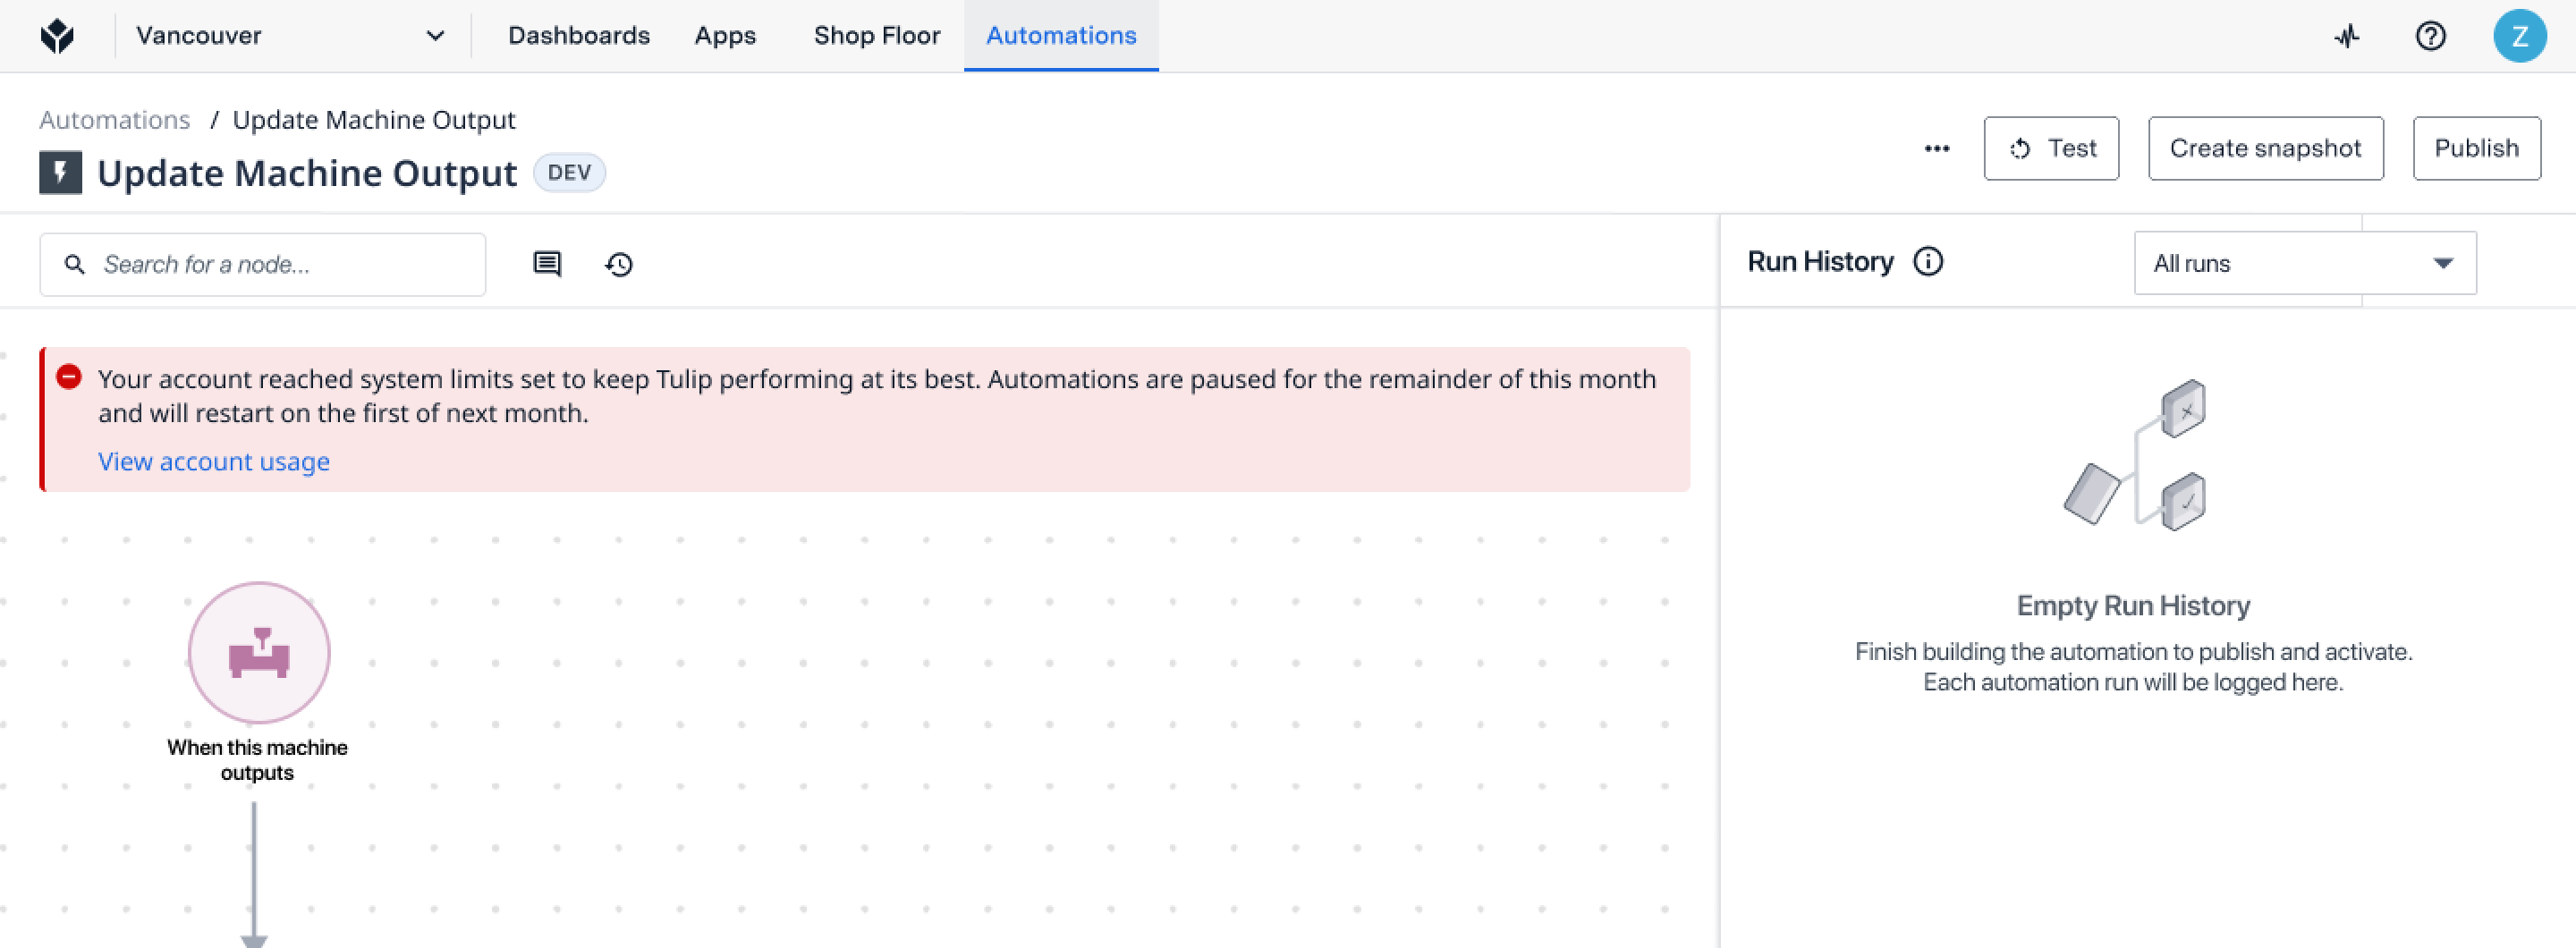
Over Limit
Upon reaching a limit, the usage card indicates an overage. A limit pill is added to the ribbon, and warning ribbons appear on pages for the respective asset.
Usage Card
Ribbon Notification

Automations/Stations/Machines Page
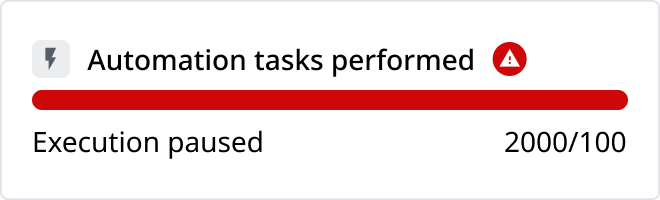
Over Performance Limit
Approaching the performance limit triggers in-product notifications, urging immediate action.
Usage Card
Ribbon Notification

Automations/Stations/Machines Page
Did you find what you were looking for?
You can also head to community.tulip.co to post your question or see if others have faced a similar question!
Was this article helpful?